0449
Modelling the effect of hyperoxia on the spin-lattice relaxation rate R1 of tissues
Emma Bluemke1, Eleanor Stride1, and Daniel Bulte1
1Institute of Biomedical Engineering, University of Oxford, Oxford, United Kingdom
1Institute of Biomedical Engineering, University of Oxford, Oxford, United Kingdom
Synopsis
The paramagnetic relaxivity effect of oxygen on longitudinal relaxation rate (R1) has been explored as a means of inferring partial pressure of oxygen in the tissue or bodily fluids, and examining tissue R1 response to hyperoxic gas breathing is used in research techniques such as oxygen-enhanced MRI. We present a 3-compartment model for estimating the hyperoxia-induced changes in R1 of tissues depending on B0, SO2, blood volume, hematocrit, oxygen extraction fraction, and changes in blood and tissue PO2. It is easy for researchers to tailor this model to their tissue of interest by substituting preferred tissue oxygen diffusion/consumption models.
Introduction
Inducing hyperoxia in tissues is common practice for different areas of research including oxygen-enhanced MRI (OE-MRI), which attempts to use the resulting signal changes to detect regions of hypoxia1,2. In addition, researchers have investigated using the paramagnetic relaxivity of oxygen (r1Ox) on longitudinal relaxation rate (R1) as a means of inferring partial pressure of oxygen in the tissue (PO2)3–5. The linear relationship between PO2 and R1 has been reproduced in phantom solutions3,4,6–14 and body fluids such as vitreous fluid4, however in tissue and blood experiments, there have been so-called ‘contradictory’ R1 changes reported, where either no change or a negative change in R1 is observed 5,15, likely due to changes in blood oxygen saturation levels (SO2)16.Therefore, we present a 3-compartment model for estimating the changes in R1 that could be expected in healthy, hypoxic and necrotic tumour tissues depending on field strength B0, SO2, blood volume (BV), hematocrit, oxygen extraction fraction (OEF), and changes in blood and tissue PO2. We then demonstrate an application of this model by estimating the expected R1 changes in tissues from breathing increased levels of oxygen, such as the hyperoxic gas challenges in OE-MRI.
Methods
An overview of the model is illustrated in Figure 1. The model can be conceptually separated into 4 steps:Step 1. Calculate PO2 along the capillary. The ΔR1B,deOx and ΔR1T and ΔR1B,Ox are all related by a calculation of the SO2 or PO2 along the capillary length, which is determined by the arterial PO2 and the OEF of the tissue.
Step 2. Calculate ΔPO2 of each compartment. Knowing the PO2 along the capillary allows the ΔPO2 from oxygen administration to be calculated in the blood and tissue compartments, using the Krogh tissue cylinder to model the oxygen diffusion into the tissue, and the set OEF is related to the tissue oxygen consumption rate. The Krogh tissue cylinder radius is calculated from the set blood volume.
Step 3. Calculate ΔR1 of each compartment. Knowing the ΔPO2 in each compartment allows the ΔR1T to be calculated using the r1Ox (calculated with respect to B0 using a model published by Bluemke et al. 17); the ΔR1 of each blood compartment to be calculated using a Blood R1 model published by Bluemke et al. 16.
Step 4. Calculate ΔR1 of voxel. Once the ΔR1 in each compartment is calculated, we use the set blood volume fraction (BV) to calculate the resulting ΔR1 of the voxel (ΔR1voxel).
Results & Discussion
The overview of the resulting set of functions is provided in Figure 2. The 5 independent variables were: B0, hematocrit, OEF, BV, and Pcrit. Next, there are 4 dependent variables that are calculated from these independent variables: (1) the fraction of erythrocytes in whole blood fe is calculated from hematocrit, (2) r1Ox is calculated from B0, (3) the Krogh tissue radius Rt is calculated from OEF and BV, and the tissue oxygen consumption rate is calculated from OEF, Rt, and Pcrit. The effect of OEF on the ΔR1 of the arterial, venous, and tissue compartments individually, and total voxel ΔR1 for varied PaO2 changes induced from increased oxygen breathing is shown in Figure 3.To demonstrate a specific application of the model, the resulting ΔR1 expected in healthy, hypoxic and necrotic tumour tissues is shown in Figure 4. The resulting ΔR1 are consistent with reported literature OE-MRI results in that (1) the vascular periphery shows greater +ΔR1 than the hypoxic regions and necrotic regions; (2) the necrotic regions show great +ΔR1 than hypoxic but less than vascular periphery; (3) the less hypoxic tumour shows greater +ΔR1 than the more hypoxic tumour; and (4) healthy brain tissue would show a very small change that may be indetectable (consistent with data from Muir et al18 and Bhogal et al19 showing no significant change in ΔR1 of healthy brain tissue from a hyperoxic gas challenge). The resulting ΔR1 calculated from this model using the hematocrit ranges for female (0.36-0.48) and male (0.41-0.50) groups separately is shown in Figure 5, which agree with findings by Kindvall et al that differences in hematocrit levels may sometimes be a confounding factor20,21.
For the purpose of this abstract, we use the popular Krogh tissue cylinder model and Michaelis-Menten equation for oxygen consumption. However, since modelling tissue oxygenation is an active area of research, this model has been designed to make it possible for a researcher to easily substitute their preferred model for tissue oxygen diffusion/consumption and tailor this model to their tissue of interest.
Conclusion
We present a 3-compartment model for estimating the changes in R1 that could be expected in healthy, hypoxic and necrotic tumour tissues depending on field strength B0, SO2, blood volume (BV), hematocrit, oxygen extraction fraction (OEF), and changes in blood and tissue PO2. In a demonstration of the model, the resulting ΔR1 are consistent with reported literature OE-MRI results in a variety of tissues. This model has been designed to be easy for researchers to tailor to their tissue of interest by substituting their preferred model for tissue oxygen diffusion and consumption.Acknowledgements
EB is supported by funding from the Engineering and Physical Sciences Research Council (EPSRC) and Medical Research Council (MRC) [grant number EP/L016052/1] and the Clarendon Scholarship fund. DB and ES also gratefully acknowledges funding from the EPSRC [grant numbers EP/S021507/1 and EP/L024012/1].References
- Dewhirst, M. W.; Birer, S. R. Oxygen-Enhanced MRI Is a Major Advance in Tumor Hypoxia Imaging. Cancer research 2016, 76 (4), 769–772. https://doi.org/10.1158/0008-5472.can-15-2818.
- O’Connor, J. P. B.; Robinson, S. P.; Waterton, J. C. Imaging Tumour Hypoxia with Oxygen-Enhanced MRI and BOLD MRI. The British journal of radiology 2019, 92 (1095), 20180642. https://doi.org/10.1259/bjr.20180642.
- Muir, E. R.; Zhang, Y.; Nateras, O. S. E.; Peng, Q.; Duong, T. Q. Human Vitreous: MR Imaging of Oxygen Partial Pressure. Radiology 2013, 266 (3), 905–911. https://doi.org/10.1148/radiol.12120777.
- Simpson, A. R. H.; Dowell, N. G.; Jackson, T. L.; Tofts, P. S.; Hughes, E. H. Measuring the Effect of Pars Plana Vitrectomy on Vitreous Oxygenation Using Magnetic Resonance ImagingEffects of PPV on PO2 Using MRI. Investigative Ophthalmology & Visual Science 2013, 54 (3), 2028–2034. https://doi.org/10.1167/iovs.12-11258.
- Vatnehol, S. A. S.; Hol, P. K.; Bjørnerud, A.; Amiry‐Moghaddam, M.; Haglerød, C.; Storås, T. H. Effect of Drinking Oxygenated Water Assessed by in Vivo MRI Relaxometry. Journal of Magnetic Resonance Imaging 2020, 52 (3), 720–728. https://doi.org/10.1002/jmri.27104.
- d’Othée, B. J.; Rachmuth, G.; Munasinghe, J.; Lang, E. V. The Effect of Hyperoxygenation on T1 Relaxation Time in Vitro1. Academic Radiology 2003, 10 (8), 854–860. https://doi.org/10.1016/s1076-6332(03)00004-7.
- Hausser, R.; Noack, F. Kernmagnetische Relaxation Und Korrelation Im System Wasser - Sauerstoff. Zeitschrift für Naturforschung A 1965, 20 (12), 1668–1675. https://doi.org/10.1515/zna-1965-1220.
- Kramer, H.; Corcos, A.; Hernando, D.; Berry, J.; Schiebler, M.; Reeder, S. Effekt von molekularem Sauerstoff auf Relaxationszeiten bei klinischen Feldstärken. Fortschr Röntgenstr 2013, 185 (S 01), s-0033-1346217. https://doi.org/10.1055/s-0033-1346217.
- Matsumoto, K.; Bernardo, M.; Subramanian, S.; Choyke, P.; Mitchell, J. B.; Krishna, M. C.; Lizak, M. J. MR Assessment of Changes of Tumor in Response to Hyperbaric Oxygen Treatment. Magnetic resonance in medicine 2006, 56 (2), 240–246. https://doi.org/10.1002/mrm.20961.
- Nestle, N.; Baumann, T.; Niessner, R. Oxygen Determination in Oxygen-Supersaturated Drinking Waters by NMR Relaxometry. Water Research 2003, 37 (14), 3361–3366. https://doi.org/10.1016/S0043-1354(03)00211-2.
- Pilkinton, D. T.; Hiraki, T.; Detre, J. A.; Greenberg, J. H.; Reddy, R. Absolute Cerebral Blood Flow Quantification with Pulsed Arterial Spin Labeling during Hyperoxia Corrected with the Simultaneous Measurement of the Longitudinal Relaxation Time of Arterial Blood. Magnetic Resonance in Medicine 2012, 67 (6), 1556–1565. https://doi.org/10.1002/mrm.23137.
- Vatnehol, S. A. S.; Hol, P. K.; Bjørnerud, A.; Amiry-Moghaddam, M.; Haglerød, C.; Storås, T. H. Determination of Oxygen R1 at 3 Tesla Using Samples with a Concentration Range of Dissolved Oxygen. Magnetic Resonance Materials in Physics, Biology and Medicine 2020, 33 (3), 447–453. https://doi.org/10.1007/s10334-019-00783-x.
- Zaharchuk, G.; Busse, R. F.; Rosenthal, G.; Manley, G. T.; Glenn, O. A.; Dillon, W. P. Noninvasive Oxygen Partial Pressure Measurement of Human Body Fluids In Vivo Using Magnetic Resonance Imaging. Academic Radiology 2006, 13 (8), 1016–1024. https://doi.org/10.1016/j.acra.2006.04.016.
- Zaharchuk, G.; Martin, A. J.; Rosenthal, G.; Manley, G. T.; Dillon, W. P. Measurement of Cerebrospinal Fluid Oxygen Partial Pressure in Humans Using MRI. Magnetic Resonance in Medicine 2005, 54 (1), 113–121. https://doi.org/10.1002/mrm.20546.
- Yang, D. M.; Arai, T. J.; Campbell, J. W.; Gerberich, J. L.; Zhou, H.; Mason, R. P. Oxygen‐sensitive MRI Assessment of Tumor Response to Hypoxic Gas Breathing Challenge. NMR in Biomedicine 2019, 32 (7), e4101. https://doi.org/10.1002/nbm.4101.
- Bluemke, E.; Stride, E.; Bulte, D. A General Model to Calculate the Spin-Lattice Relaxation Rate (R1) of Blood, Accounting for Haematocrit, Oxygen Saturation, Oxygen Partial Pressure, and Magnetic Field Strength under Hyperoxic Conditions. Journal of Magnetic Resonance Imaging 2021. https://doi.org/10.1002/jmri.27938.
- Bluemke, E.; Stride, E.; Bulte, D. A Simplified Empirical Model to Estimate Oxygen Relaxivity at Different Magnetic Fields. NMR in Biomedicine 2021. https://doi.org/10.1002/nbm.4625.
- Muir, E. R.; Cardenas, D. P.; Duong, T. Q. MRI of Brain Tissue Oxygen Tension under Hyperbaric Conditions. NeuroImage 2016, 133, 498–503. https://doi.org/10.1016/j.neuroimage.2016.03.040.
- Bhogal, A. A.; Siero, J. C.; Zwanenburg, J.; Luijten, P. R.; Philippens, M. E.; Hoogduin, H. Quantitative T1 Mapping under Precisely Controlled Graded Hyperoxia at 7T. J Cereb Blood Flow Metab 2017, 37 (4), 1461–1469. https://doi.org/10.1177/0271678X16656864.
- Kindvall, S. S. I.; Diaz, S.; Svensson, J.; Wollmer, P.; Olsson, L. E. The Change of Longitudinal Relaxation Rate in Oxygen Enhanced Pulmonary MRI Depends on Age and BMI but Not Diffusing Capacity of Carbon Monoxide in Healthy Never-Smokers. PLoS One 2017, 12 (5), e0177670. https://doi.org/10.1371/journal.pone.0177670.
- Kindvall, S. Pulmonary Imaging with Quantification of T1-Relaxation and Oxygen Enhanced MRI, Lund University: Faculty of Medicine, 2018.
Figures
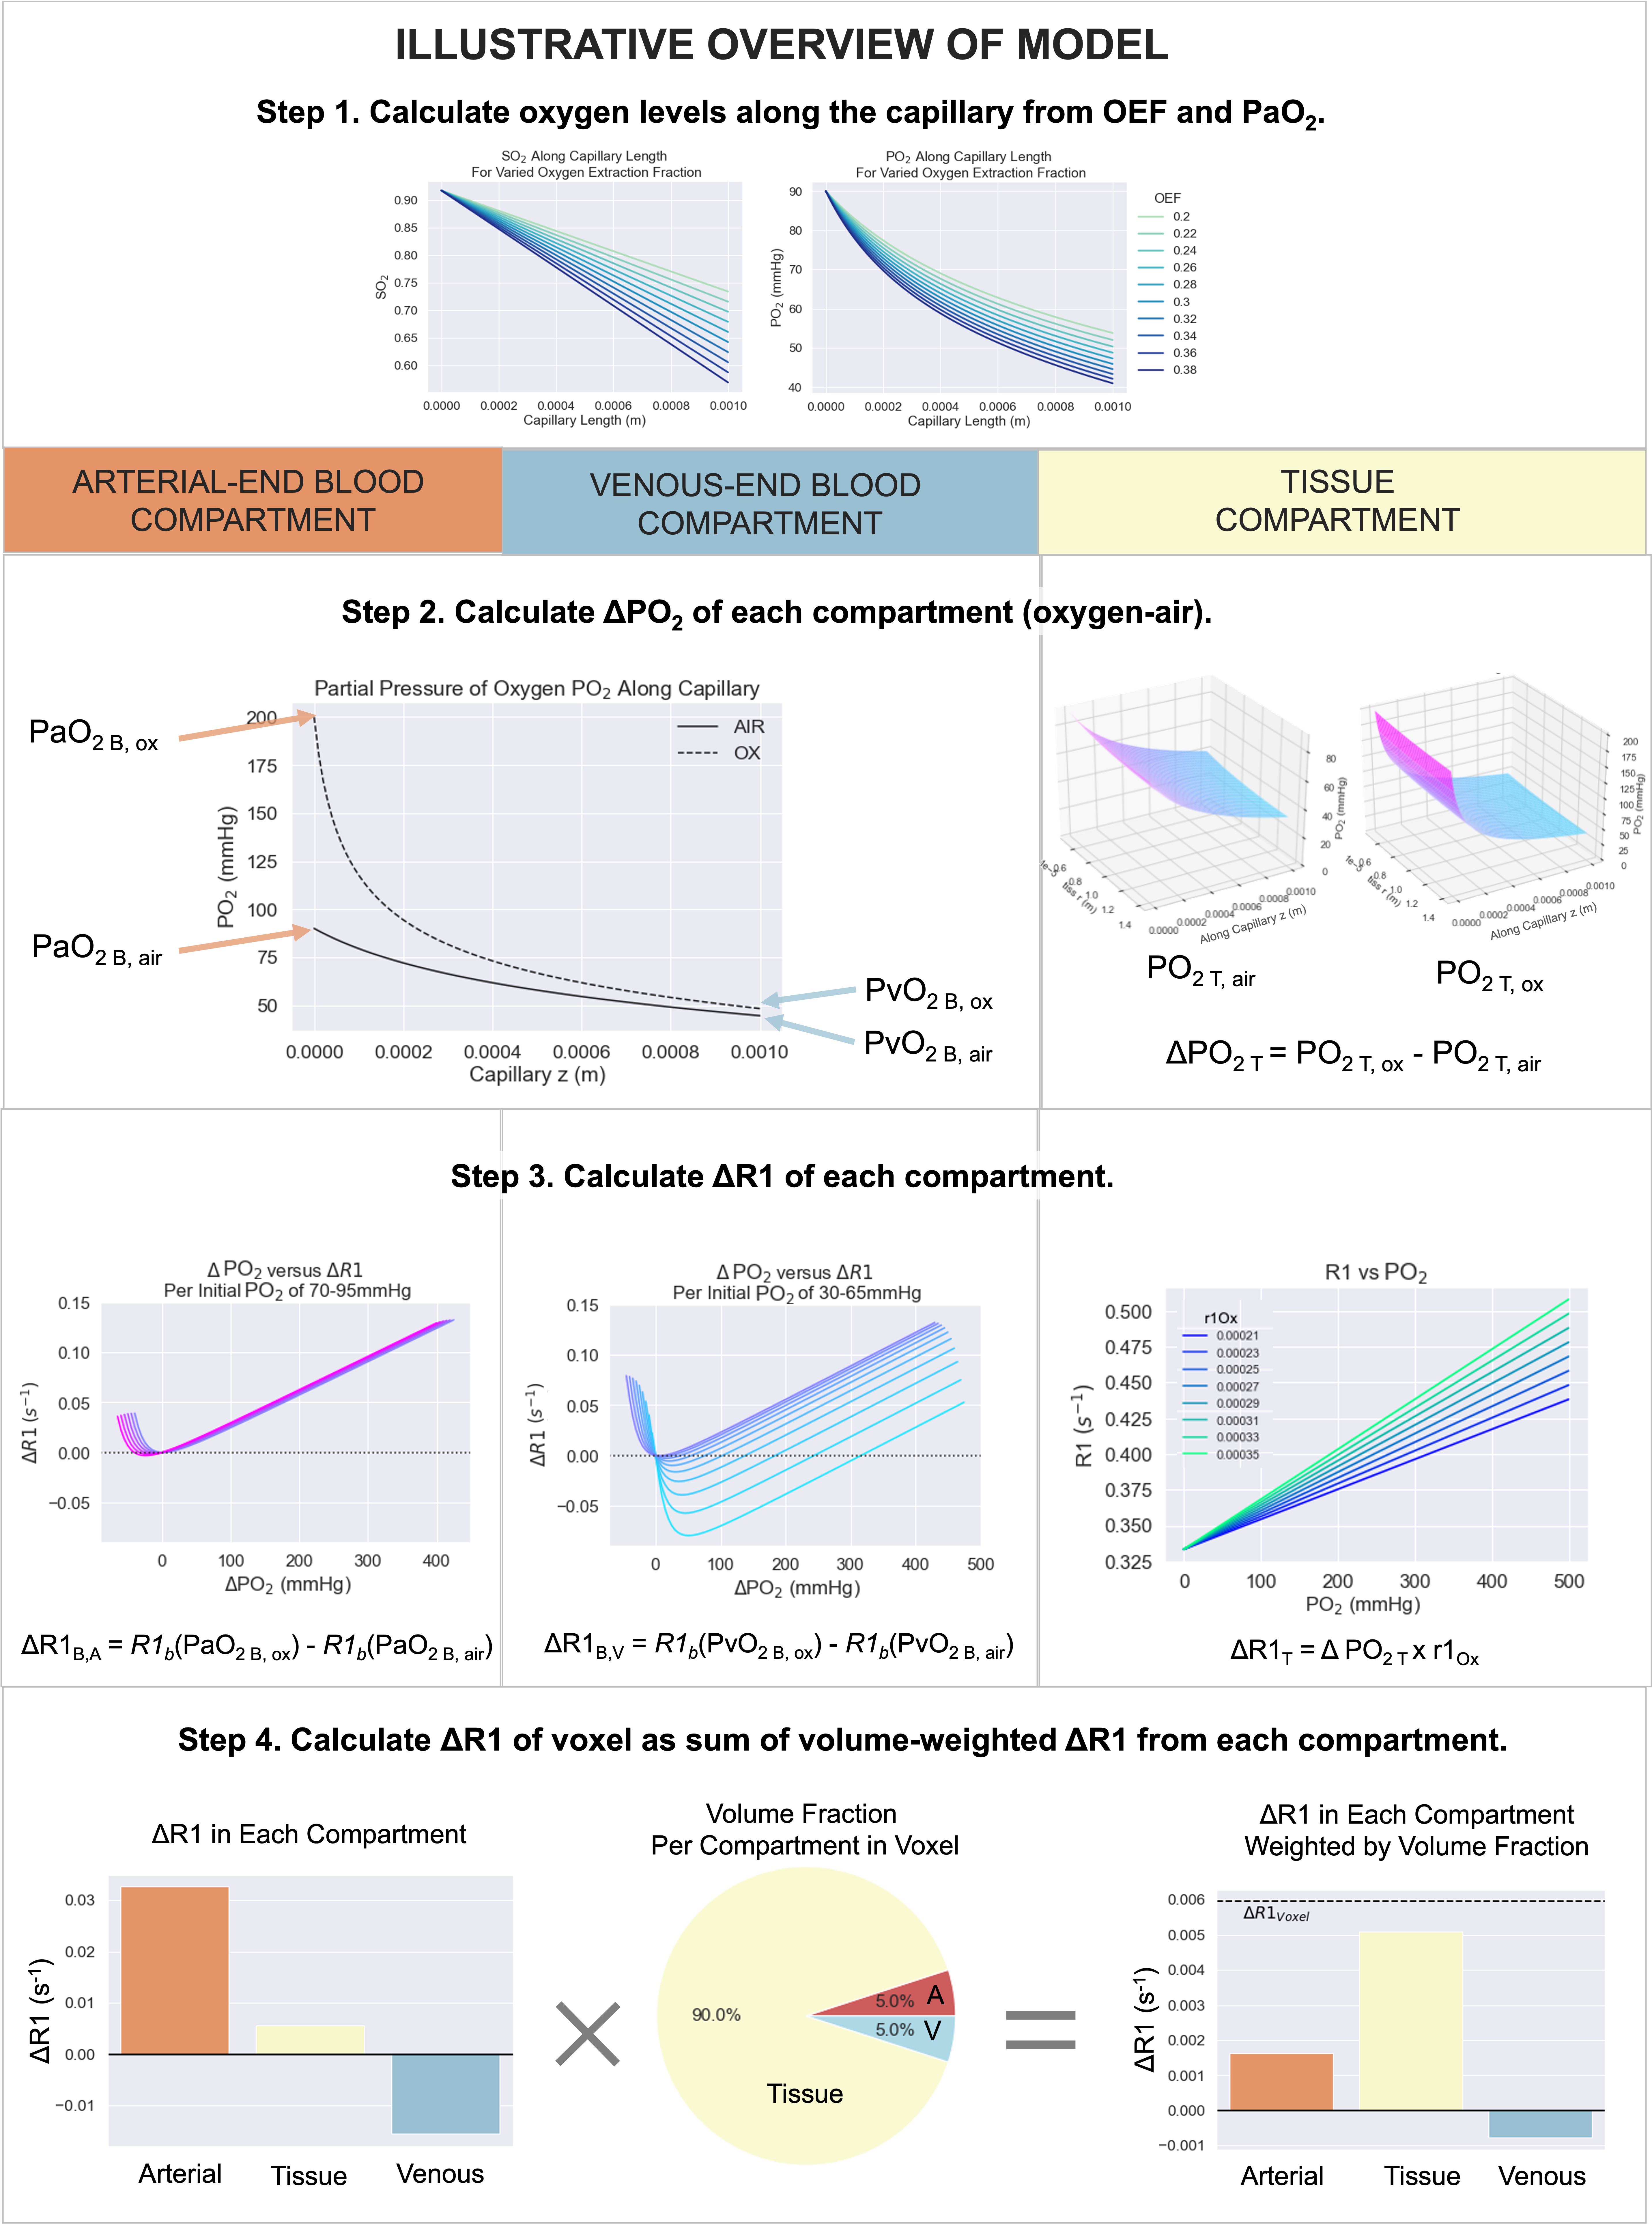
Figure 1: An illustrative overview of the 3-compartment model, which can be separated conceptually into 4 steps as shown. The inputs and outputs of the functions used in each step are shown in Figure 2.

Figure 2: The inputs and outputs of each resulting function used in this model.
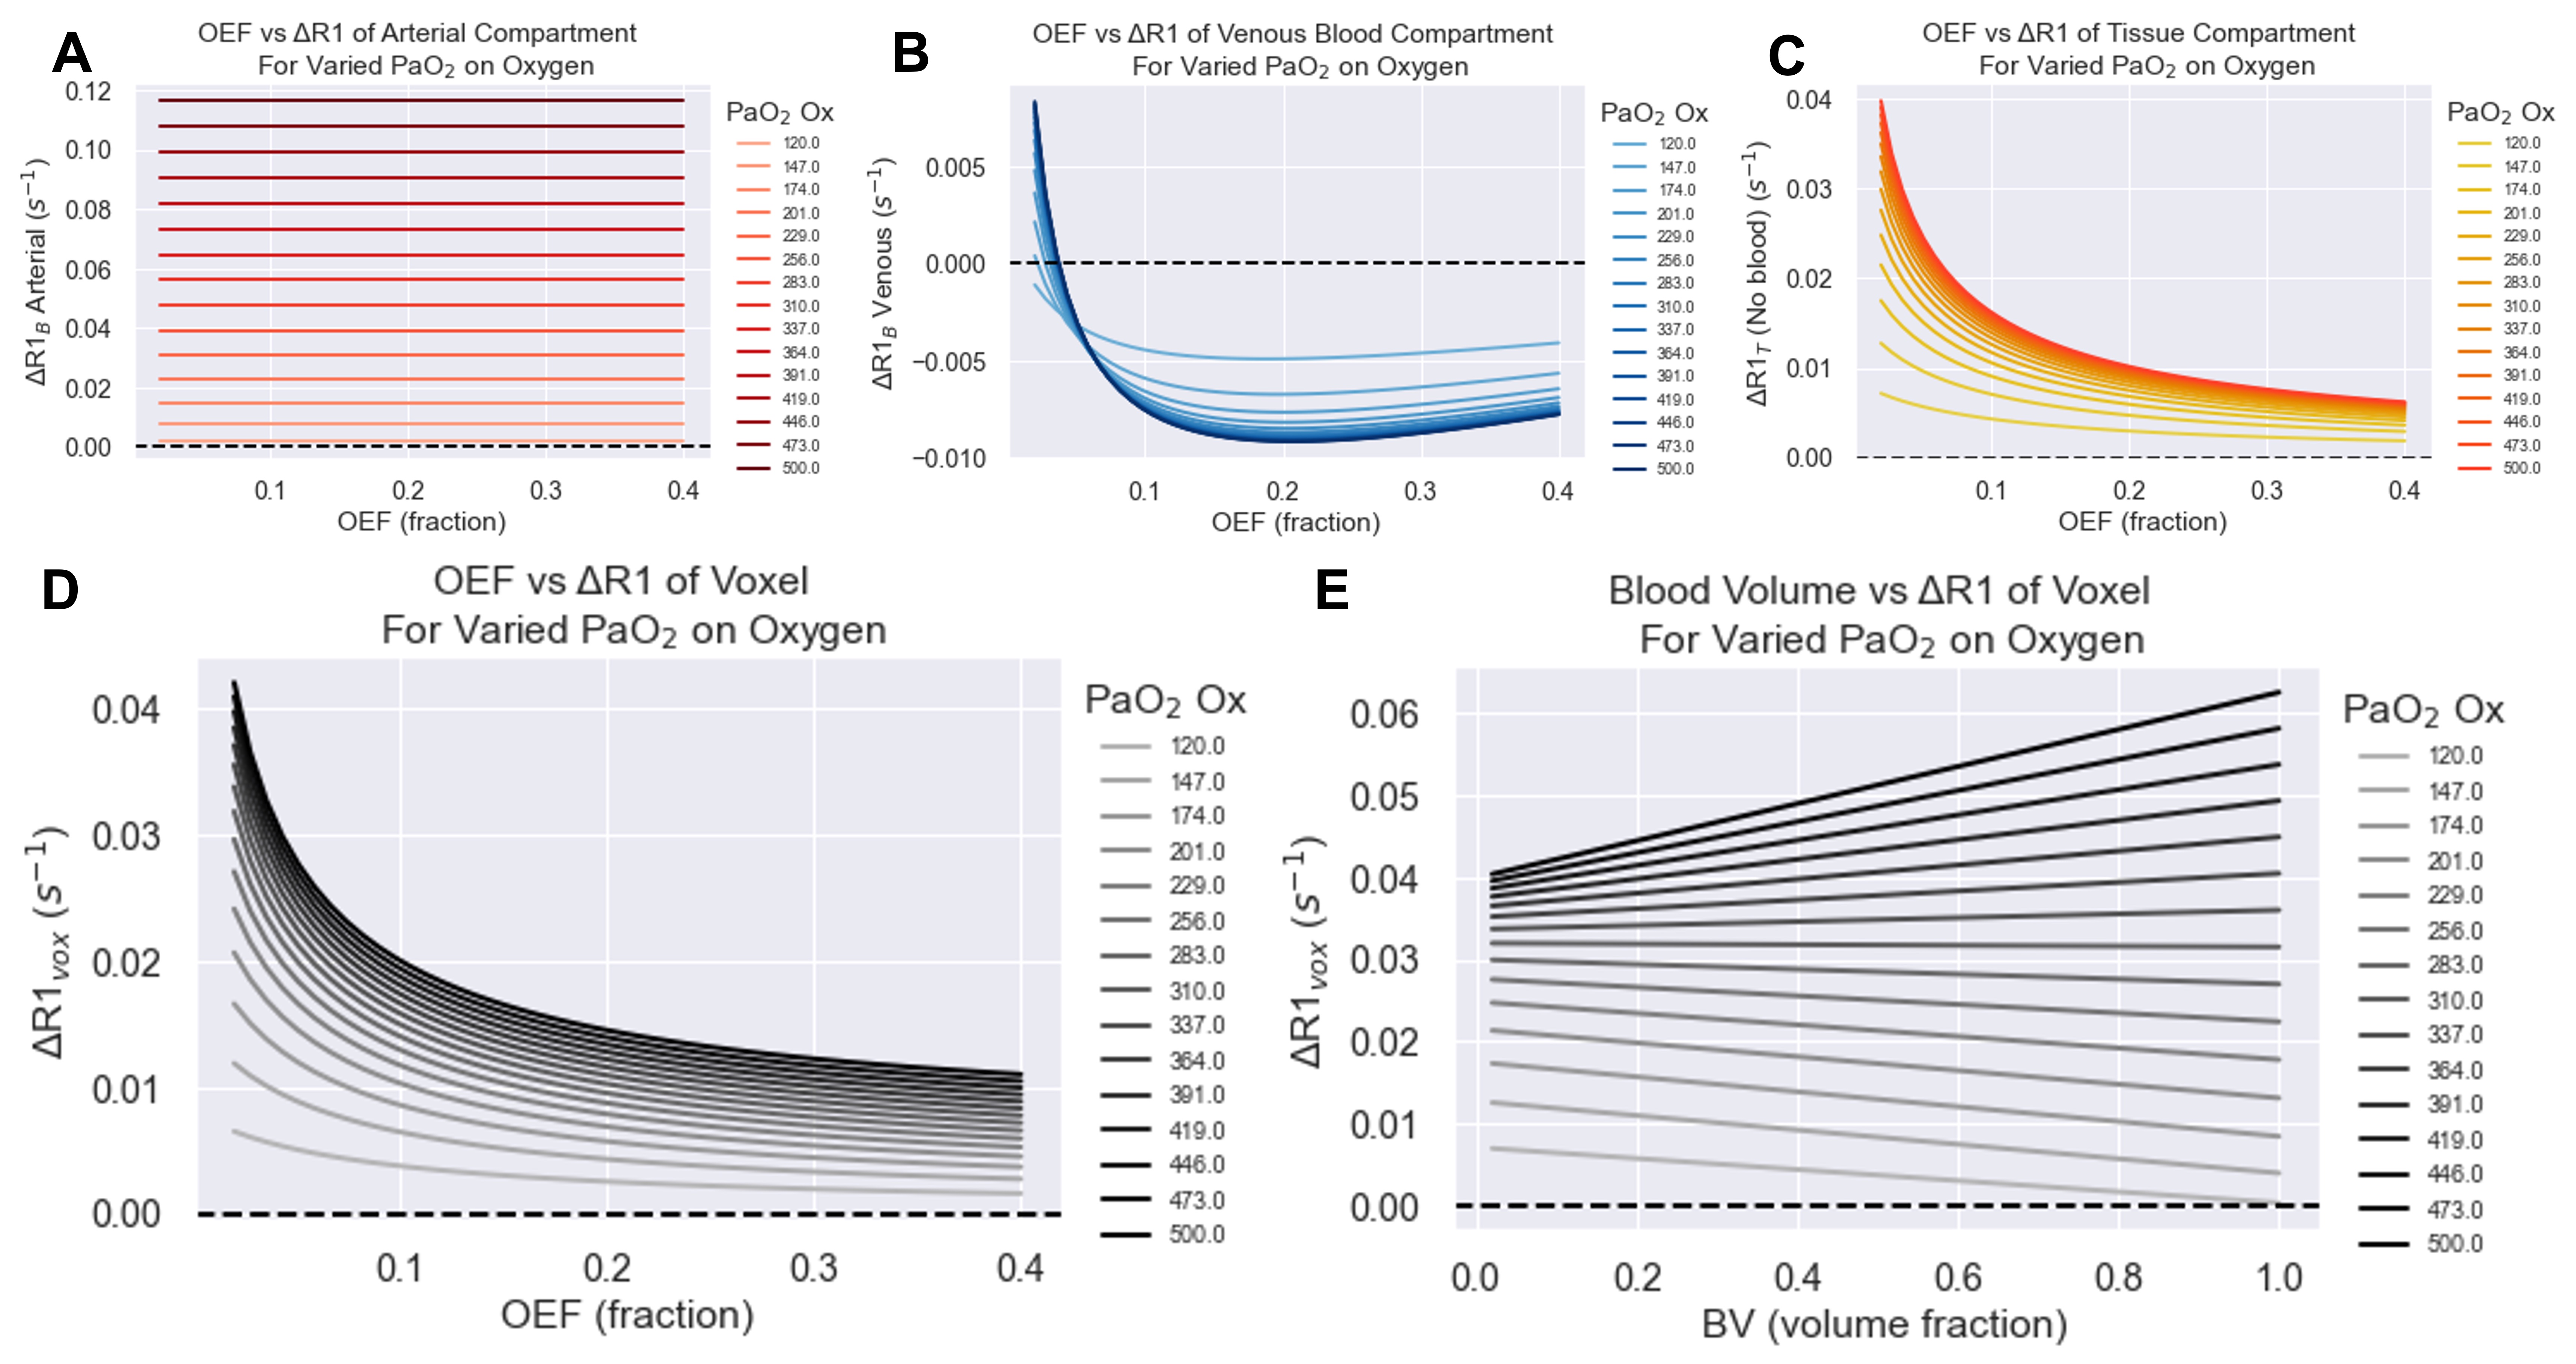
Figure 3. The effect of OEF on the ΔR1 of the (A) arterial blood, (B) venous blood, and (C) tissue compartments individually, and (D) total voxel ΔR1 for varied PaO2 changes induced from increased oxygen breathing, with blood volume set to 10%. The corresponding effect of varying blood volume with a set OEF (OEF=0.2) is shown in (E).
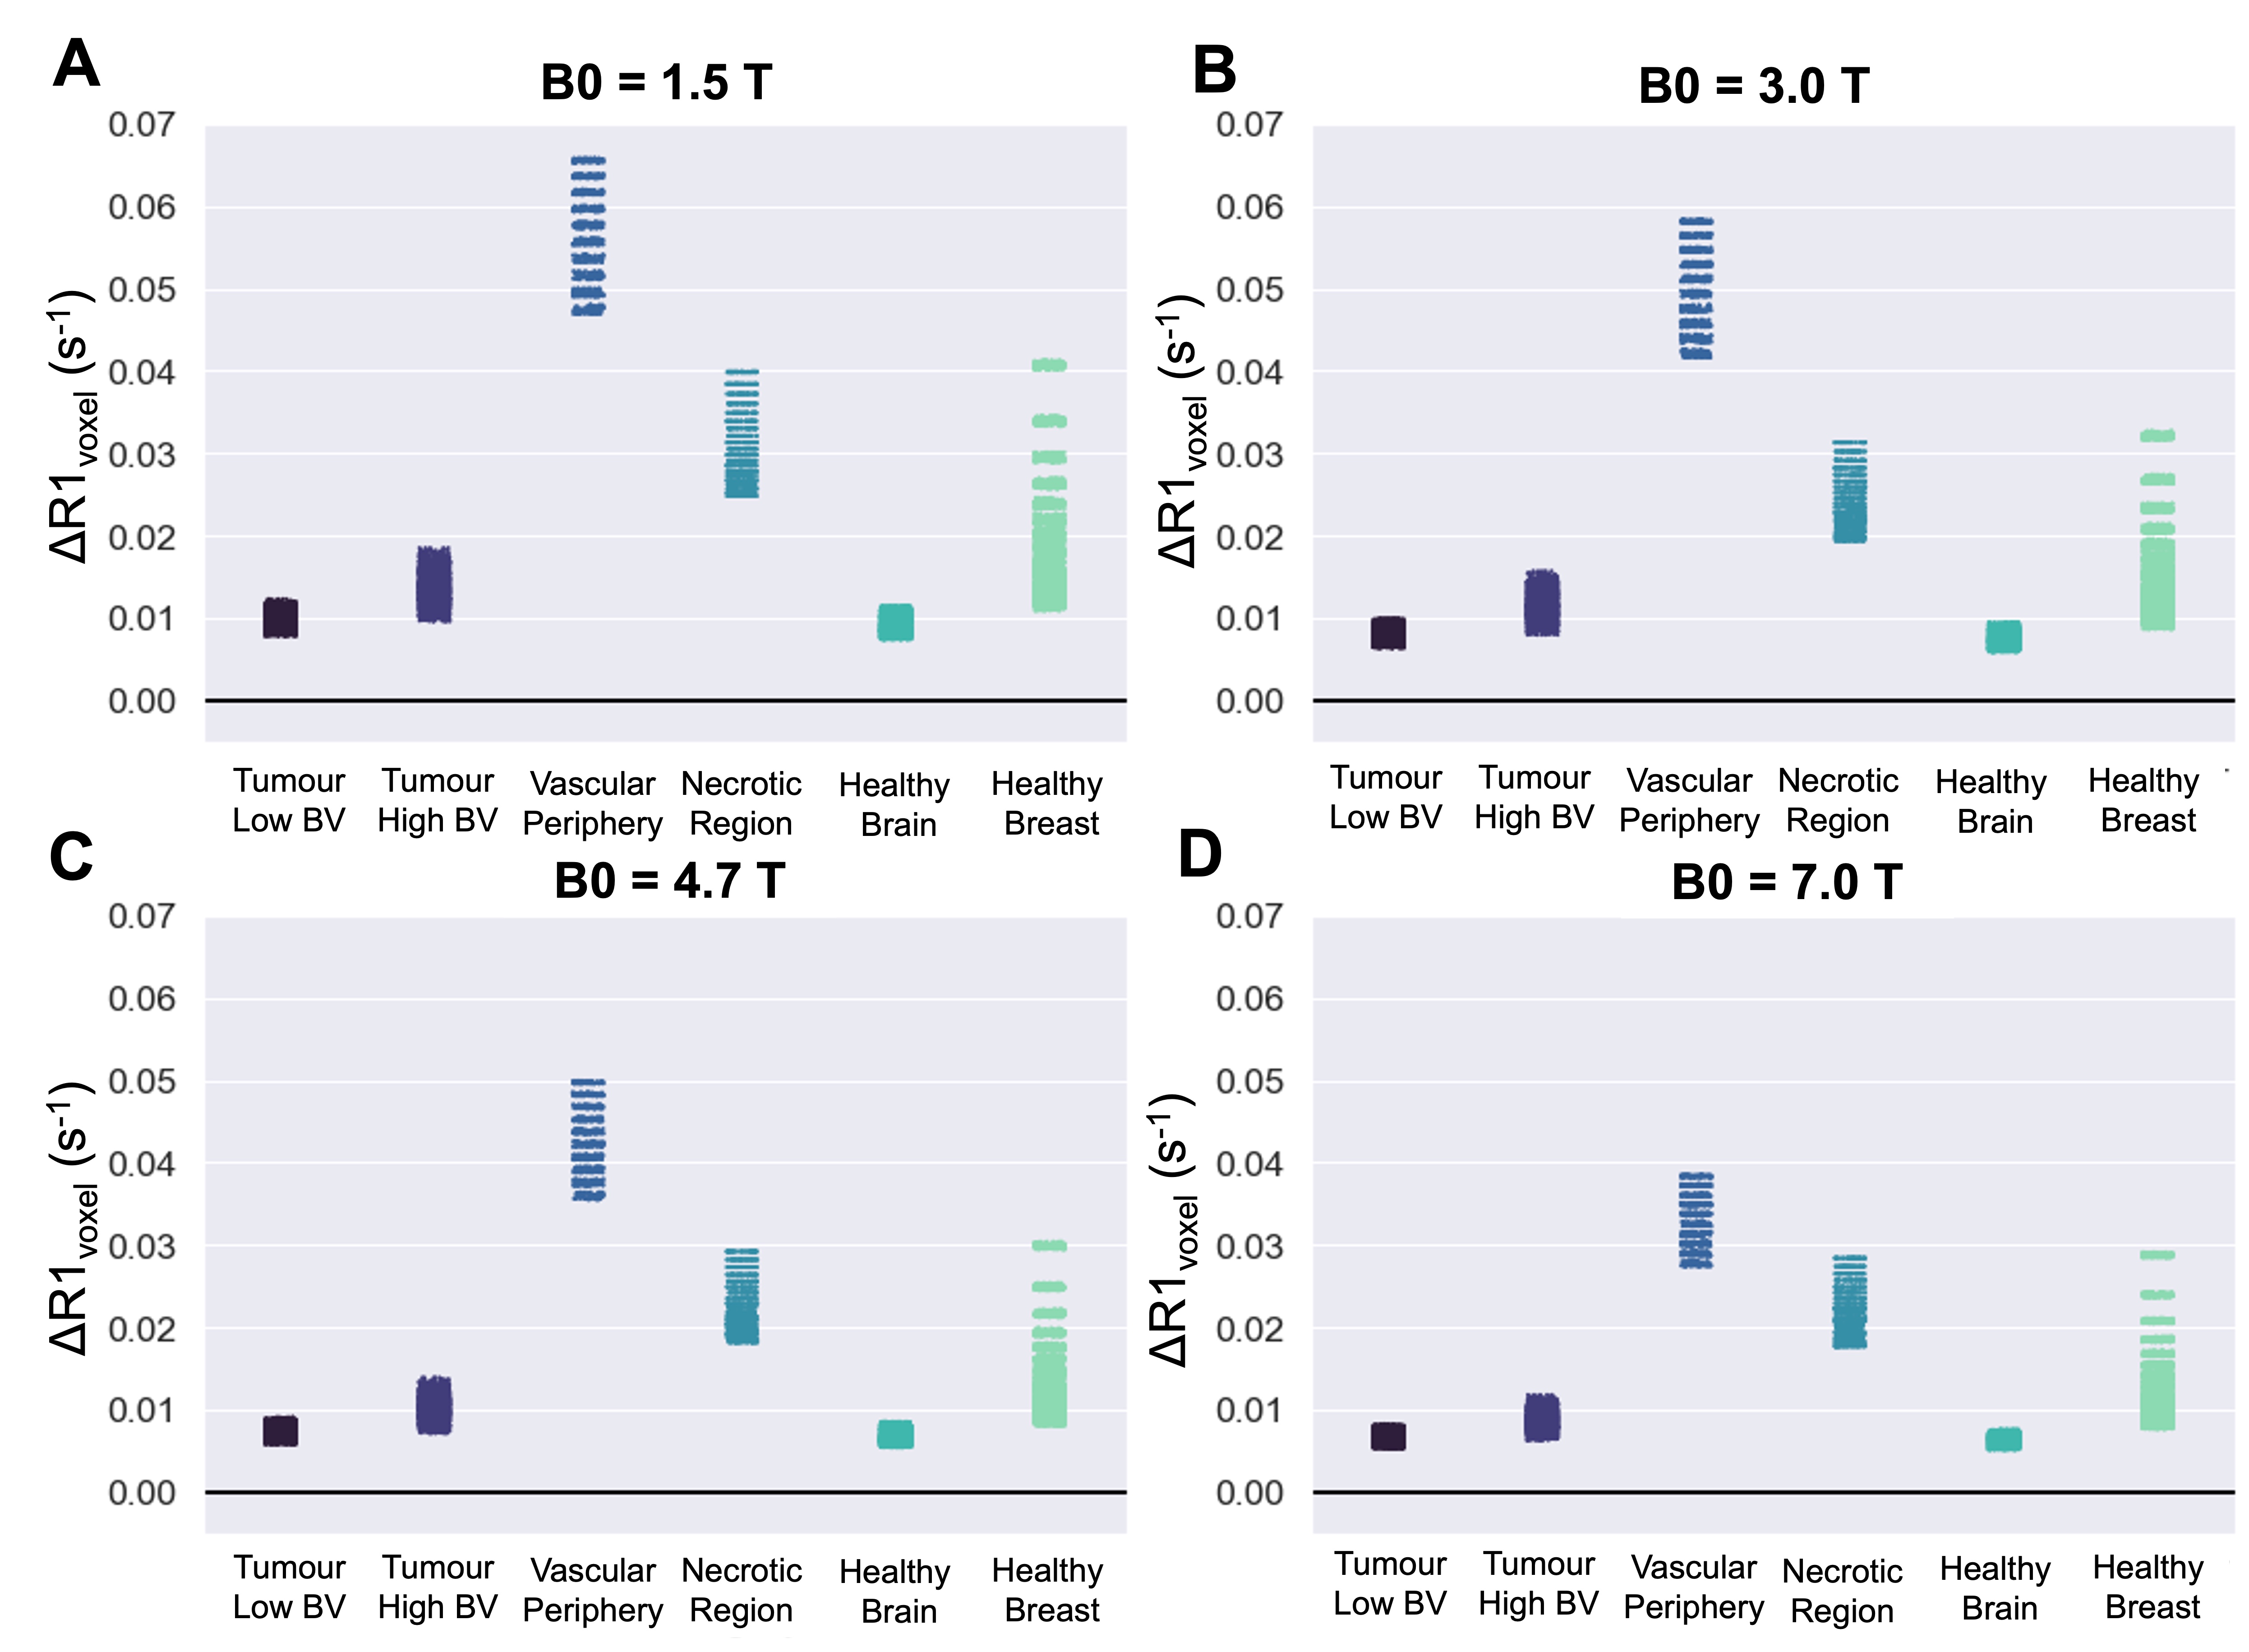
Figure 4. The resulting ΔR1 from a hyperoxic gas challenge calculated from this model, calculated using all combinations of the chosen range of Hct, OEF, BV, Pcrit for each respective tumour tissue type, with B0 set to (A) 1.5T, (B) 3T, (C) 4.7T, (D) 7T.
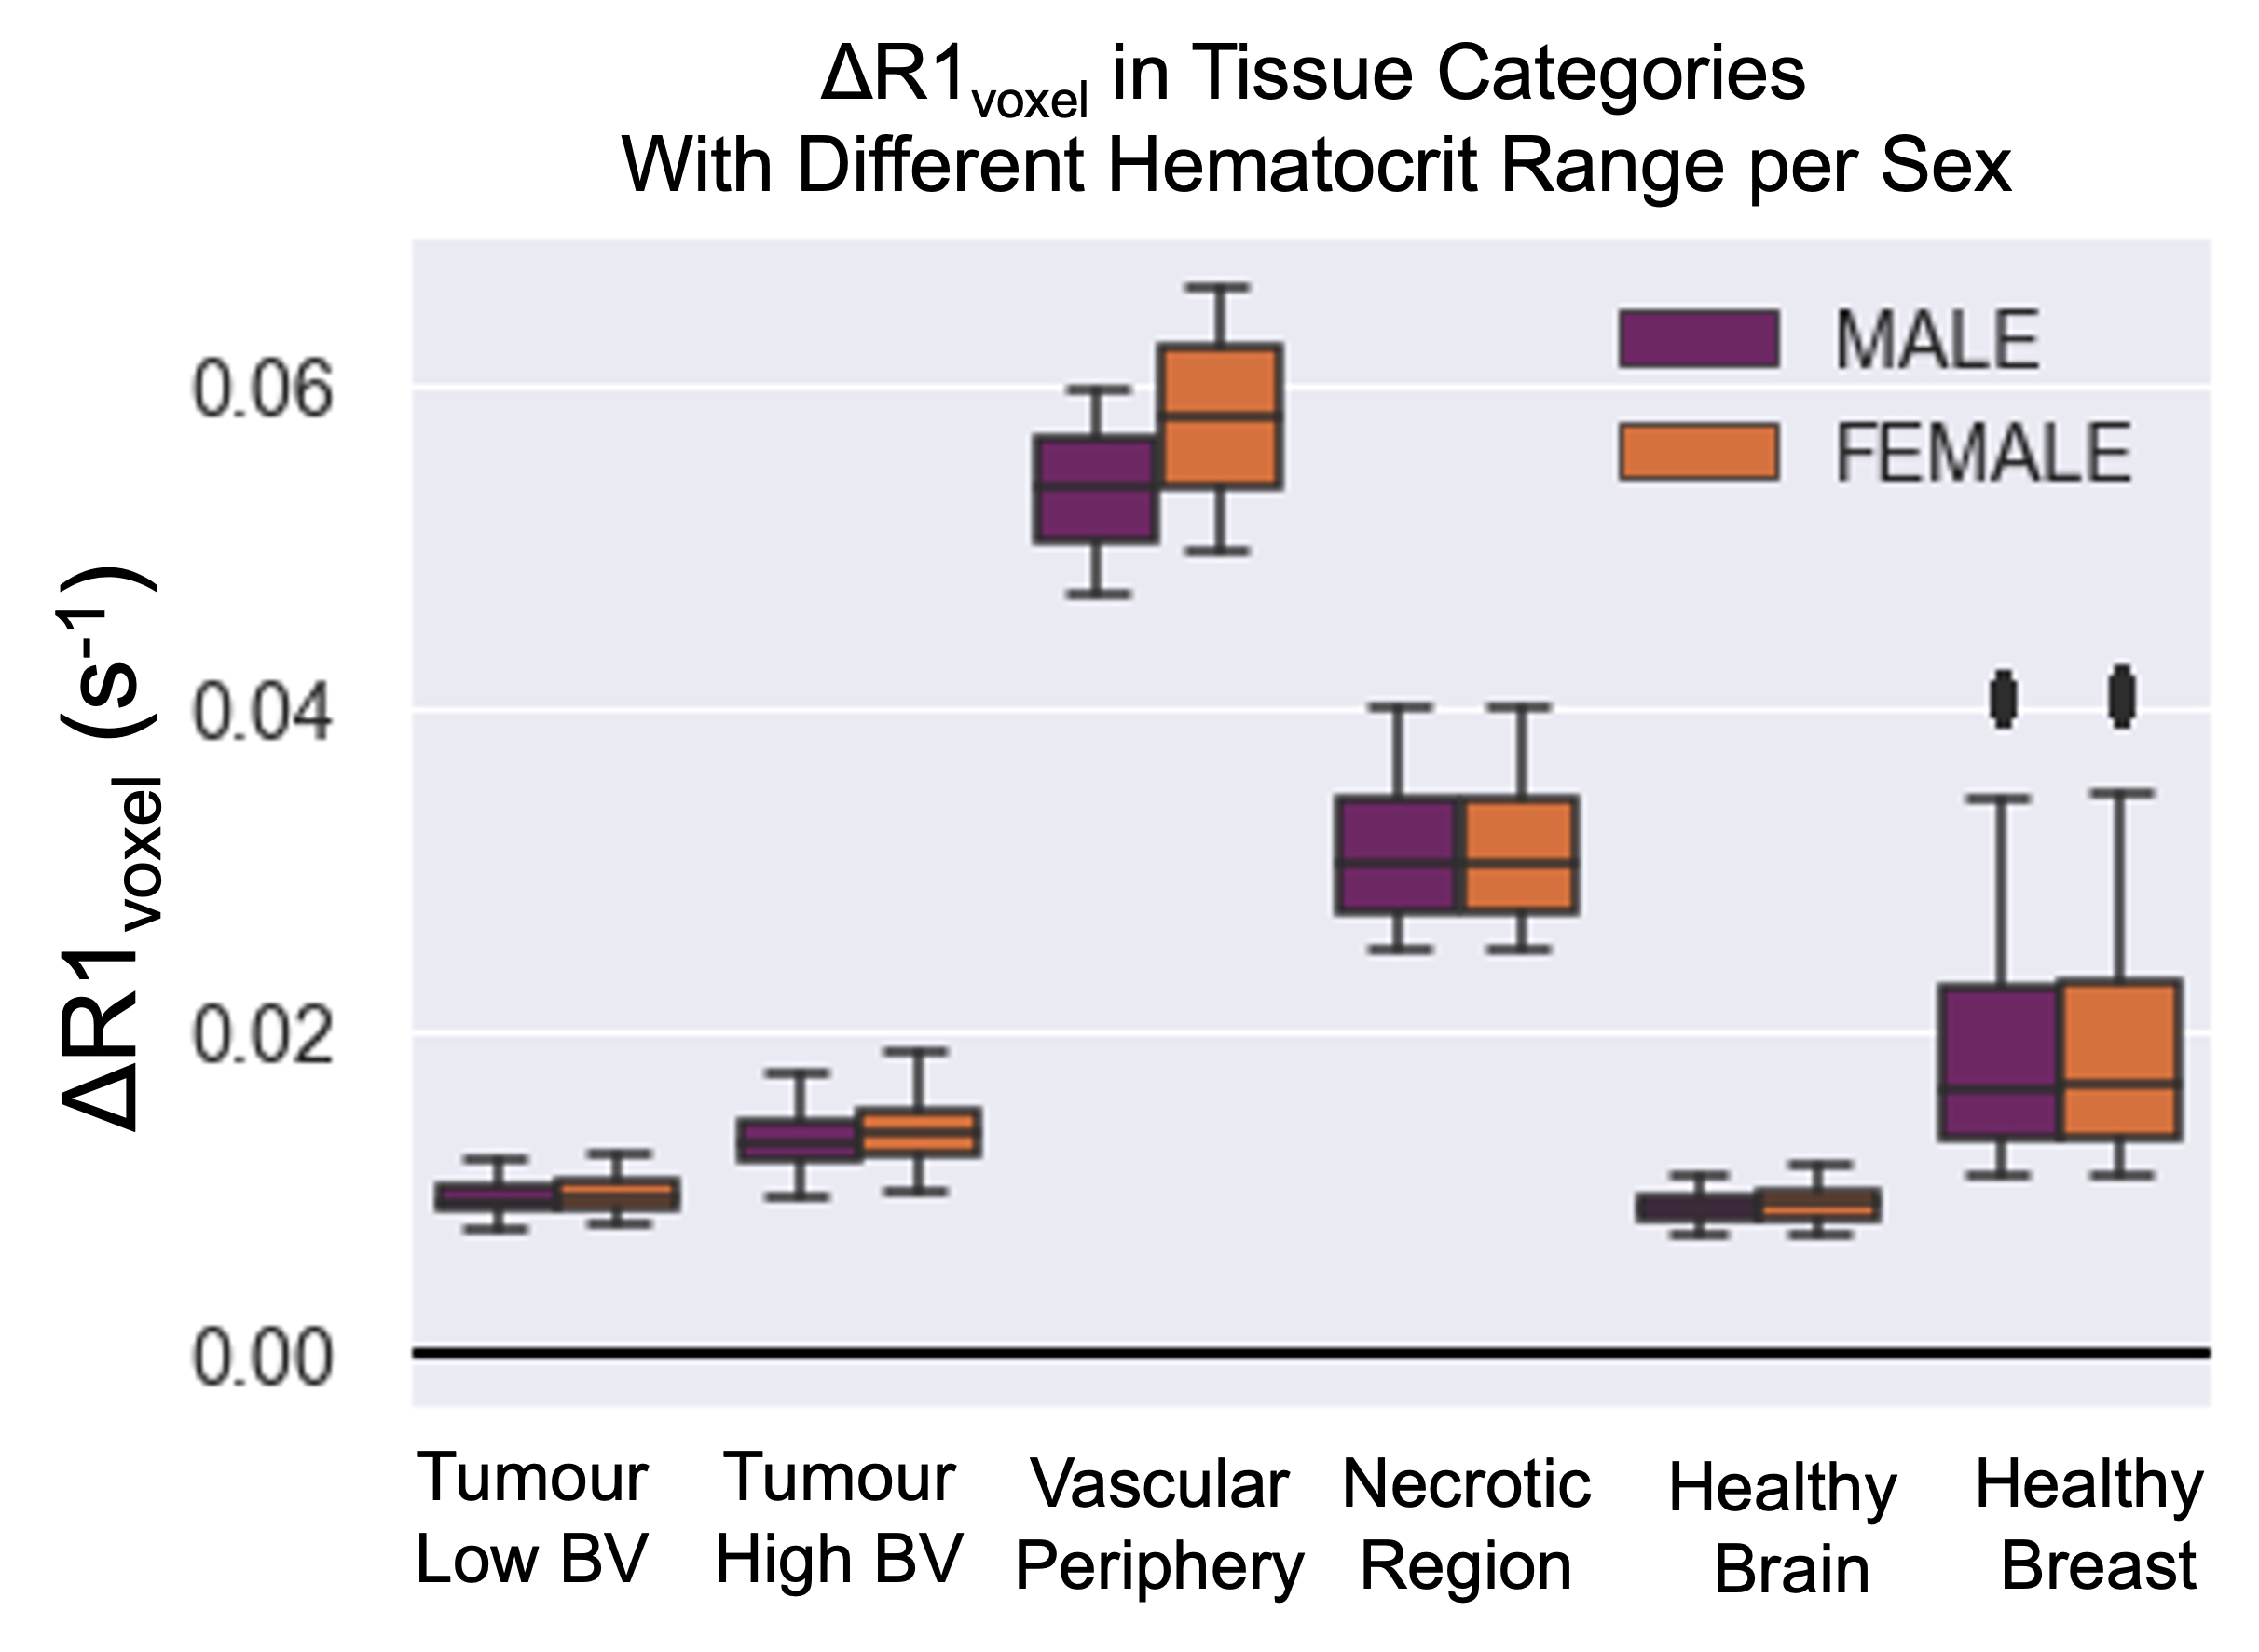
Figure 5. The resulting ΔR1 calculated from this model using the hematocrit ranges for female (0.36-0.48) and male (0.41-0.50) groups separately, and using all combinations of the chosen range of OEF, BV, Pcrit for each respective tumour tissue type, with B0 set to 1.5T.
DOI: https://doi.org/10.58530/2022/0449