0448
Low-Dose Ferumoxytol Infusion Provides Effective Vascular Suppression for Magnetic Resonance Neurography1Hospital for Special Surgery, New York, NY, United States
Synopsis
This study investigated the effectiveness of a low-dose (25% of a single treatment dose for anemia) ferumoxytol-infusion for vascular suppression in T2-weighted MR neurography of the brachial plexus. 3D STIR-FSE and 2D Dixon-FSE sequences of the brachial plexus were acquired in 12 healthy volunteers pre- and post-ferumoxytol. Quantitative and subjective assessments by two readers demonstrated superior vascular suppression and nerve visualization post-ferumoxytol without negatively affecting soft tissue contrast or fat suppression.
Introduction
Magnetic resonance neurography (MRN) relies heavily on fat-suppressed, T2-weighted sequences for peripheral nerve identification (1). A significant challenge of MRN is distinguishing nerves from adjacent vessels that have similar morphology and signal intensity (2). While gadolinium-based contrast agents provide more effective vascular suppression than non-contrast techniques (3-5), concerns remain over the potential for brain deposition from repeated use (6). Ferumoxytol is an ultrasmall superparamagnetic iron oxide (USPIO) agent used to treat iron deficiency anemia (IDA), but has previously shown to provide robust vascular suppression for 3D MRN in patients with IDA at full therapeutic dose. Simulations, however, suggest that a much lower dose of ferumoxytol may achieve similarly effective vascular suppression (7), which can reduce infusion times, cost, and potentially improve the drug’s safety profile. This study aimed to evaluate the effects of low-dose ferumoxytol in vascular suppression and nerve conspicuity in both 3D and 2D MRN. We hypothesized that a 25% relative (to therapeutic) dose of ferumoxytol would provide effective vascular suppression.Methods
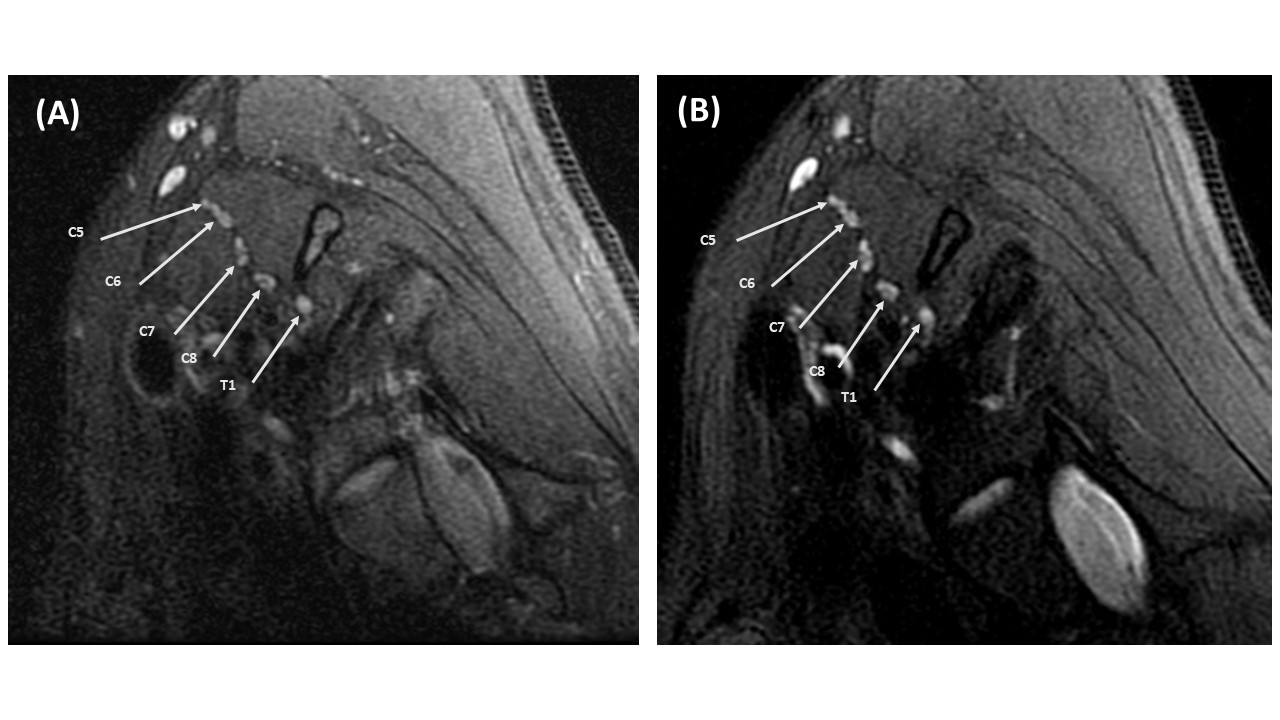
Following IRB-approval and written informed consent,12 healthy volunteers (6 M/6F; mean age 25, range 22-28 years) were enrolled in July 2021. Exclusion criteria were: intravenous (IV) iron in the past 3 months, familial or personal history of iron-overload disorder, and chronic kidney or liver disease. Each patient was imaged before and immediately following a 25% dose ferumoxytol infusion (127.5mg iron in 50mL 0.9% sodium chloride IV bag), for a total of 12 left and 12 right unilateral brachial plexus exams. 3D STIR-T2w-FSE sequences (with additional crusher gradients ‘off’/‘on’ for non-contrast vascular suppression) and 2D T2w Dixon FSE sequences were obtained at 3T (Premier, GE Healthcare) using two 16-channel coils positioned over the lower neck and chest wall regions. 3D imaging parameters were: FOV=256 mm, matrix (frequency x phase x slice)=256x256x96, slice thickness=1mm, TR/TE/TI=3302/60/250ms, bandwidth/pixel= 195.3Hz, ETL=130, scan time=6:47min. Crusher gradients were applied in the frequency and slice directions using vendor default parameters (‘off’: 1/0 cycles/cm, ‘on’: 1.5/1 cycles per cm). 2D imaging parameters were: FOV=160mm, matrix=320x224, slice thickness=3mm, # slices =30, TR/TE= 4230/85ms, bandwidth/pixel =244.1Hz, NEX=2, ETL=14, scan time=3:14 min.Two musculoskeletal radiologists, blinded to technique, qualitatively evaluated sequences on a PACS workstation (Sectra IDS7) for 1) degree of vascular signal suppression, 2) visualization of the proximal and distal segments of the suprascapular and axillary nerves, and the axillary nerve anterior division, and 3) degree of motion artifact. For quantitative evaluation, nerve-to-fat/muscle/vessel contrast ratios (CR) were calculated for both sequences using manually drawn regions of interests (ROIs). For the 3D sequence, rater 1 drew all ROIs, while rater 2 drew ROIs for 7 subjects to assess inter-rater reliability. Raters 1 and 2 drew all ROIs for the 2D sequence. Four subjects (2M/2F) were each imaged at later time interval (either 10, 18, 24 or 36 hours post-ferumoxytol infusion) to determine a washout period.
Inter-rater agreement for vascular suppression was measured by weighted kappa. Pre- and post-infusion scores and contrast ratios were compared using a paired Wilcoxon signed-rank test.
Results
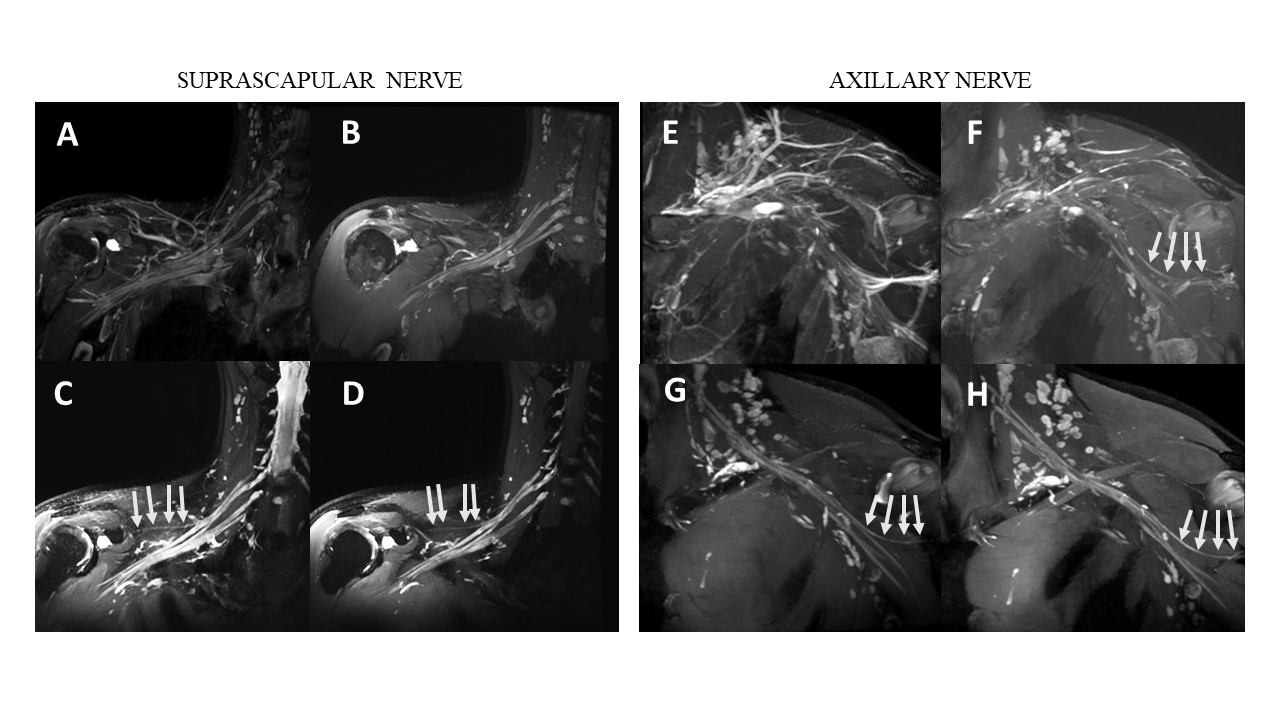
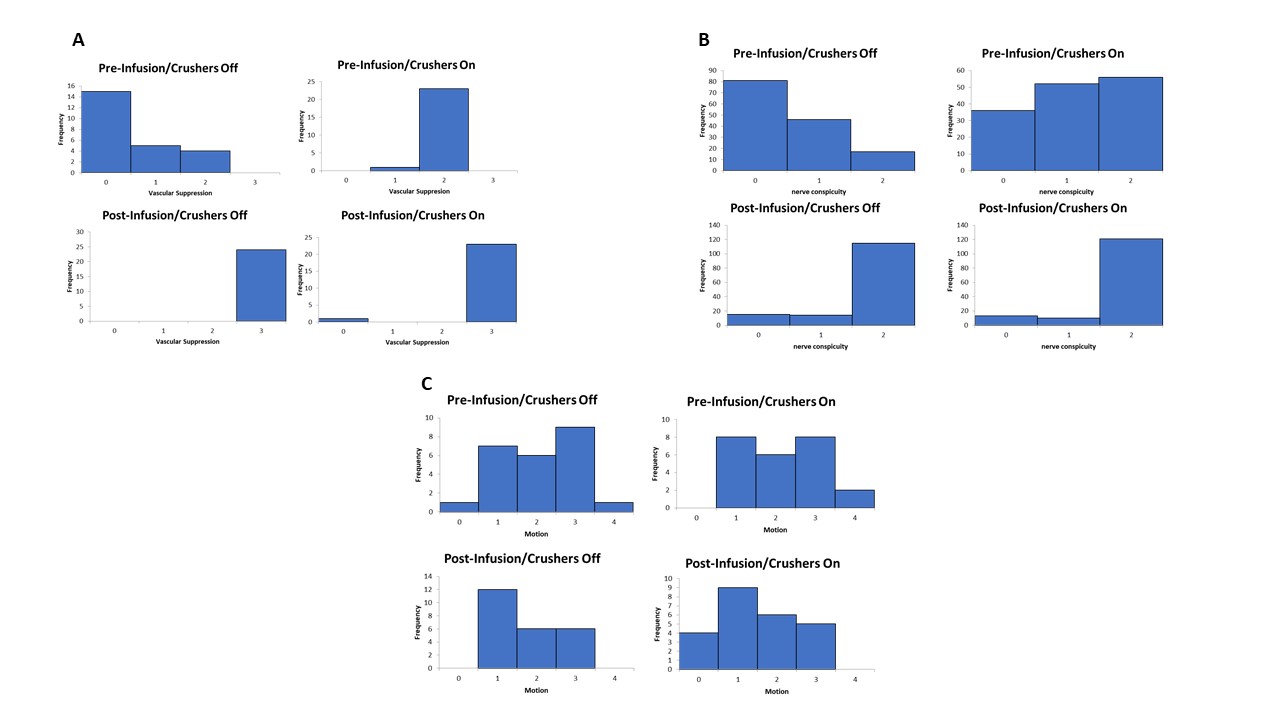
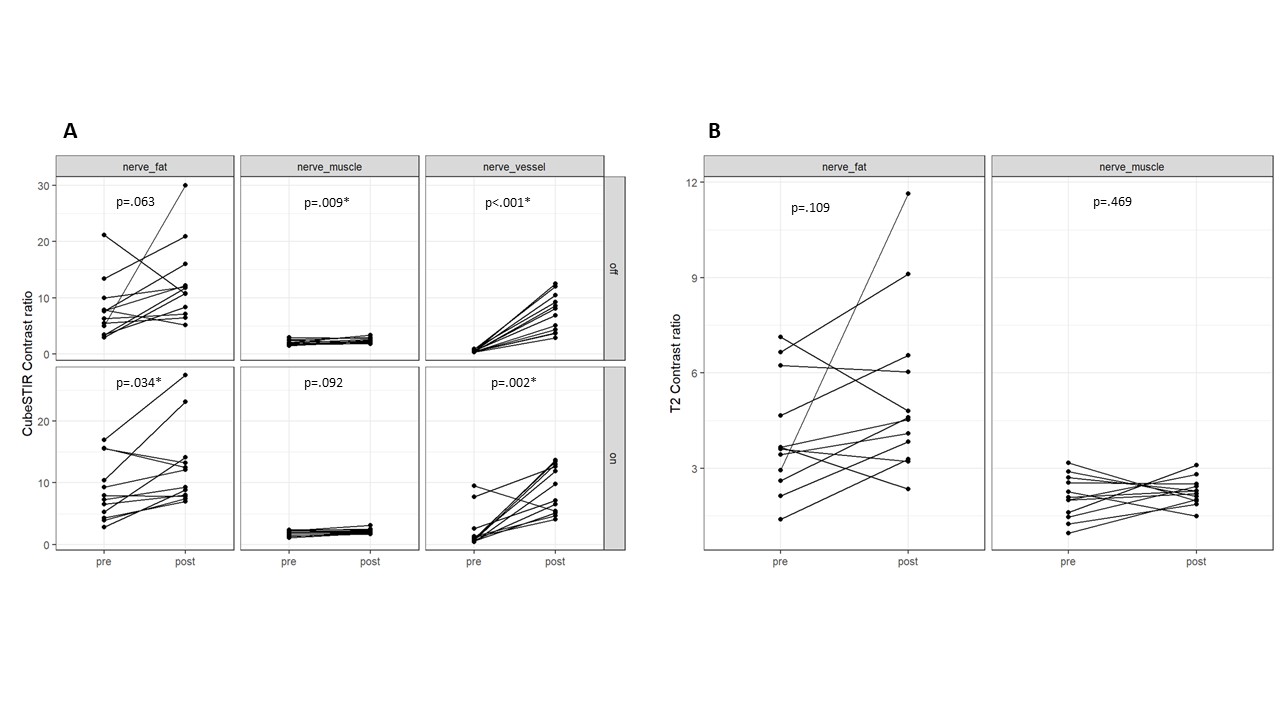
Qualitative vascular suppression significantly improved following ferumoxytol administration for both raters with added crushers ‘on’ (p=.023) and ‘off’ (p=.001), with almost perfect inter-rater agreement (kappa=.87) (Fig. 3). Visualization of the suprascapular and distal segments of the axillary nerve also improved following ferumoxytol administration for both raters (p=.001-.047). Inter-rater agreement for nerve visualization was almost perfect for the suprascapular nerve proximal segment and for the axillary nerve anterior division (kappa=.81-.88), substantial for the distal suprascapular nerve segment and axillary nerve proximal and distal segments (kappa=.68-.79), and fair for the axillary nerve anterior division (kappa=.21). There was no significant difference in motion artifact between pre- and post-ferumoxytol images, and moderate inter-rater agreement for motion scores (kappa=.44).Quantitatively, ferumoxytol infusion increased the 3D nerve-to-vessel CR by 5.37 (p=.002, crushers ‘on’) and by 6.98 (p<.001, crushers ‘off’) (Fig.4). Ferumoxytol also slightly improved nerve-to-fat CR by 2.75 (p=0.034) for ‘on’, and nerve-to-muscle CR by 0.44 (p=0.009) for ‘off’. In other 3D and in all 2D comparisons, no significant differences were observed.
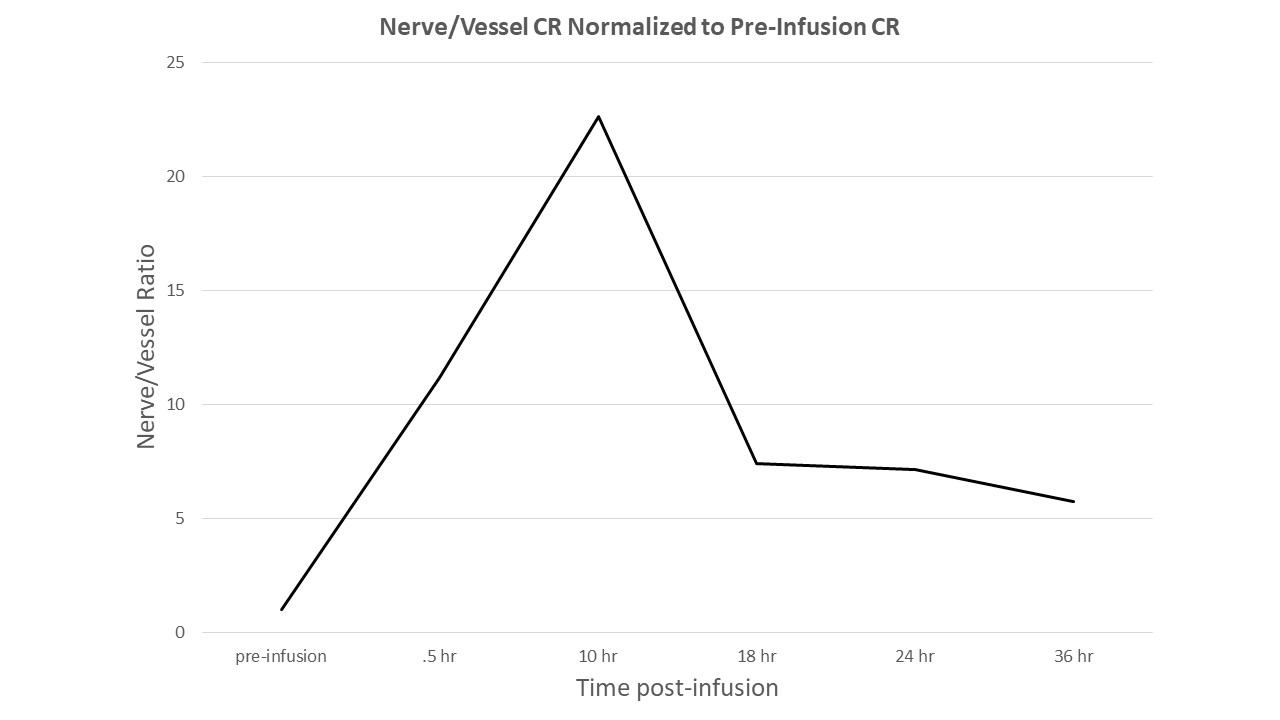
Anecdotally, high nerve-to-vessel CR (>5) was observed to persist until 36 hours, but diminished from 18 hours following ferumoxytol-infusion (Fig.5).
Discussion and Conclusions
For 3D STIR-T2w-FSE sequences, low-dose (25%) ferumoxytol provided significant vascular suppression, as evidenced by the increased nerve-to-vessel CR for post-infusion compared to pre-infusion imaging. For 3D and 2D T2w-FSE, ferumoxytol either improved or did not adversely affect soft tissue contrast or fat suppression. Post-infusion 3D STIR sequences also revealed improved visualization for the suprascapular and axillary nerves, with and without the use of additional crusher gradients, demonstrating that low-dose ferumoxytol provides superior vascular suppression when compared to non-contrast techniques. The effects of ferumoxytol were shown anecdotally to persist for up to 24 hours following infusion. No adverse subject events were reported.We plan to further evaluate effects of vascular suppression in 2D T2w-FSE for the brachial plexus, as well as in the arms and legs. This study did not evaluate patients with peripheral neuropathy, other baseline dose levels, and did not control for dose based on subject weight. Further studies are needed to determine optimum dose levels, and the impact of Ferumoxytol infusion on evaluation of peripheral neuropathy in patients.
Acknowledgements
This study was funded by a Seed Grant from the International Skeletal Society (ISS). Hospital for Special Surgery also has an institutional research agreement with General Electric Healthcare.
References
1. Filler A. MR Neurography and Diffusion Tensor Imaging: Origins, History & Clinical Impact of the first 50,000 cases with an Assessment of Efficacy and Utility in a Prospective 5,000 Patient Study Group. Neurosurgery. 2009;65(SUPPLEMENT):A29. doi: 10.1227/01.neu.0000351279.78110.00.
2. Does MD, Snyder RE. T2 Relaxation of peripheral nerve measured in vivo. Magn Reson Imaging. 2004;13(4):575–580. doi: 10.1016/0730-725x(94)00138-s.
3. Xu X, Geng H, Zhang Q, et al. Investigation of 3D reduced field of view carotid atherosclerotic plaque imaging. Magn Reson Imaging. 2018;49:10–15. doi: 10.1016/j.mri.2017.09.009.
4. Aime S, Caravan P. Biodistribution of gadolinium‐based contrast agents, including gadolinium deposition. J Magn Reson Imaging. 2009;30(6):1259–1267. doi: 10.1002/jmri.21969.
5. Sneag DB, Daniels SP, Geannette C, et al. Post-Contrast 3D Inversion Recovery Magnetic Resonance Neurography for Evaluation of Branch Nerves of the Brachial Plexus. Eur J Radiol. 2020;132:109304. doi: 10.1016/j.ejrad.2020.109304.
6. McDonald RJ, McDonald JS, Kallmes DF, et al. Gadolinium Deposition in Human Brain Tissues after Contrast-enhanced MR Imaging in Adult Patients without Intracranial Abnormalities. Radiology. 2017; doi: 10.1148/radiol.2017161595.
7. Queler SC, Tan ET, Geannette C, Prince M, Sneag DB. Ferumoxytol-enhanced vascular suppression in magnetic resonance neurography. Skeletal Radiol. 2021;1–12. doi: 10.1007/s00256-021-03804-w.
Figures