0447
Time-lapse MRI: in vivo single-cell tracking of patrolling immune cells
Enrica Wilken1, Ina Fredrich1, Asli Havlas1, Felix Freppon1, Max Masthoff1, and Cornelius Faber1
1TRIC, Clinic of Radiology, University Hospital Muenster, Muenster, Germany
1TRIC, Clinic of Radiology, University Hospital Muenster, Muenster, Germany
Synopsis
We validate that time-lapse MRI is able to resolve and follow single immune cells patrolling the brain vasculature. For that reason, we simulate motion-dependent contrast based on artificial k-space, imitate migrating cells with a rotating phantom system, and track iron-labeled monocytes in vivo with repeated T2* weighted imaging. Furthermore, we show that time-lapse MRI allows to differentiate between different motion patterns non-invasively and with whole-brain coverage, and to study altered motion behavior upon inflammatory stimulus and the onset of immune responses distant from the site of inflammation.
Introduction
Upon an inflammatory stimulus intravascular immune cells change their motion behavior from patrolling the endothelium to faster rolling with the aim to leave vasculature via the leucocyte adhesion cascade1. However, current imaging methods to study these alterations, like intravital microscopy, are invasive and suffer a limited field of view1. Contrarily, by repeated T2* weighted imaging, time-lapse MRI offers a useful tool to track iron-labeled cells non-invasively with whole-brain coverage2-4. We use contrast simulations based on assembled k-space, a rotating phantom system mimicking migrating cells, and in vivo time-lapse MRI in mouse brains to validate that single patrolling immune cells can be resolved. Further, we study patrolling monocytes and their altered motion behavior under inflammatory conditions distant from the site of inflammation.Methods
MRI. Time-lapse MRI, both in phantoms and in vivo, was performed on a 9.4 T Biospec (Bruker Biospin, Ettlingen, Germany) with cryogenic probe using a T2* weighted gradient echo sequence with the following scan parameters: TR: 643 ms, TE: 8.0 ms, FA: 60°, averages: 4, image matrix: 180 x 256, in-plane resolution: 67 x 55 µm2, 38 slices, slice thickness: 300 µm, scan time: 8 min 12 s, 20 repetitions.Simulations. Simulations of motion-dependent contrast were done with MATLAB by stepwise changing a signal voids position in a synthetic phantom and filling artificial k-space with fractions of the Fourier transforms of the individual images (figure 1a). An overlay was created by a voxelwise multiplication with in vivo time-lapse MRI data.2,3
Rotating phantom system. A system (figure 2) was built to rotate agar gel phantoms with embedded iron-labeled monocytes (in vitro labeling as described previously2) inside the scanner imitating moving cells. A stepper motor (Nanotec) with mounted planetary gear allows to mimic cell motion at velocities close to the estimated detection limit (< 1 µm/s 2,3). Repeated T2* weighted images using the time-lapse sequence were acquired for a static phantom and a rotation of 4.4x10⁻³ rpm resulting in cell velocities of up to 2.3 µm/s. Hypointense spots then represent single cells.
In vivo time-lapse MRI. In mice, monocytes were labeled in vivo by i.v. injection of Ferucarbotran (Resovist®, Bayer AG) 24 h before scanning. First, in vivo time-lapse MRI was performed on 5 healthy BALB/c mice. Next, to investigate inflammatory conditions, a subcutaneous inflammation was induced by injection of polyacrylamide-gel containing lipopolysaccharides into both flanks of C57BL/6 mice. Mice were scanned 24 h (n=6), 48h (n=6), 72 h (n=5), 7 d (n=5), and 30 d (n=5) post induction3. Additionally, n=8 control C57BL/6 mice were examined without pellet application.3 Single cells were again identified as hypointense spots, labeled, counted, and tracked using ImageJ and MATLAB.
Results and discussion
The superpositions of simulated cells and real MRI data (figure 1b) agree with the time-lapse images of iron-labeled monocytes inside a rotating phantom and evidently show the increasing blurring of contrast with faster cell movement. The simulations suggest a maximum detectable speed of around 1 µm/s. However, the phantom measurements demonstrate that the detectable velocity range of moving cells is also dependent on the generated contrast in a static position. Hence, high contrast cells close to the edge of the phantom become more and more blurred but remain visible, while low contrast cells disappear when the phantom is rotating (figure 3).Moreover, in vivo time-lapse MRI enables single-cell tracking of iron-labeled immune cells (figure 4a). By classifying cell motion into different patterns, in vivo time-lapse MRI is able to distinguish between short-term patrolling (in one or two consecutive timeframes), patrolling in confined regions (long-term short-range, in three or more consecutive timeframes), and cells that patrol over extended distances (long-term long-range, in three or more consecutive timeframes with in-plane motion) (figure 4b). For the latter, in 5 healthy mice, a total of 231 cells were detected moving across several voxels with a mean velocity of 0.19 ± 0.06 µm/s (figure 4c) agreeing with the speed of patrolling monocytes as determined by intravital microscopy1.
Furthermore, with the onset of an immune response monocytes start rolling with much higher velocities (~40 µm/s)1 and thus cannot be resolved by time-lapse MRI anymore 2,3. As a consequence, the number of total detected cells decreases upon a peripheral inflammatory stimulus and restores when the inflammation is healed (figure 5a). In addition, the remaining detectable cells lean towards a long-term short-range motion behavior (figure 5b) indicating, although less in total of cells, a more intense patrolling behavior3.
Conclusion
In summary, contrast simulations are in line with in vivo time-lapse MRI data and can be validated by phantom measurements imitating moving cells. All three approaches indicate that patrolling immune cells can be detected and followed dynamically. Furthermore, in vivo time-lapse MRI is able to measure the velocity of cells migrating over an extended distance, to distinguish between different motion patterns of slowly moving cells, and to detect changes in motion behavior due to inflammation. Therefore, we understand time-lapse MRI as being a useful tool for preclinical research to track intravascular patrolling single cells and to study inflammatory diseases. In the future, we aim at accelerating MR acquisition to potentially capture rolling immune cells as well.Acknowledgements
This study was supported by the German Research Foundation (DFG; SFB 1009 TP-Z02 to CF), the Joachim Herz Foundation (Add-on Fellowship for Interdisciplinary Life Sciences to MM), the Interdisciplinary Centre for Clinical Research (IZKF, core unit PIX) and the Medical Faculty of the University of Muenster (MEDK dissertation fellowship to FF and IF).References
- Auffray C, Fogg D, Garfa M, et al. Monitoring of blood vessels and tissues by a population of monocytes with patrolling behavior. Science. 2007;317(5838):666-670. doi:10.1126/science.1142883
- Masthoff M, Gran S, Zhang X, et al. Temporal window for detection of inflammatory disease using dynamic cell tracking with time-lapse MRI. Sci Rep. 2018;8(1):9563. doi:10.1038/s41598-018-27879-z
- Masthoff M, Freppon F, Zondler L, et al. Resolving immune cells with patrolling behaviour by magnetic resonance time-lapse single cell tracking. EBioMedicine. 2021;73:103670. DOI:10.1016/j.ebiom.2021.103670.
- Mori Y, Chen T, Fujisawa T, et al. From cartoon to real time MRI: in vivo monitoring of phagocyte migration in mouse brain. Sci Rep. 2014;4:6997. doi:10.1038/srep06997
Figures
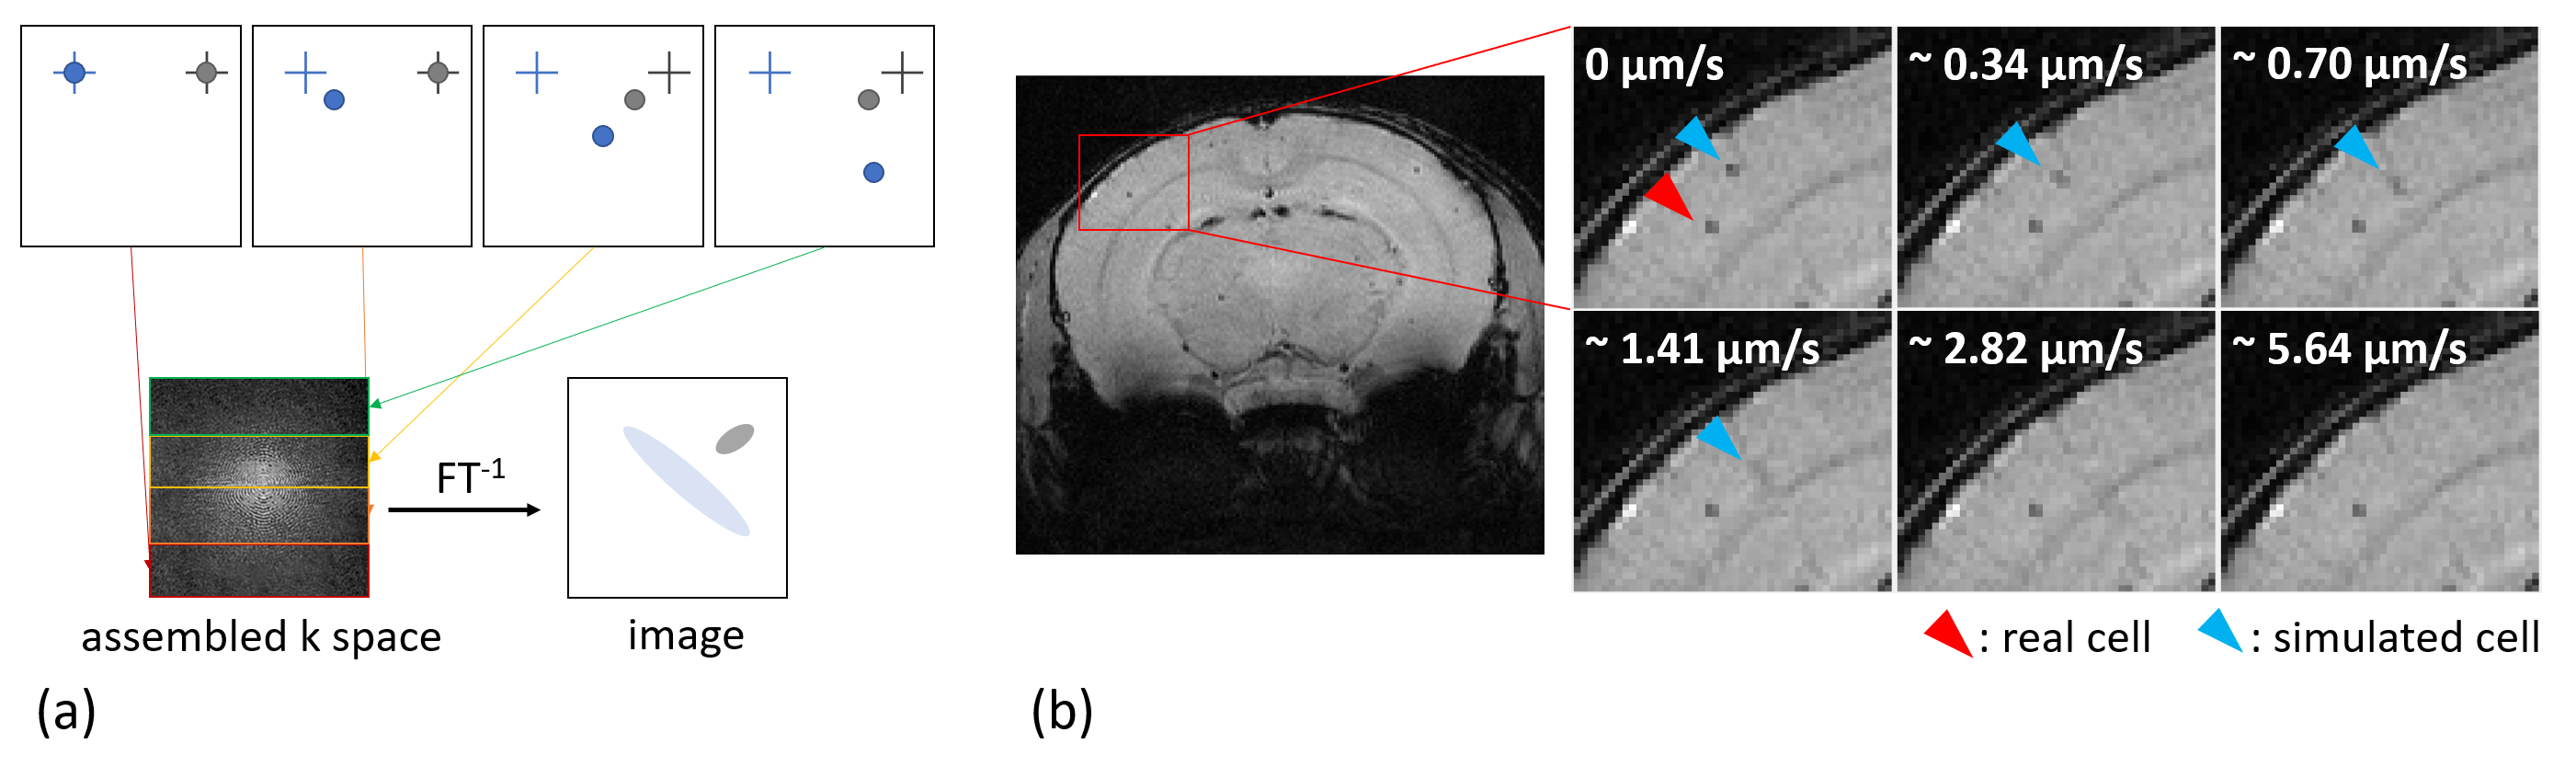
Simulations of
time-lapse contrast. (a) Basic principle of how motion-dependent contrast is
simulated through assembled k-space. (b) Image details in the mouse brain
cortex, indicated by the red rectangle, of an overlay of a representative in vivo time-lapse image and the
contrast simulation for different cell motion velocities, showing a real (red
arrowhead) and a simulated (blue arrowhead) cell.
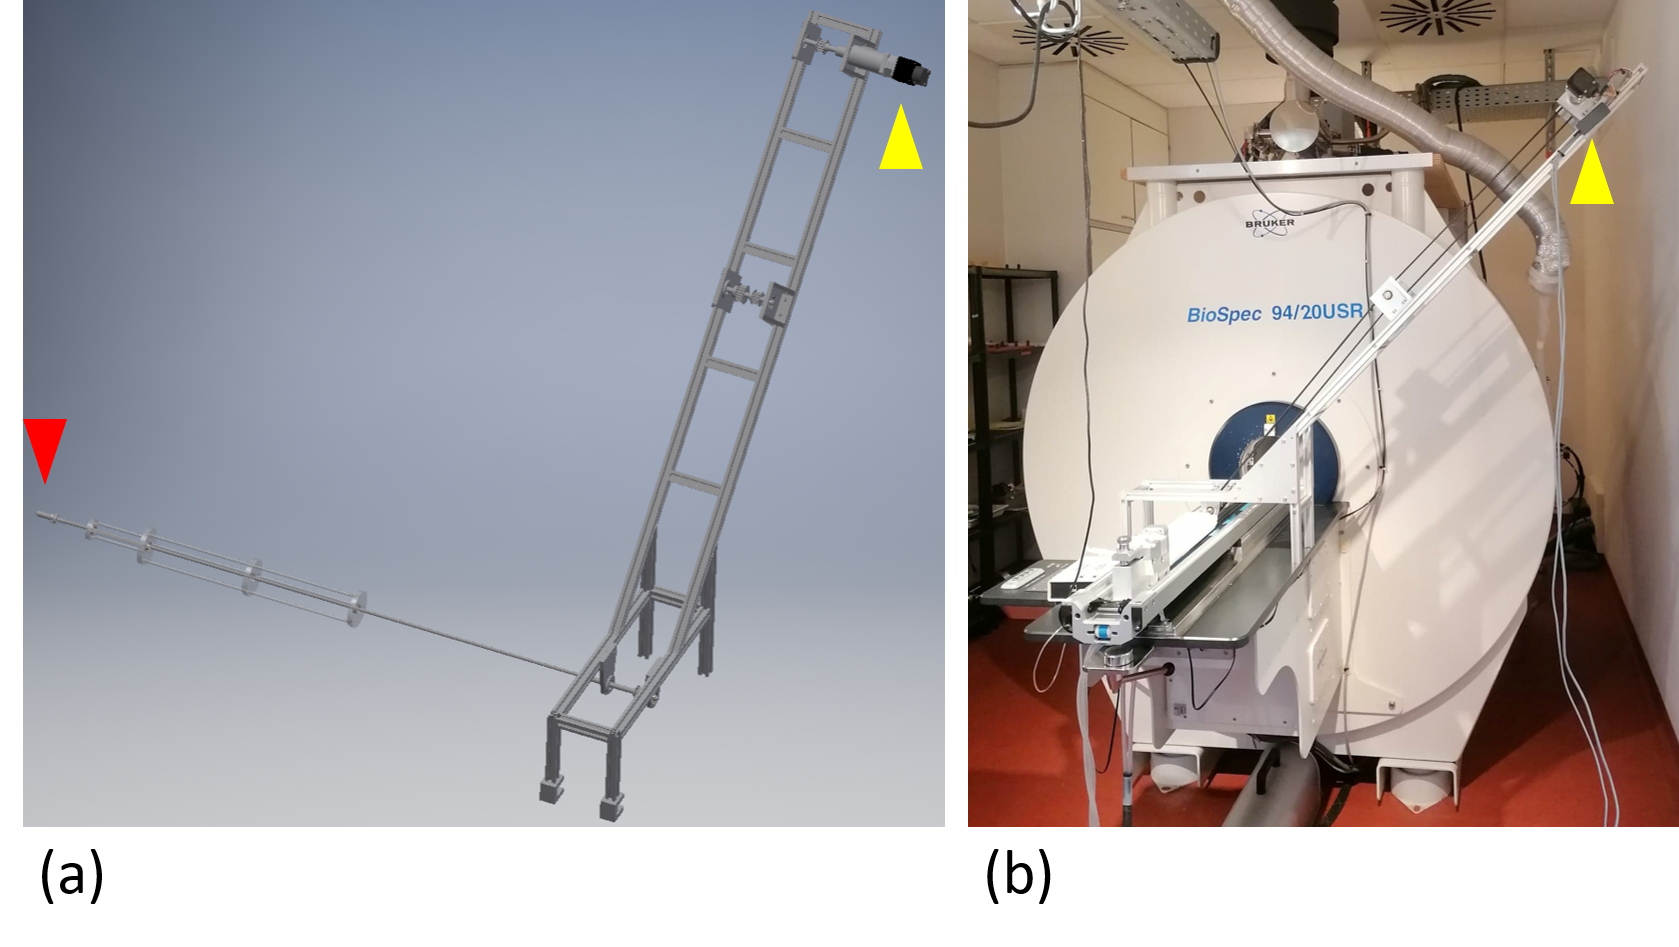
Rotating phantom system. (a) Design sketch and (b) photo of the system installed at the scanner. A centered position of the phantom (red arrowhead) is assured using a glass fiber stick mounted with ball bearings. The motor (yellow arrowhead) is mounted on an aluminum structure at distance from the bore center to reduce disturbance and damage due to the stray field. The rotation of the phantom is driven through toothed belts.
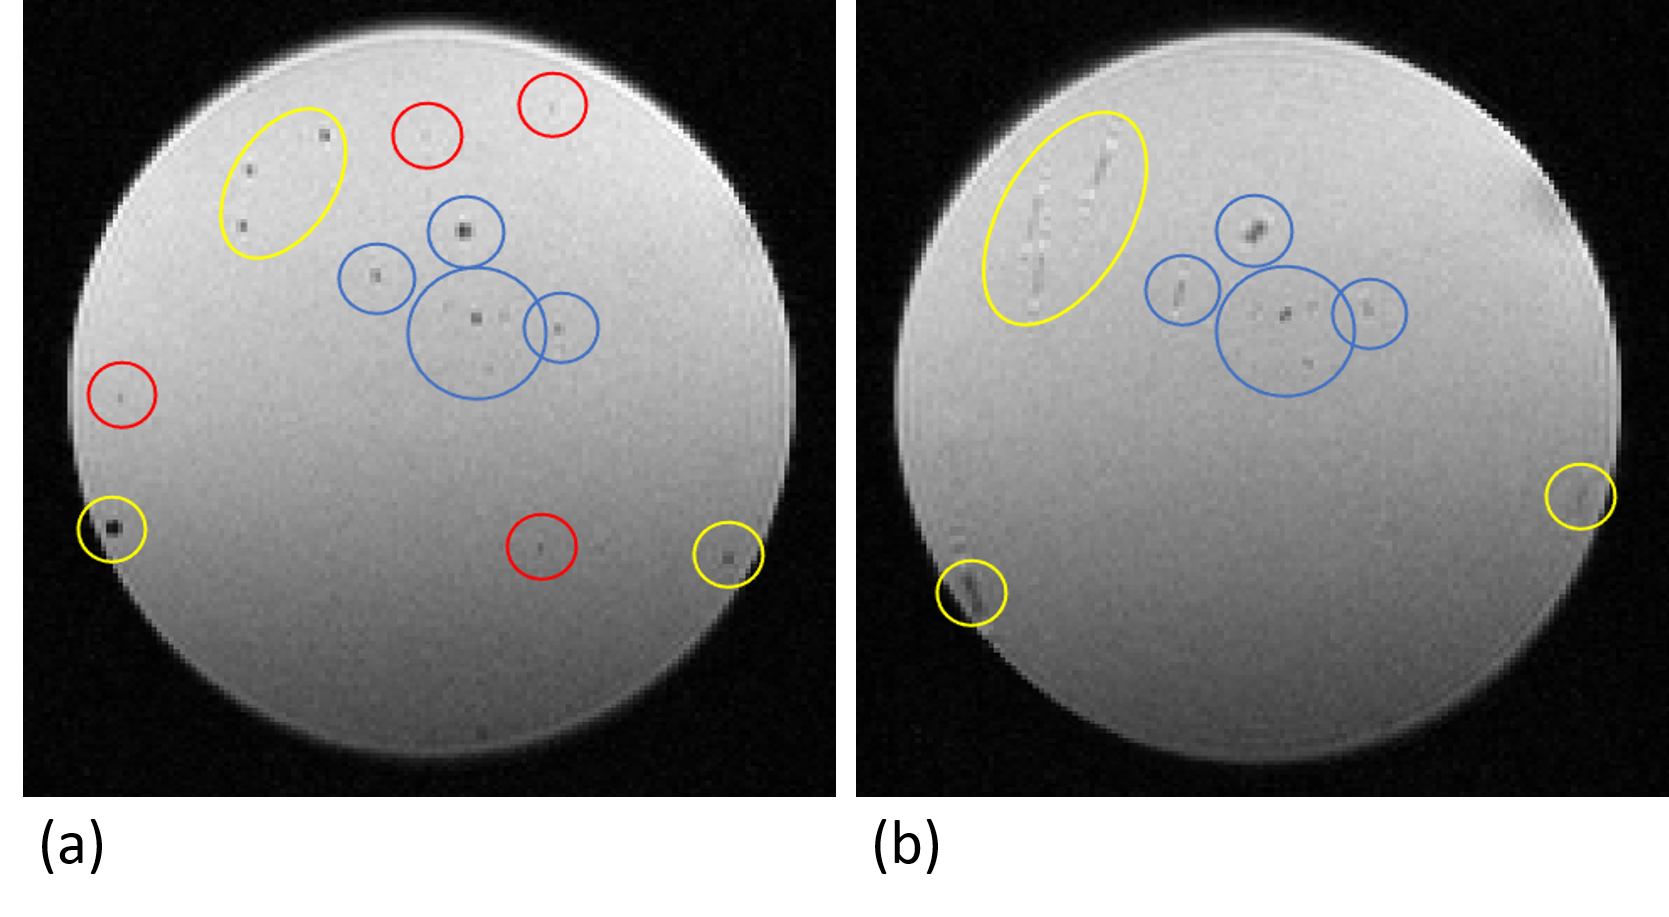
Rotating phantom
measurements of iron-labeled monocytes embedded in agarose for (a) a static
position and (b) with a rotation of 4.4x10⁻³ rpm. Cells close to the
axis of rotation remain visible in both images (blue circles). Depending on the
contrast in the non-rotating phantom, faster moving cells (up to 2.3 µm/s)
generate blurred contrast (yellow circles) or are not visible anymore (red
circles).
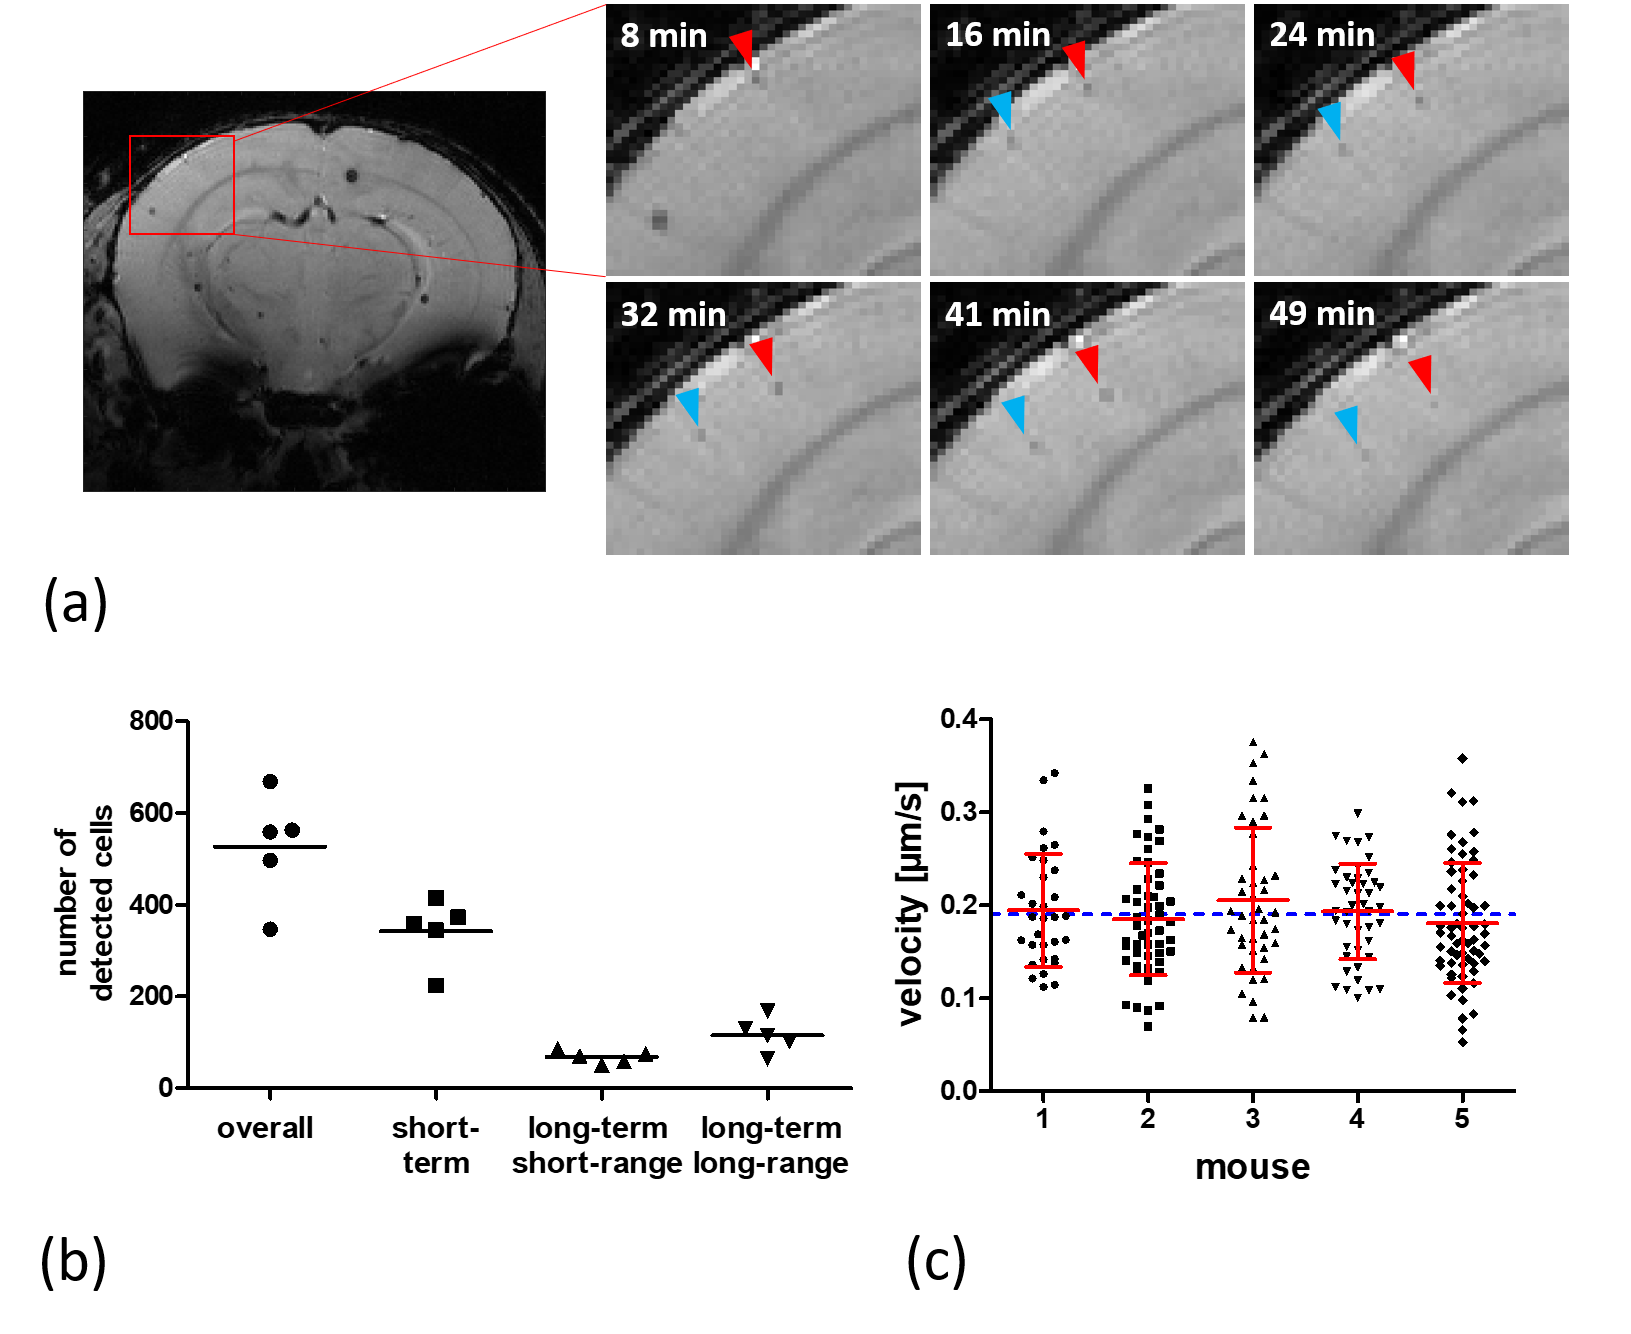
In vivo time-lapse MRI in healthy mice.
(a) Image details in the brain cortex, indicated by the red rectangle, showing two
cells moving across several voxels in consecutive timeframes. (b). In n=5
healthy mice (each represented by one dot), the total number of cells were
classified into different motion patterns. (c) The mean velocity of migrating
cells in healthy mice was determined to be 0.19 ± 0.06 µm/s (blue
line). Individual cell motion velocities (black),
their mean and standard deviation (red) for 5 individual mice are shown.
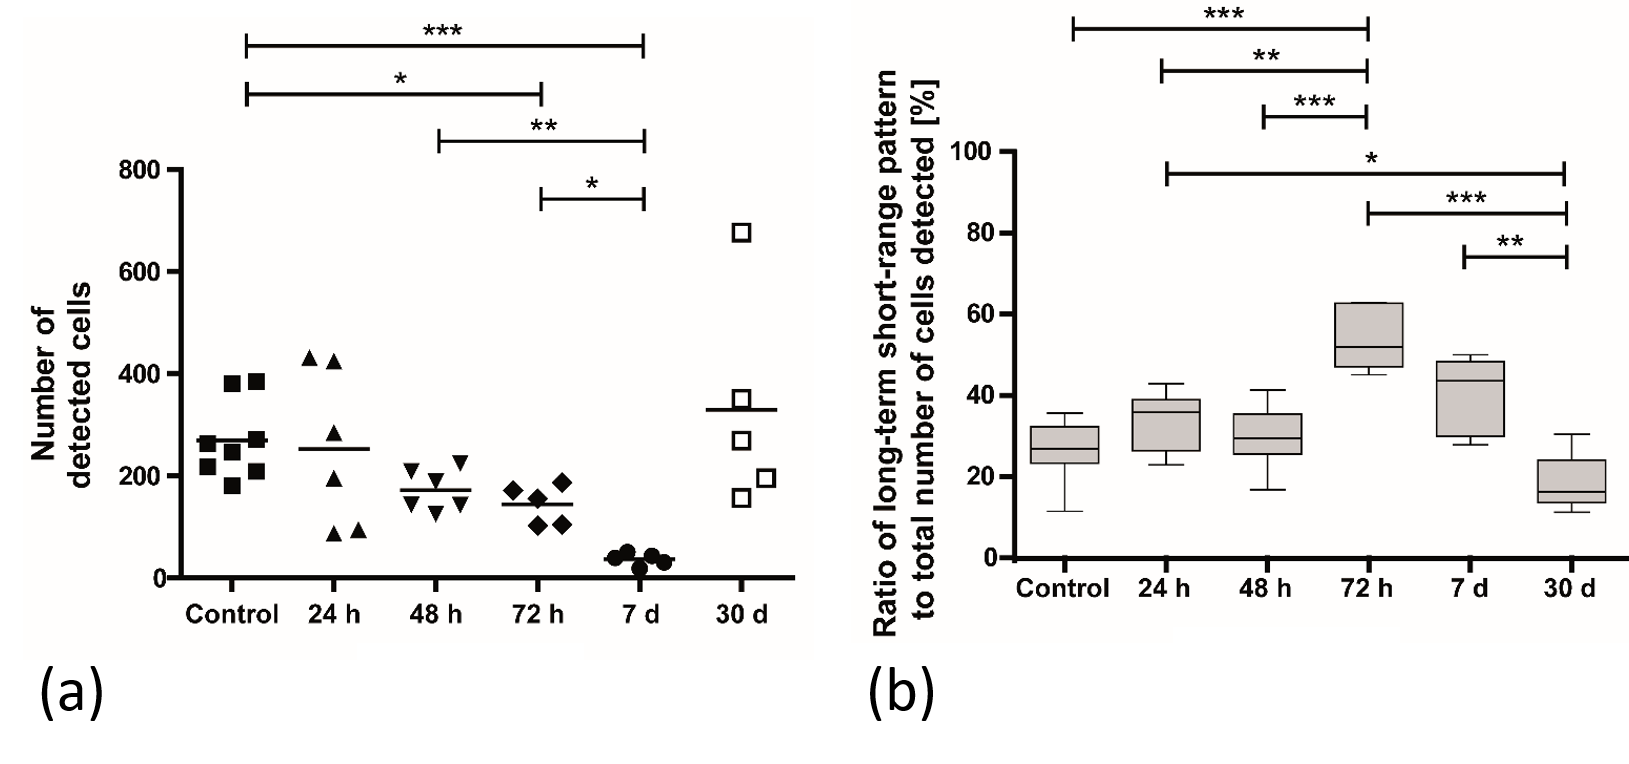
In vivo
time-lapse MRI at different time points after a subcutaneous inflammation was
induced. (a) The total number of detected cells and (b) the ratio of cells
associated with a long-term short-range motion pattern to the total number of
cells counted changes over time. 3
DOI: https://doi.org/10.58530/2022/0447