0446
Quantitative assessment of cerebral oxygen extraction fraction (OEF) in the medial temporal lobe1Department of Radiology, Johns Hopkins University School of Medicine, Baltimore, MD, United States, 2Department of Diagnostic Radiology and Nuclear Medicine, University of Maryland School of Medicine, Baltimore, MD, United States, 3Department of Neurology, Johns Hopkins University School of Medicine, Baltimore, MD, United States, 4Department of Neurosurgery, Johns Hopkins University School of Medicine, Baltimore, MD, United States, 5Department of Biomedical Engineering, Johns Hopkins University School of Medicine, Baltimore, MD, United States, 6F.M. Kirby Research Center for Functional Brain Imaging, Kennedy Krieger Research Institute, Baltimore, MD, United States
Synopsis
The medial temporal lobe (MTL), including the hippocampus, is a key area implicated in many brain diseases, such as Alzheimer’s disease. Since neural activity is tightly coupled to the brain’s oxygen consumption, oxygen-extraction-fraction (OEF) in the MTL (MTL-OEF) may serve as a functional biomarker for this critical region. In this work, we developed a novel non-invasive MRI technique, AS-aTRUPC, to specifically measure the MTL-OEF in the human brain. We found that in healthy volunteers, the MTL-OEF is lower than the cortical OEF. The sensitivity of our technique in detecting changes in MTL-OEF was demonstrated in caffeine challenge experiments.
INTRODUCTION
The medial temporal lobe (MTL), including the hippocampus, is a key area implicated in many brain diseases, such as Alzheimer’s disease (AD)1-3, schizophrenia4 and epilepsy5. For example, MTL atrophy has been a hallmark of AD1-3. However, structural atrophy represents a late stage of MTL impairment and is generally considered irreversible. At early stages of brain diseases, functional biomarkers may be more sensitive to tissue impairment6. Since neural activity is tightly coupled to the brain’s oxygen consumption7, oxygen-extraction-fraction (OEF) in the MTL (MTL-OEF) may serve as a functional biomarker for this critical region8. Therefore, the goal of this work is to develop a novel MRI technique to quantitatively measure MTL-OEF in the human brain.METHODS
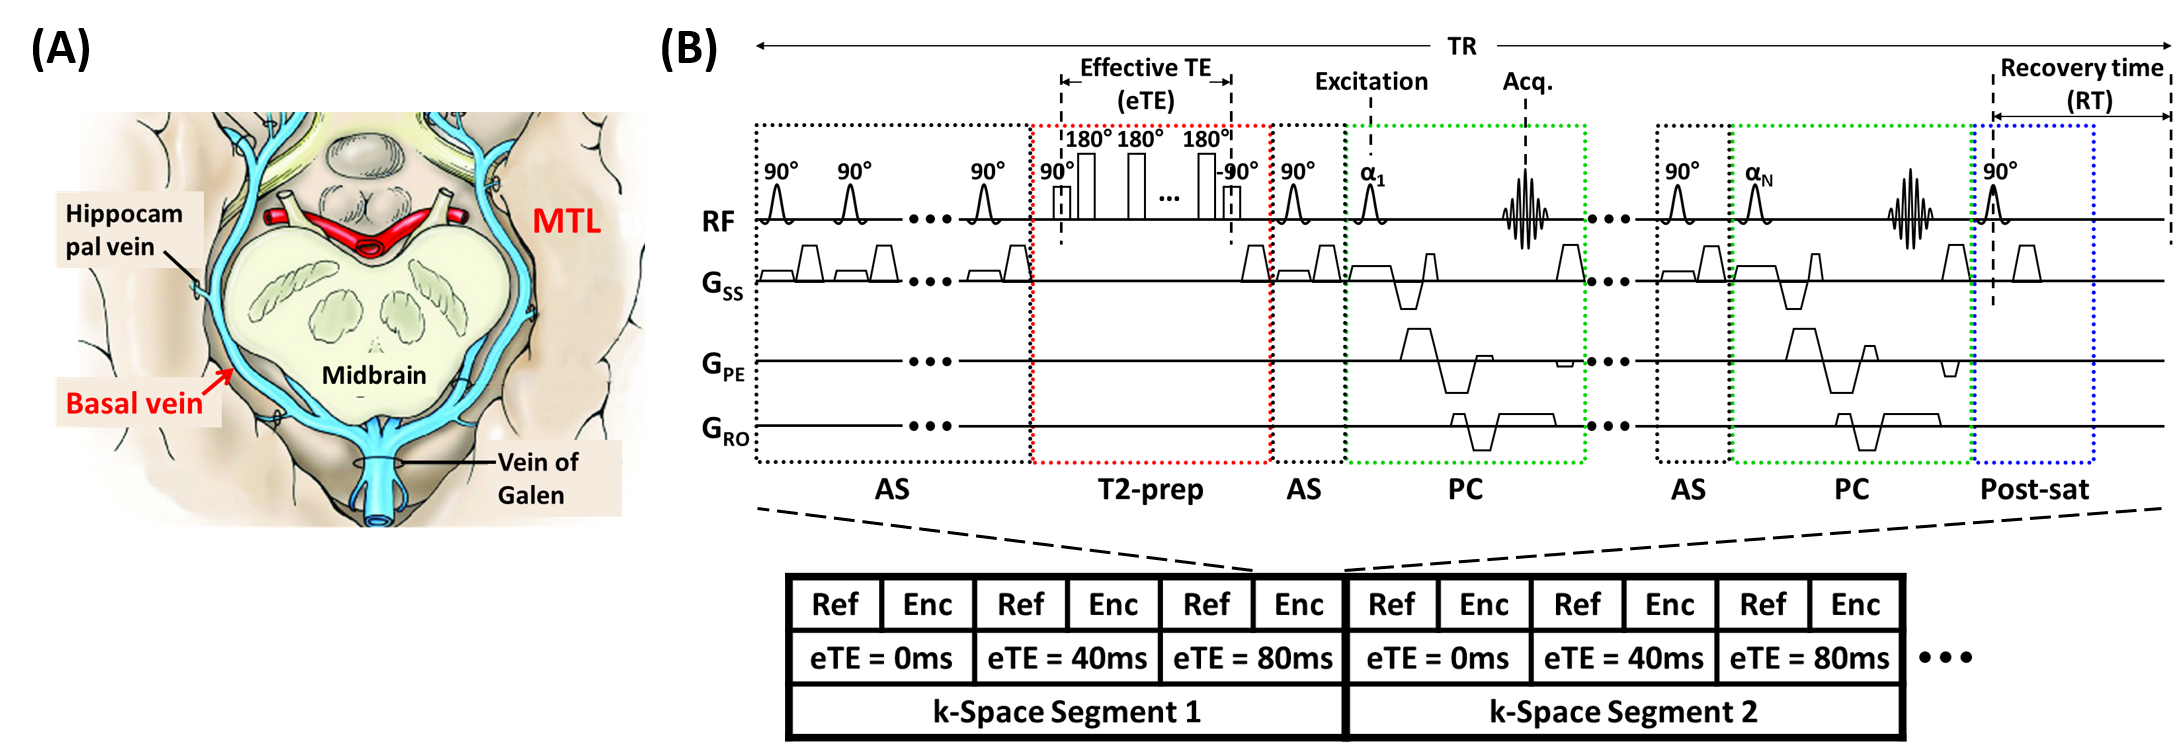
Principle: OEF can be estimated from the arterio-venous difference in oxygenation. MTL is mainly drained by basal-veins-of-Rosenthal (BVs) (Figure 1A), which have relatively little variations across individuals9 and provide a foundation for MTL-OEF measurement. The key step is then to measure venous oxygenation (Yv) in the BVs.Pulse sequence: Figure 1B illustrates the proposed arterial-suppressed accelerated T2-relaxation-under-phase-contrast (AS-aTRUPC) MRI pulse sequence. Briefly, this sequence utilizes phase-contrast (PC, green boxes in Figure 1B) complex subtraction to isolate pure blood signal in the BVs, and applies T2-preparation (Figure 1B, red box) with varying effective TEs (eTEs) to quantify the blood T2, which can be converted to Yv through a calibration model10. OEF can then be calculated as OEF=(Ya−Yv)/Ya×100%, where arterial oxygenation Ya is assumed to be 98%. To minimize arterial contamination from the posterior cerebral arteries that are anatomically adjacent to BVs, arterial-suppression (AS) pulses (Figure 1B, black boxes) are used to suppress the incoming arterial blood throughout the acquisition train. To reduce the scan time, the turbo-field-echo (TFE) scheme is used to acquire multiple k-lines per TR11.
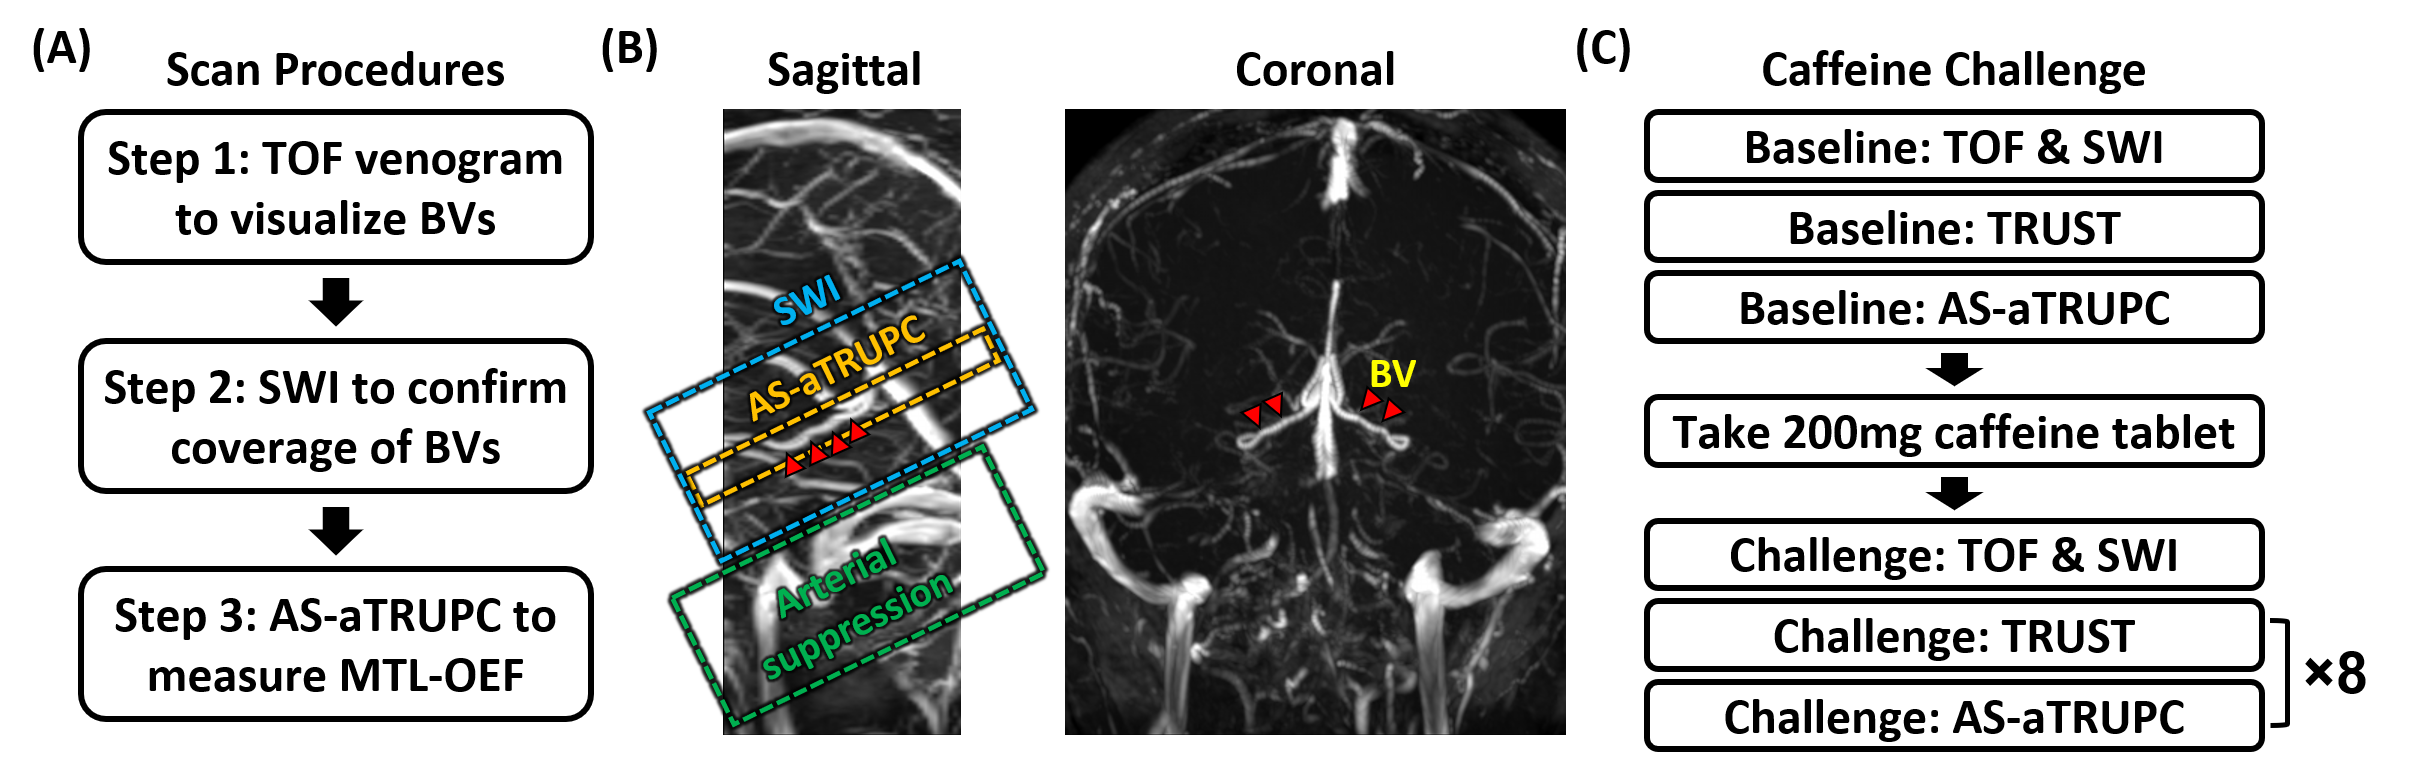
Scan Procedures: Figure 2A shows the general scan procedures to measure MTL-OEF. First, to visualize the BVs to position AS-aTRUPC, a time-of-flight (TOF) venogram was acquired. This venogram was placed coronally and covered the middle part of the brain. Second, a 3D susceptibility-weighted-imaging (SWI) scan was performed to cover the courses of bilateral BVs. Minimal-intensity-projection (mIP) images were then generated. Finally, we positioned the imaging slice of AS-aTRUPC at the same location as the SWI mIP image that showed the best coverage of bilateral BVs, and placed the AS slab below the imaging slice (Figure 2B).
Study 1: Feasibility Study: Twenty healthy subjects (10M/10F, age 33±11) were scanned to determine the normative values of MTL-OEF. TOF venogram used: 2D field-of-view (FoV)=200×200mm2, slice thickness=2mm, in-plane resolution=0.8×0.8mm2 and scan time=2.7min. SWI used: 3D FoV=180×220×50mm3, voxel-size=0.9×0.9×1.3mm3, TR/TE=30/24ms, scan time=2.2min. AS-aTRUPC used: 2D single slice, FoV=200×200mm2, slice thickness=10mm, reconstructed in-plane resolution=0.8×0.8mm2, 3 eTEs: 0, 40 and 80ms, 4 averages, velocity-encoding (VENC)=7cm/s, TFE factor=15, arterial-suppression slab thickness=40mm with a gap of 10mm below the imaging slice, scan time=4.8min.
Study 2: Caffeine challenge: To evaluate the sensitivity of AS-aTRUPC to OEF changes, on ten of the subjects (4M/6F, age 26±4), we conducted a caffeine challenge that is known to increase OEF12. The experimental procedure is listed in Figure 2C. TOF, SWI and AS-aTRUPC used the same protocols as described in Study 1. For comparison with AS-aTRUPC, we also measured the OEF in the superior-sagittal-sinus (SSS) using a global OEF technique, T2-relaxation-under-spin-tagging (TRUST) MRI, which has been validated against gold-standard 15O-PET13. The TRUST scan protocol followed the literature13. Each subject first underwent one TRUST and one AS-aTRUPC scan to measure baseline OEF values, then took one 200mg caffeine tablet and underwent another 8 TRUST and AS-aTRUPC scans.
Data analysis: The processing of AS-aTRUPC data followed similar procedures in the literature11. OEF was quantified from four region-of-interests: two on bilateral BVs, one on vein-of-Galen (GV) and one on SSS. TRUST data was processed following the literature13.
RESULTS AND DISCUSSION
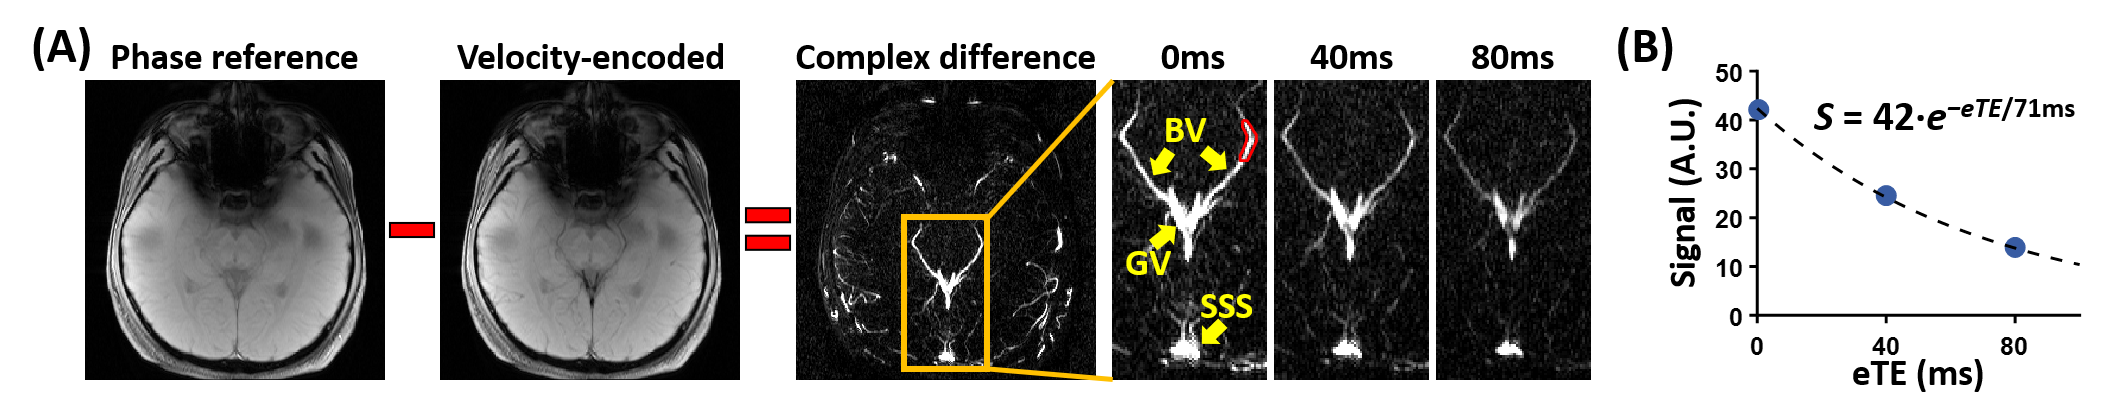
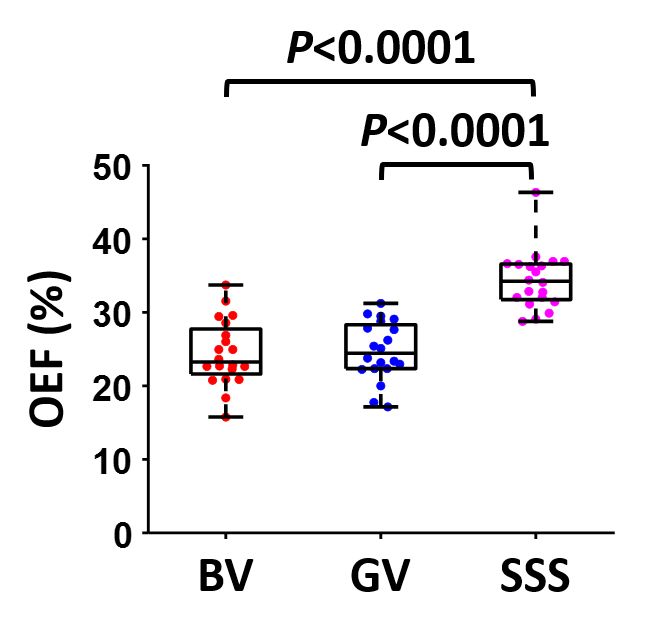
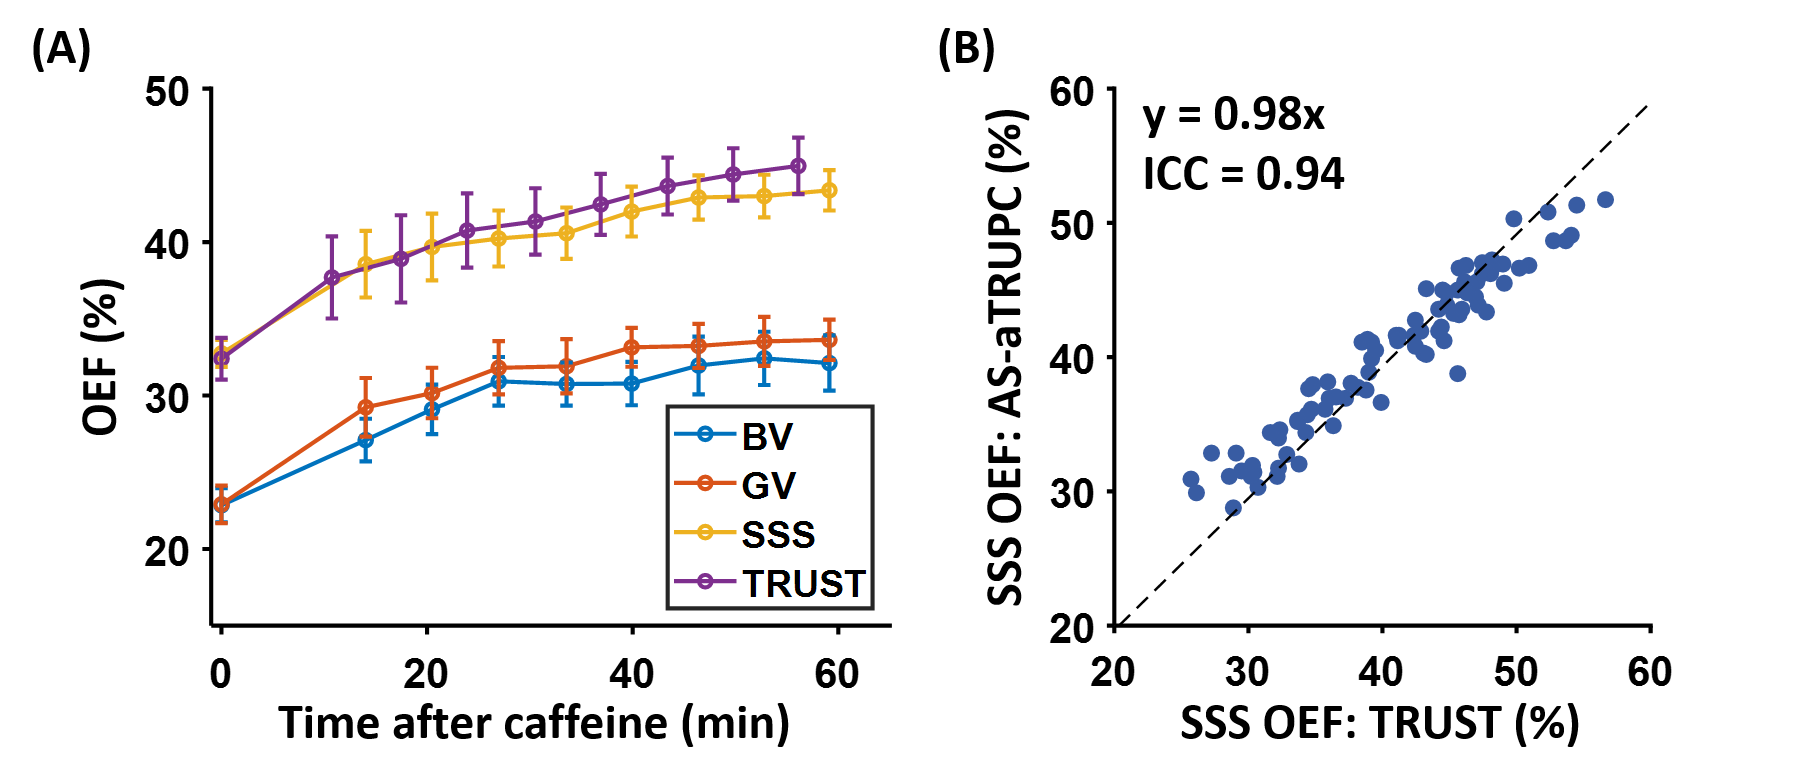
Study 1: Figure 3 shows representative AS-aTRUPC data. Complex subtraction between the phase reference (“Ref” in Figure 1B) and the velocity-encoded (“Enc” in Figure 1B) images yields a complex difference image, in which the tissue signals are cancelled out, leaving only the blood signal in the vessels (thereby eliminating partial volume effects). Across the subjects, OEF in BV, GV and SSS were 24.5±4.5%, 24.8±4.0% and 34.4±4.0%, respectively (Figure 4). OEF in BV (which represents the MTL-OEF) was similar to OEF in GV (paired t-test P=0.66), but both of them were considerably lower than OEF in SSS (P<0.0001). This is consistent with previous reports that veins draining the deep brain (e.g., BV, GV) have lower OEF than veins draining the cortical region (e.g., SSS)11,14.Study 2: As illustrated in Figure 5A, after caffeine ingestion, OEF showed an expected increase in all veins. Comparing the last time point to the baseline, the caffeine-induced OEF increases were 9.3±4.1%, 10.7±3.8% and 10.6±2.9% in BV, GV and SSS, respectively (P<0.0001 for all veins), demonstrating the sensitivity of AS-aTRUPC. In addition, OEF in SSS measured by AS-aTRUPC agreed well with TRUST OEF, with a strong correlation (intraclass-correlation-coefficient=0.94, Figure 5B) and no significant bias (P=0.12), suggesting that AS-aTRUPC has similar accuracy in OEF measurement compared to TRUST.
CONCLUSION
We have developed a novel MRI technique to measure MTL-OEF, which facilitates future studies of brain diseases such as AD.Acknowledgements
No acknowledgement found.References
1. Jack CR, Jr., Petersen RC, Xu YC, Waring SC, O'Brien PC, Tangalos EG, Smith GE, Ivnik RJ, Kokmen E. Medial temporal atrophy on MRI in normal aging and very mild Alzheimer's disease. Neurology 1997;49:786-794.
2. Duara R, Loewenstein DA, Potter E et al. Medial temporal lobe atrophy on MRI scans and the diagnosis of Alzheimer disease. Neurology 2008;71:1986-1992.
3. Burton EJ, Barber R, Mukaetova-Ladinska EB, Robson J, Perry RH, Jaros E, Kalaria RN, O'Brien JT. Medial temporal lobe atrophy on MRI differentiates Alzheimer's disease from dementia with Lewy bodies and vascular cognitive impairment: a prospective study with pathological verification of diagnosis. Brain 2009;132:195-203.
4. Mathew I, Gardin TM, Tandon N et al. Medial temporal lobe structures and hippocampal subfields in psychotic disorders: findings from the Bipolar-Schizophrenia Network on Intermediate Phenotypes (B-SNIP) study. JAMA Psychiatry 2014;71:769-777.
5. Bonilha L, Rorden C, Castellano G, Pereira F, Rio PA, Cendes F, Li LM. Voxel-based morphometry reveals gray matter network atrophy in refractory medial temporal lobe epilepsy. Arch Neurol 2004;61:1379-1384.
6. Lin Z, Sur S, Soldan A et al. Brain Oxygen Extraction by Using MRI in Older Individuals: Relationship to Apolipoprotein E Genotype and Amyloid Burden. Radiology 2019;292:140-148.
7. Attwell D, Laughlin SB. An energy budget for signaling in the grey matter of the brain. J Cereb Blood Flow Metab 2001;21:1133-1145.
8. Ishii K, Kitagaki H, Kono M, Mori E. Decreased medial temporal oxygen metabolism in Alzheimer's disease shown by PET. J Nucl Med 1996;37:1159-1165.
9. Tubbs RS, Loukas M, Louis RG, Jr., Shoja MM, Askew CS, Phantana-Angkool A, Salter EG, Oakes WJ. Surgical anatomy and landmarks for the basal vein of rosenthal. J Neurosurg 2007;106:900-902.
10. Lu H, Xu F, Grgac K, Liu P, Qin Q, van Zijl P. Calibration and validation of TRUST MRI for the estimation of cerebral blood oxygenation. Magn Reson Med 2012;67:42-49.
11. Jiang D, Lu H, Parkinson C, Su P, Wei Z, Pan L, Tekes A, Huisman T, Golden WC, Liu P. Vessel-specific quantification of neonatal cerebral venous oxygenation. Magn Reson Med 2019;82:1129-1139.
12. Xu F, Liu P, Pekar JJ, Lu H. Does acute caffeine ingestion alter brain metabolism in young adults? Neuroimage 2015;110:39-47.
13. Jiang D, Deng S, Franklin CG, O'Boyle M, Zhang W, Heyl BL, Pan L, Jerabek PA, Fox PT, Lu H. Validation of T2 -based oxygen extraction fraction measurement with (15) O positron emission tomography. Magn Reson Med 2021;85:290-297.
14. Krishnamurthy LC, Liu P, Ge Y, Lu H. Vessel-specific quantification of blood oxygenation with T2-relaxation-under-phase-contrast MRI. Magn Reson Med 2014;71:978-989.
Figures