0442
Estimation of anisotropic mechanical properties of gastrocnemius during muscle contraction with MR elastography1Biomedical Engineering, University of Delaware, Newark, DE, United States, 2Thayer School of Engineering, Dartmouth College, Hanover, NH, United States, 3Universite de Sherbrooke, Sherbrooke, QC, Canada, 4Mechanical Engineering and Materials Science, Washington University in St. Lous, St. Louis, MO, United States
Synopsis
In this study, we utilized MR elastography (MRE) and transversely isotropic inversion to estimate anisotropic material parameters of muscle during contraction states, including passive muscle lengthening and isometric contraction. We collected MRE and DTI data on six subjects and took averages of the parameters within the medial and lateral heads of the gastrocnemius muscle and compared the results during the contraction states. We found significant differences between the estimates during the various states of contraction. Here we demonstrate that MRE and TI-NLI can generate anisotropic parameter estimates for muscle tissue while capturing changes to functional aspects of the tissue.
Introduction
Skeletal muscle mechanics can be quantified using magnetic resonance elastography (MRE)1, an MRI technique for imaging tissue viscoelastic mechanical properties2. Recent advances in MRE techniques and inversion algorithms, including transversely isotropic nonlinear inversion (TI-NLI)3, allow for accurate assessment of fibrous tissues that exhibit anisotropic mechanical properties with MRE. TI-NLI utilizes MRE motion data to estimate both shear and tensile anisotropic parameters of the tissue based upon a transversely isotropic material model4. The architecture of skeletal muscle requires such an anisotropic MRE approach5, which may also provide insights into functional aspects of muscle tissue, particularly isometric contraction and fascicle lengthening that are expected to change the anisotropic nature of tissue behavior6,7. In this study, we use MRE and TI-NLI to estimate anisotropic material parameters during a variety of skeletal muscle contractile states, including passive lengthening and isometric contraction.Methods
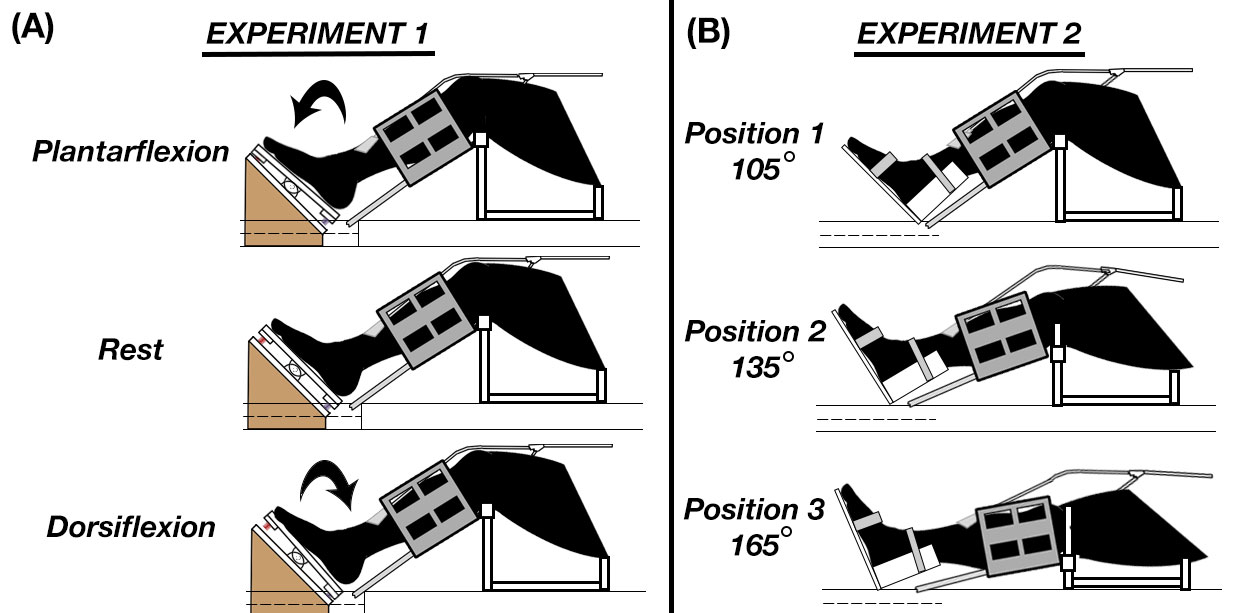
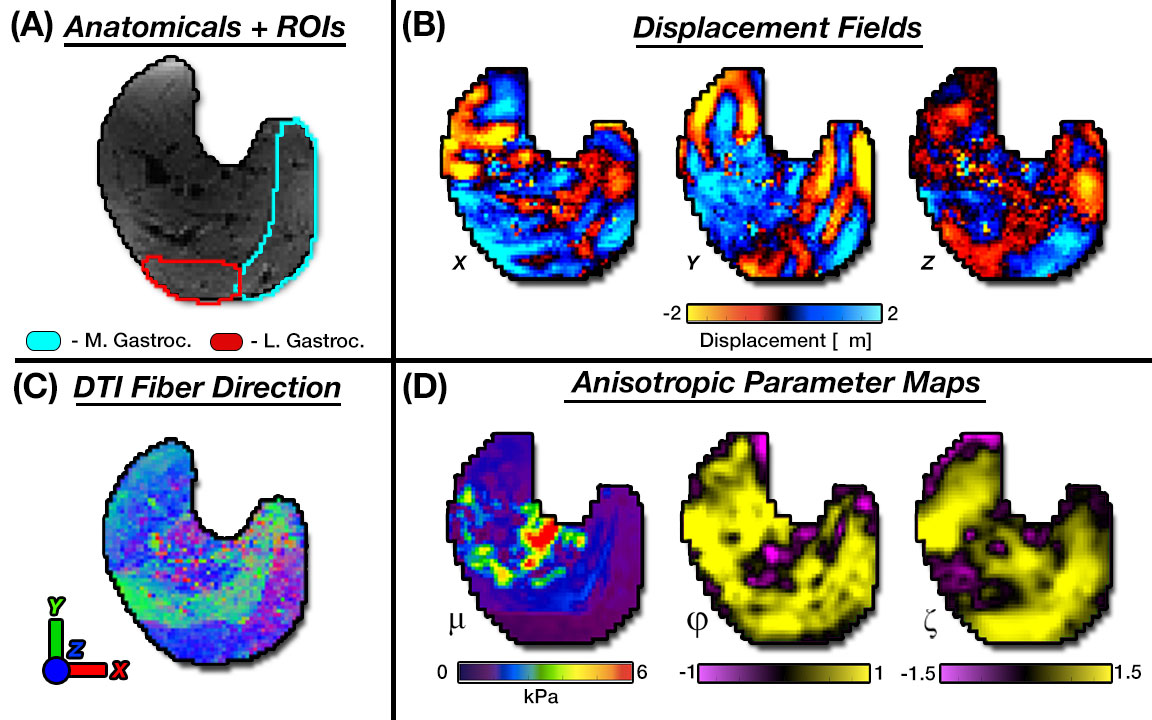
Six young healthy subjects (4/2 M/F; ages 22-27) had their right calf scanned using a Siemens 3T Prisma MRI scanner, with a combination of small flexible surface coils. Two custom-made passive drivers generated shear waves in conjunction with the Resoundant pneumatic actuation system (Rochester, MN). MRE data was collected using an EPI sequence with the following parameters: 2 x 2 x 3 mm3 voxels; field-of-view = 160 x 160 mm; 20 slices; TR/TE = 2400/59 ms; 50 Hz vibration; 4 phase offsets; time = 65 sec.We also acquired DTI data with resolution and field-of-view matched to the MRE with TR/TE = 2200/69 ms, b = 400 s/mm2, and 30 directions.Experiment 1 used the experimental setup in Figure 1A where subjects were instructed to produce active dorsiflexion and plantarflexion contraction states, and involved nine MRE scans: three during dorsiflexion, three during plantarflexion, and three during rest, with one DTI scan and one T1-weighted anatomical scan in the rest condition. Experiment 2 used the experimental setup in Figure 1B to achieve three different knee angles of 105°, 135°, and 165° while the ankle is fixed in a brace, and the acquisition of three MRE scans, and DTI and anatomical scans in each position.
Wave motion fields along with fiber directions estimated from DTI were used in TI-NLI to generate maps of three mechanical parameters: μ, φ, and ζ (Figure 2). Substrate shear stiffness (μ) is the stiffness perpendicular to the fibers (i.e. μ2), φ=(μ1/μ2)-1 is the shear anisotropy, and ζ=(E1/E2)-1 is the tensile anisotropy. [4] These two anisotropy parameters describe differences in mechanical properties parallel (μ1, E1) and perpendicular (μ2, E2) to the muscle fibers. Average anisotropic properties were determined in the medial and lateral heads of the gastrocnemius from manually generated volumes used as soft spatial priors in TI-NLI to limit effects of bone and other noise sources8. Differences between contraction states and positions were analyzed using a one-way ANOVA with a post-hoc Tukey test for each parameters.
Results
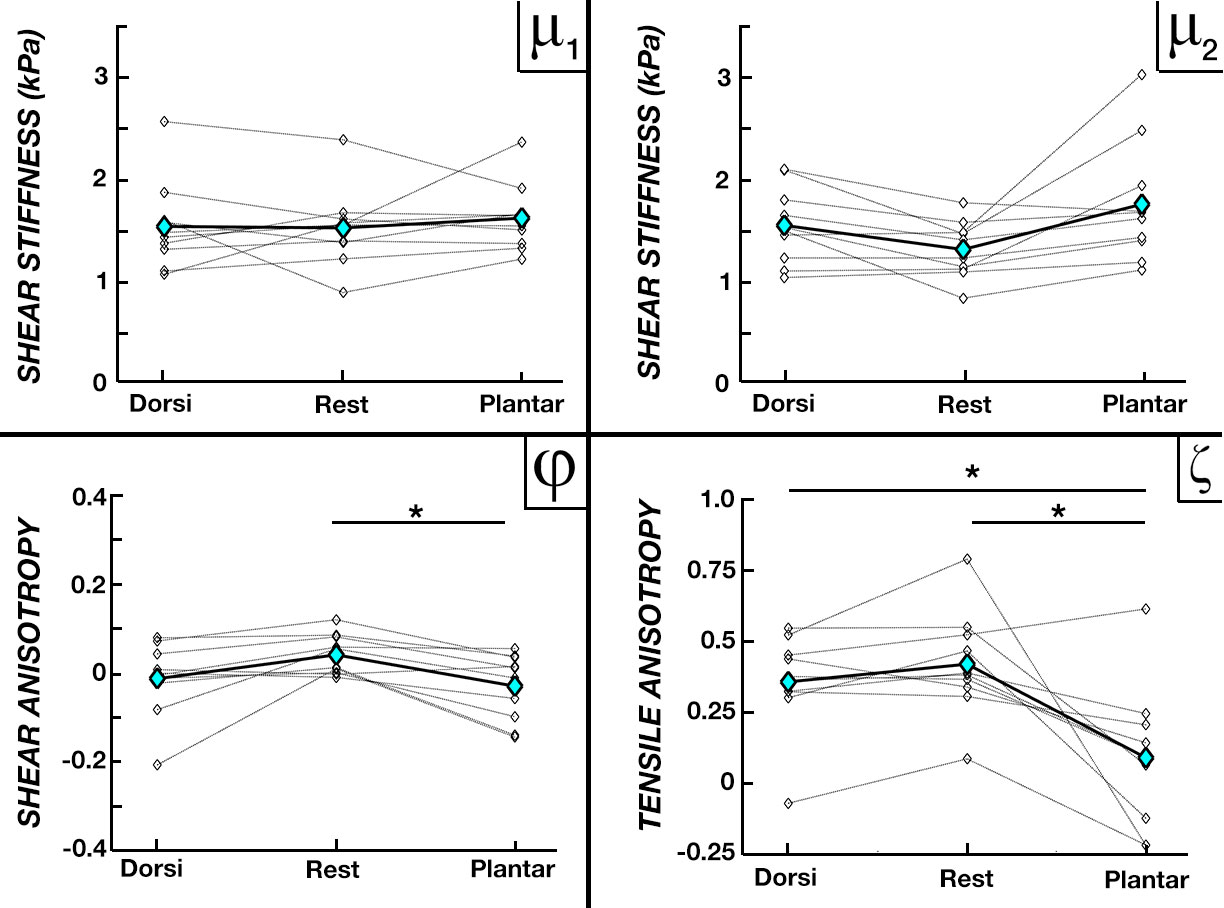
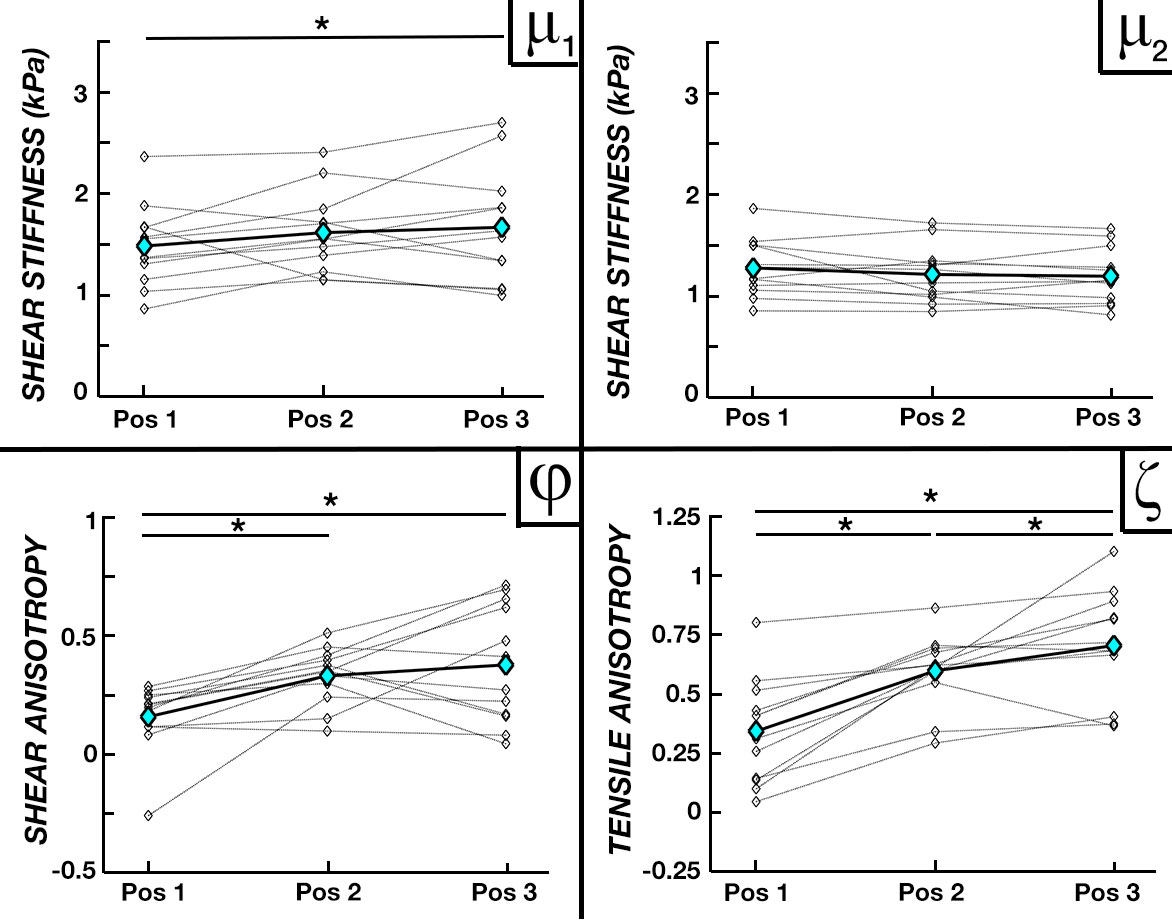
Figure 3 compares the parameter averages between active contraction states during Experiment 1. We found increases in μ2 – stiffness perpendicular to fibers – for both dorsiflexion and plantarflexion active contraction conditions when compared to rest (14.9% and 18.5%, respectively), while average φ and ζ decreased by 65% and 10% during dorsiflexion and 98.6% and 75% during plantarflexion. However, μ1 showed little to no variation between the activation states. Figure 4 shows the results of increasing knee angle from 105° to 165° during Experiment 2, in which we found increasing μ1, φ, and ζ with knee angle, though μ2 stayed relatively stable. From Position 1 to Position 3, μ1 increased by 16.8%, φ increased by 130.7%, and ζ increased by 100%.Discussion and Conclusions
In this study, we quantified how active muscle contraction or passive lengthening affect the anisotropic mechanical properties in the gastrocnemius using MRE and TI-NLI. Previous studies using MRE to quantify muscle stiffness have shown increases caused by isometric contraction as well as during increasing levels of tension from muscle lengthening, which our findings agree with9,10. However, the findings in this study portray two different mechanisms of action for these increases in stiffness. For isometric contraction in Experiment 1, μ2 increases which may correspond to the mechanism of contraction where myosin chains create cross bridges to binding sites on actin protein chains perpendicular to the muscle fiber direction, but does not change the length of the muscles and have little to no effect on the tension of the muscle7. In Experiment 2, passive lengthening does alter the length of the tissue, increasing tension6, which affects μ1 but not μ2. These two mechanisms also drive the resulting anisotropy parameters of φ and ζ in their respective directions.This method provides full volume estimation of the anisotropic parameters of the gastrocnemius muscle in the calf, utilizing a model that captures tissue behavior while estimating a minimal number of parameters. By capturing various aspects of how muscle tissue responds to activation and contraction, this study highlights the ability of anisotropic muscle MRE to quantify changes caused by pathologies such as cerebral palsy and muscle injury.
Acknowledgements
NIH grant R01-EB027577 and NSF grant CBET-1911683.References
[1] Dresner, M. A., Rose, G. H., Rossman, P. J., Muthupillai, R., Manduca, A., and Ehman, R. L., 2001, “Magnetic Resonance Elastography of Skeletal Muscle,” J. Magn. Reson. Imaging, 13(2), pp. 269–276.
[2] Mariappan, Y. K., Glaser, K. J., and Ehman, R. L., 2010, “Magnetic Resonance Elastography: A Review,” Clin. Anat., 23(5), pp. 497–511.
[3] McGarry, M., Houten, E. Van, Guertler, C., Okamoto, R., Smith, D., Sowinski, D., Johnson, C., Bayly, P., Weaver, J., and Paulsen, K., 2021, “A Heterogenous, Time Harmonic, Nearly Incompressible Transverse Isotropic Finite Element Brain Simulation Platform for MR Elastography,” Phys. Med. Biol., 66(5), p. 055029.
[4] Tweten, D. J., Okamoto, R. J., Schmidt, J. L., Garbow, J. R., and Bayly, P. V., 2015, “Estimation of Material Parameters from Slow and Fast Shear Waves in an Incompressible, Transversely Isotropic Material,” J. Biomech., 48(15), pp. 4002–4009.
[5] Fukunaga, T., Kawakami, Y., Kuno, S., Funato, K., and Fukashiro, S., 1997, “Muscle Architecture and Function in Humans,” J. Biomech., 30(5), pp. 457–463.
[6] Fukunaga, T., Ichinose, Y., Ito, M., Kawakami, Y., and Fukashiro, S., 1997, “Determination of Fascicle Length and Pennation in a Contracting Human Muscle in Vivo,” J. Appl. Physiol., 82(1), pp. 354–358.
[7] Linari, M., Dobbie, I., Reconditi, M., Koubassova, N., Irving, M., Piazzesi, G., and Lombardi, V., 1998, “The Stiffness of Skeletal Muscle in Isometric Contraction and Rigor: The Fraction of Myosin Heads Bound to Actin.,” Biophys. J., 74(5), p. 2459.
[8] McGarry, M., Johnson, C. L., Sutton, B. P., Van Houten, E. E., Georgiadis, J. G., Weaver, J. B., and Paulsen, K. D., 2013, “Including Spatial Information in Nonlinear Inversion MR Elastography Using Soft Prior Regularization,” IEEE Trans. Med. Imaging, 32(10), pp. 1901–1909.
[9] Schrank, F., Warmuth, C., Görner, S., Meyer, T., Tzschätzsch, H., Guo, J., Uca, Y. O., Elgeti, T., Braun, J., and Sack, I., 2020, “Real-Time MR Elastography for Viscoelasticity Quantification in Skeletal Muscle during Dynamic Exercises,” Magn. Reson. Med., 84(1), pp. 103–114.
[10] Babaei, B., Fovargue, D., Lloyd, R. A., Miller, R., Jugé, L., Kaplan, M., Sinkus, R., Nordsletten, D. A., and Bilston, L. E., 2021, “Magnetic Resonance Elastography Reconstruction for Anisotropic Tissues,” Med. Image Anal., 74.
Figures