0441
Performance of Proton Density Fat Fraction, MRE-based Liver Stiffness, and T1 in Identifying NASH Patients at High Risk of Disease Progression1Radiology, Mayo Clinic, Rochester, MN, United States, 2Anatomic Pathology, Mayo Clinic, Rochester, MN, United States, 3Gastroenterology and Hepatology, Mayo Clinic, Rochester, MN, United States
Synopsis
Multiparametric MRI/MRE and liver biopsy were performed in 104 patients at risk for NASH. We correlated measurements of proton density fat fraction (PDFF), 3D vector MRE-assessed liver stiffness (LS), and T1 relaxation time across histological features of NASH. We found that PDFF showed superior diagnostic performance in identifying patients with NASH (AUC: 0.84 [0.76, 0.92]), while LS showed superior diagnostic performance in stratifying NASH patients at high risk (0.85 [0.75, 0.94]). The results showed that T1 measurement, either alone or in combination with other biomarkers, did not perform as well as PDFF and LS in diagnosing NASH or stratifying high-risk NASH.
Introduction
Nonalcoholic fatty liver disease (NAFLD) is prevalent worldwide and has a rising global burden(1). The progressive status of nonalcoholic steatohepatitis (NASH) accounts for the increase in cases of compensated and decompensated cirrhosis by 2 to 3 times since 1990 (2). Fibrosis is the most important predictor of mortality in NAFLD. Regression and progression of fibrosis is associated with the improvement or worsening of disease activity, respectively (3). Furthermore, it has been demonstrated that NASH patients with fibrosis, particularly stage of 2 or higher, have less favorable outcomes with a significantly increased risk of liver-related mortality (4). The diagnosis of NASH with fibrosis stage 2 or higher is now used as criteria for enrollment in clinical trials. Therefore, prediction of this outcome would be crucial for trial enrollment.Even though liver biopsy is currently the clinical gold standard for diagnosing NASH and fibrosis, the alternative accurate noninvasive biomarkers might benefit more in monitoring disease progression and evaluating therapy responses. Proton density fat fraction (PDFF) has been well-accepted as a reliable biomarker for quantifying hepatic steatosis (5). 3D vector MRE-assessed liver stiffness (LS) has been demonstrated to be the most accurate noninvasive biomarkers for grading fibrosis (6) and a potential predictor for diagnosing NASH (7). T1 mapping has also been suggested as a useful biomarker in this context (8).
The aim of this study was to assess the diagnostic performance of PDFF, LS, and T1 in identifying patients with NASH and high-risk NASH.
Methods
104 patients with risk for NASH were enrolled for this study. Multiparametric MRI/MRE exams and percutaneous needle liver biopsies were performed in all patients with written informed consents. The imaging protocol contains 6-point Dixon imaging, 3D vector MRE imaging (60Hz), and T1 mapping (SMART1Map). The hepatic proton density fat fraction (PDFF) and R2* were calculated from manually drawn ROIs in 9 segments. The liver stiffness (LS) derived from 3D MRE was defined as the magnitude of the complex shear modulus (|G*|), which was calculated from volumetric ROI covering as much liver tissue with sufficient wave propagation as possible. The T1 relaxation time was measured from the SMART1Map investigational pulse sequence using a single-point, saturation-recovery (SR) fast imaging employing steady-state acquisition (FIESTA). The histological analysis of biopsy involves the grades of steatosis, inflammation and ballooning, fibrosis stages, and the diagnosis of NASH. The Dunn nonparametric multiple comparison test with Bonferroni adjustment was used to test the differences in imaging biomarkers across histological findings. Spearman correlations were used to analyze the relationships between PDFF, LS, and T1. Nominal logistic models with iterative cross-validation were used to predict NASH and high-risk NASH. The diagnostic accuracy (reported as c-statistic) of prediction models were compared by the DeLong test. A significance level of 0.05 was used.Results
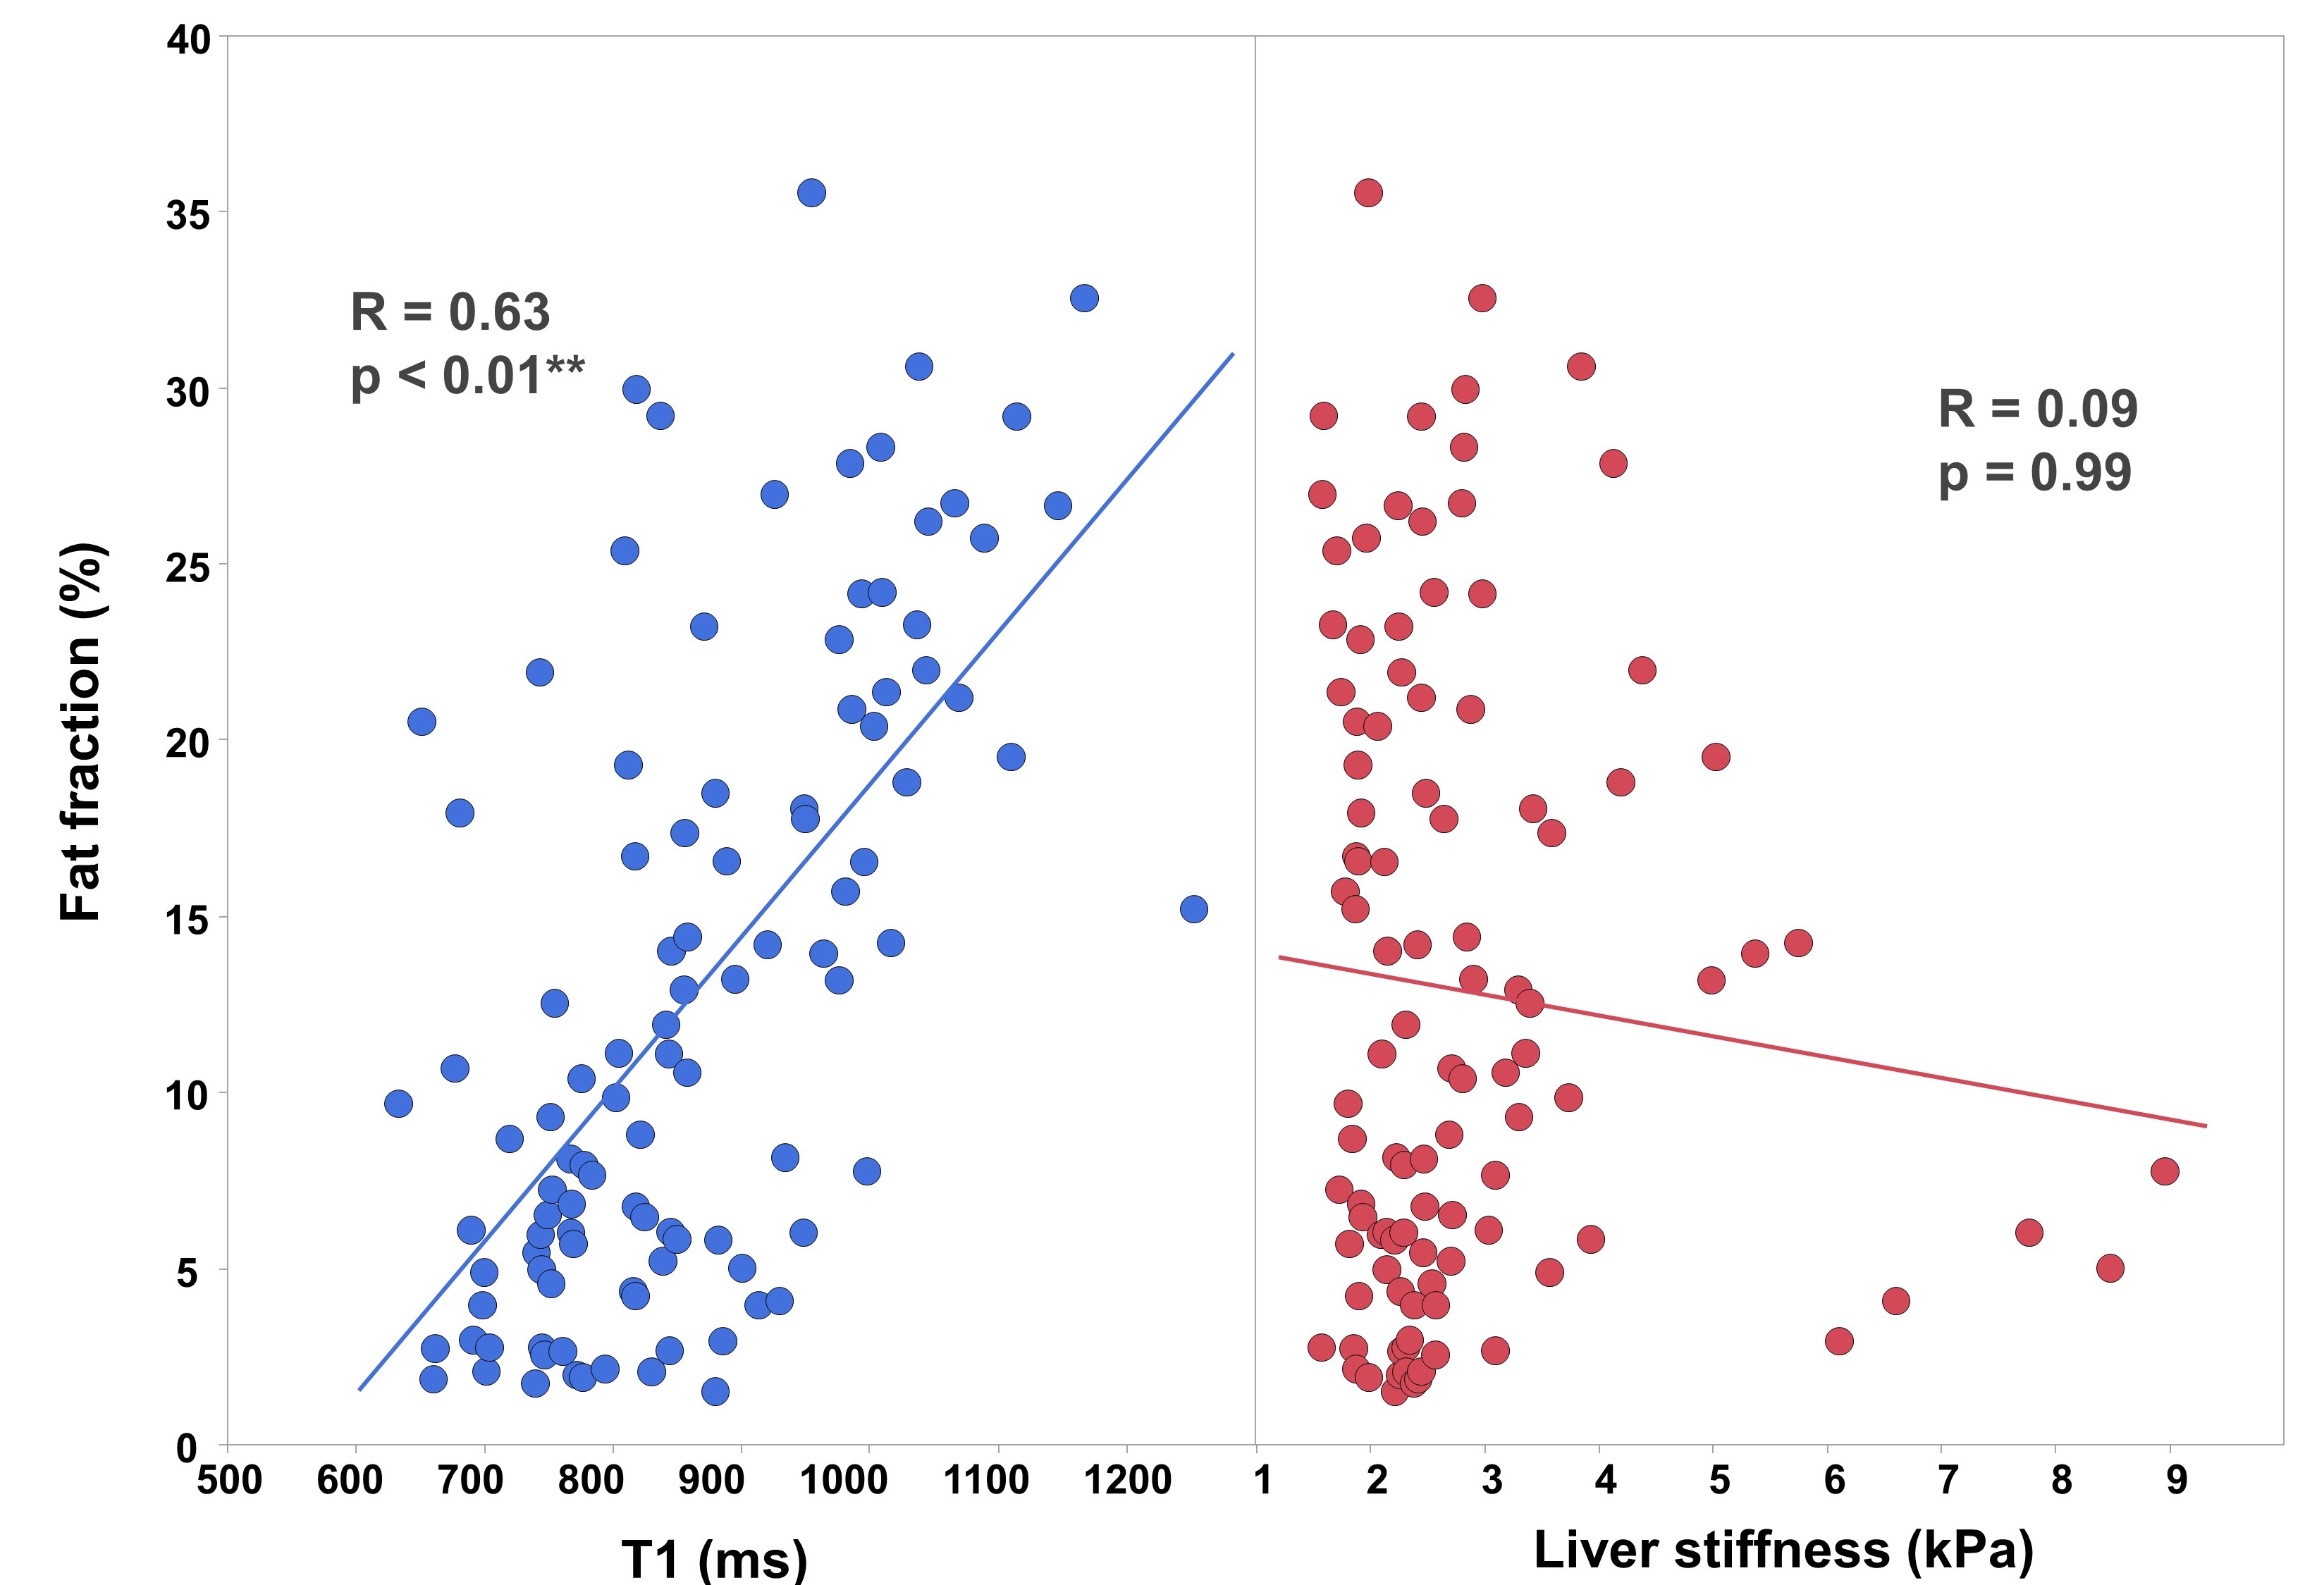
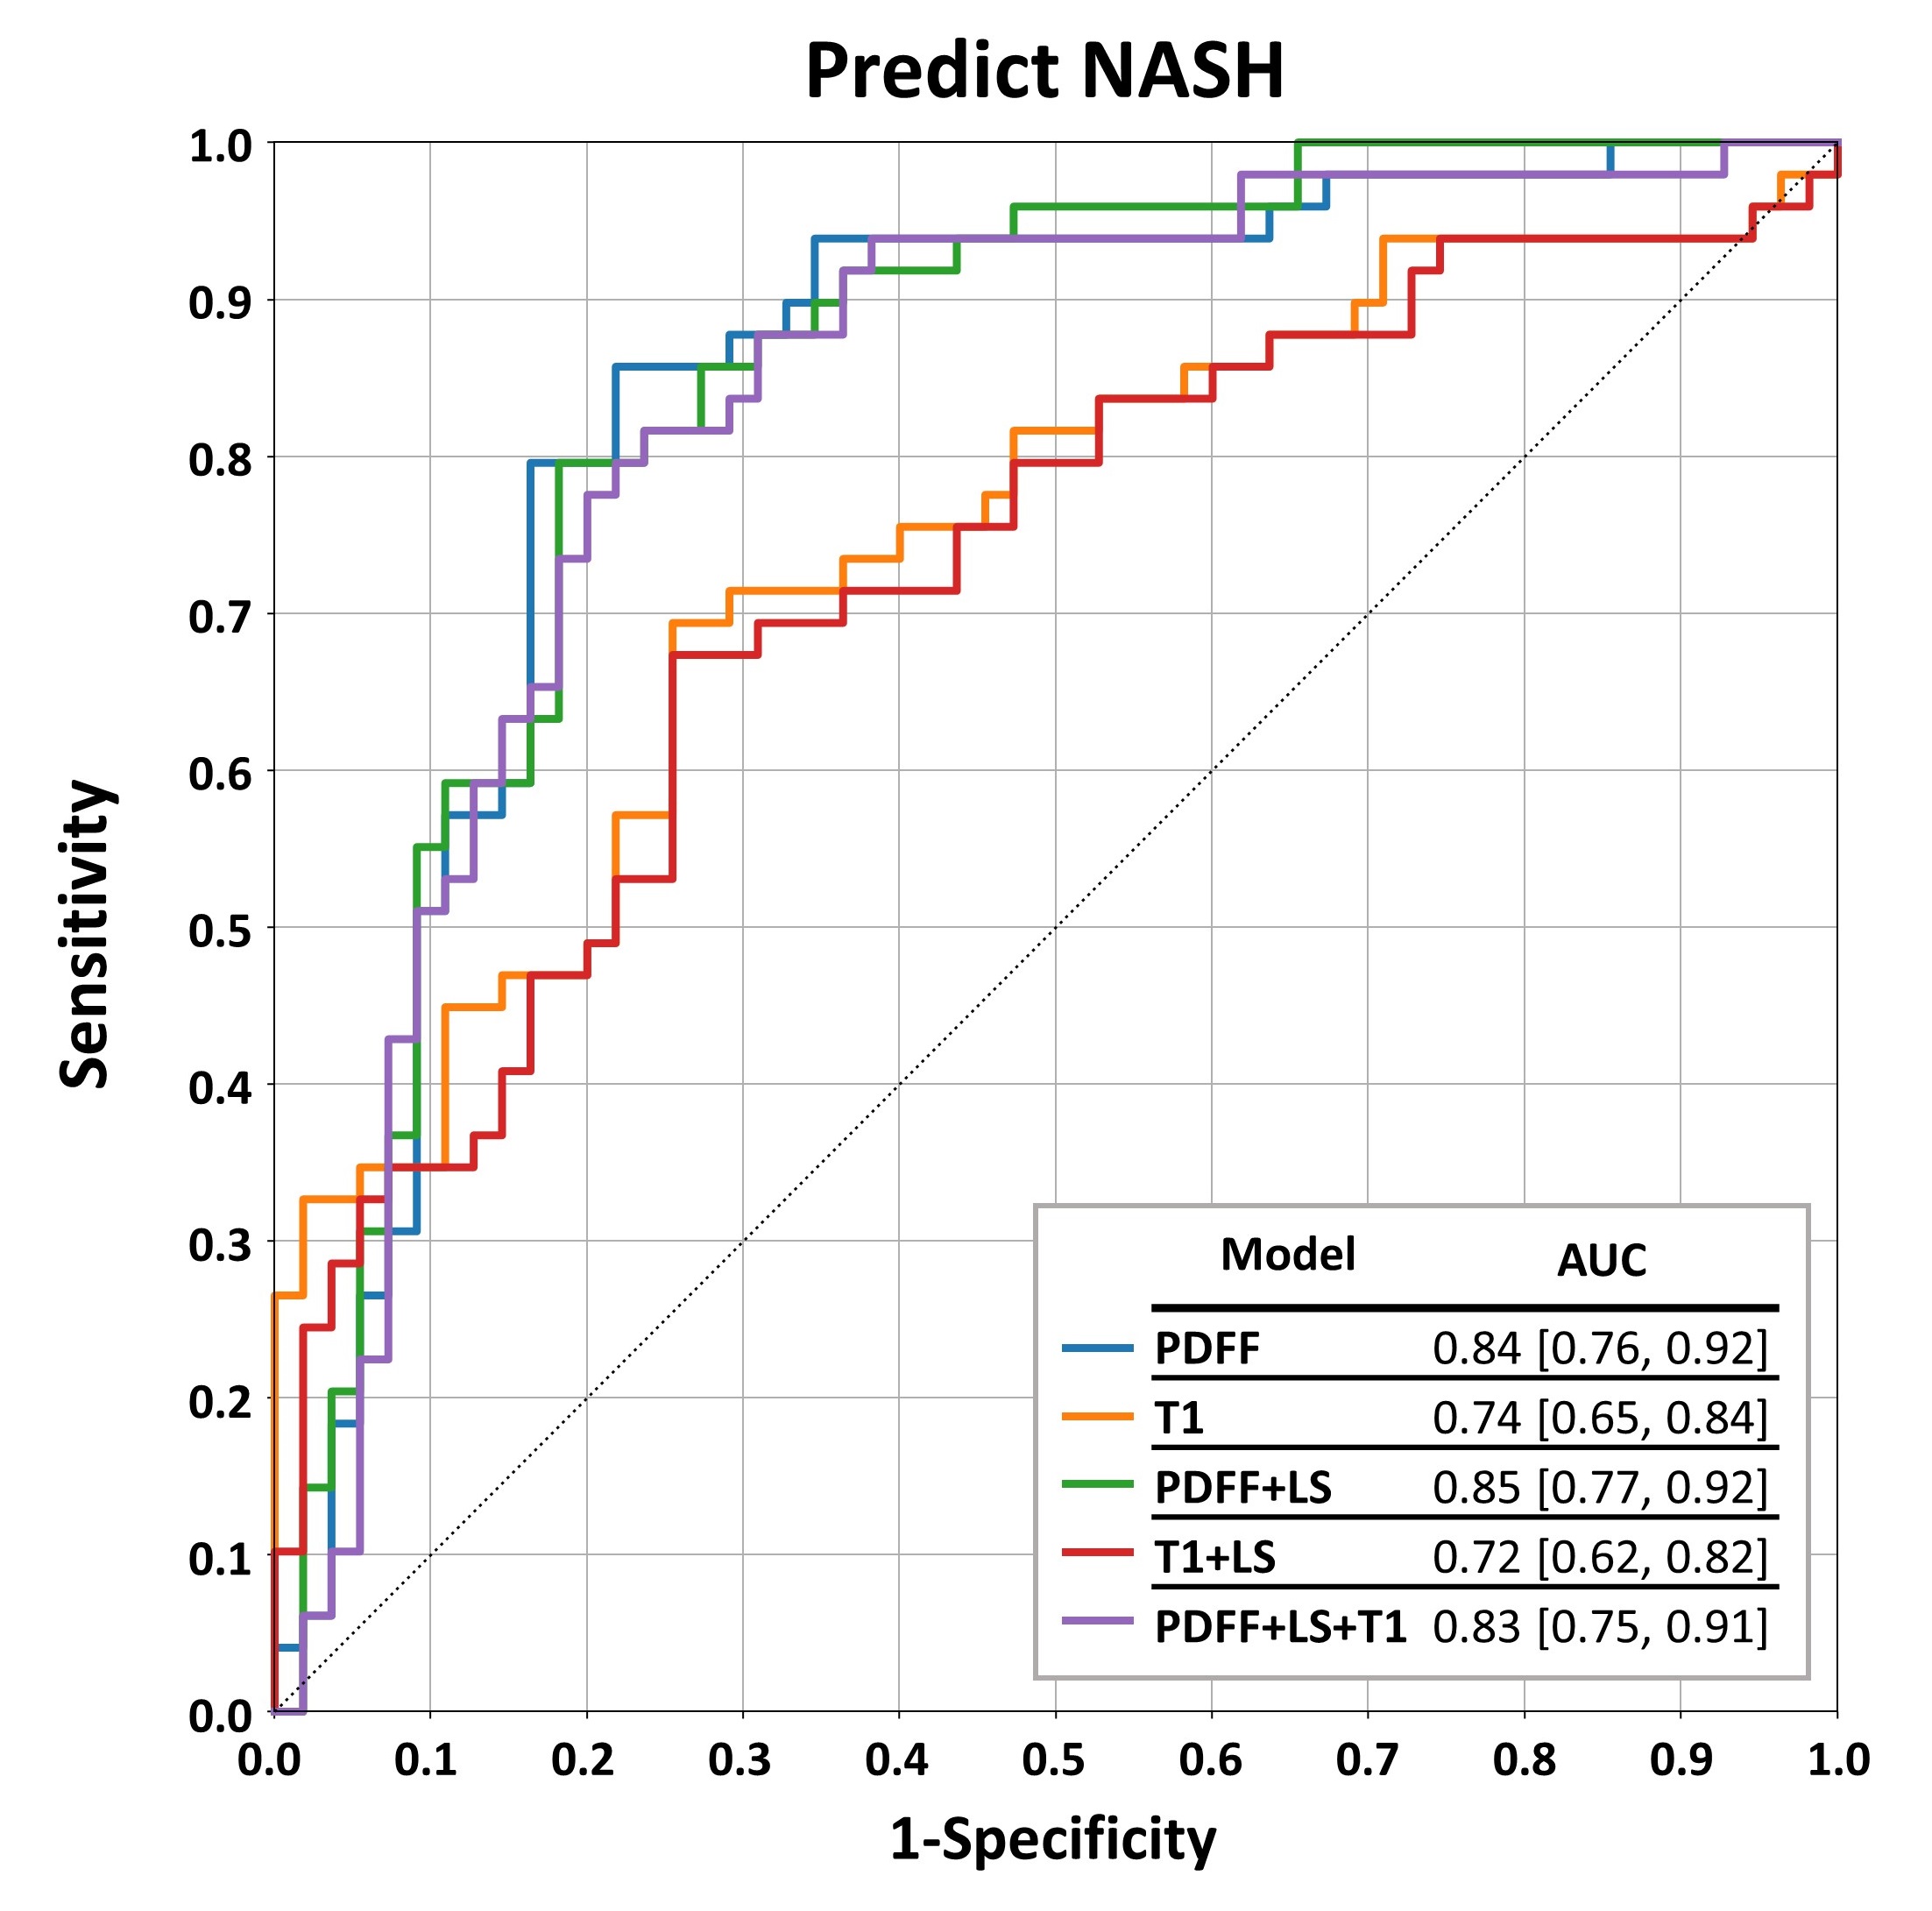
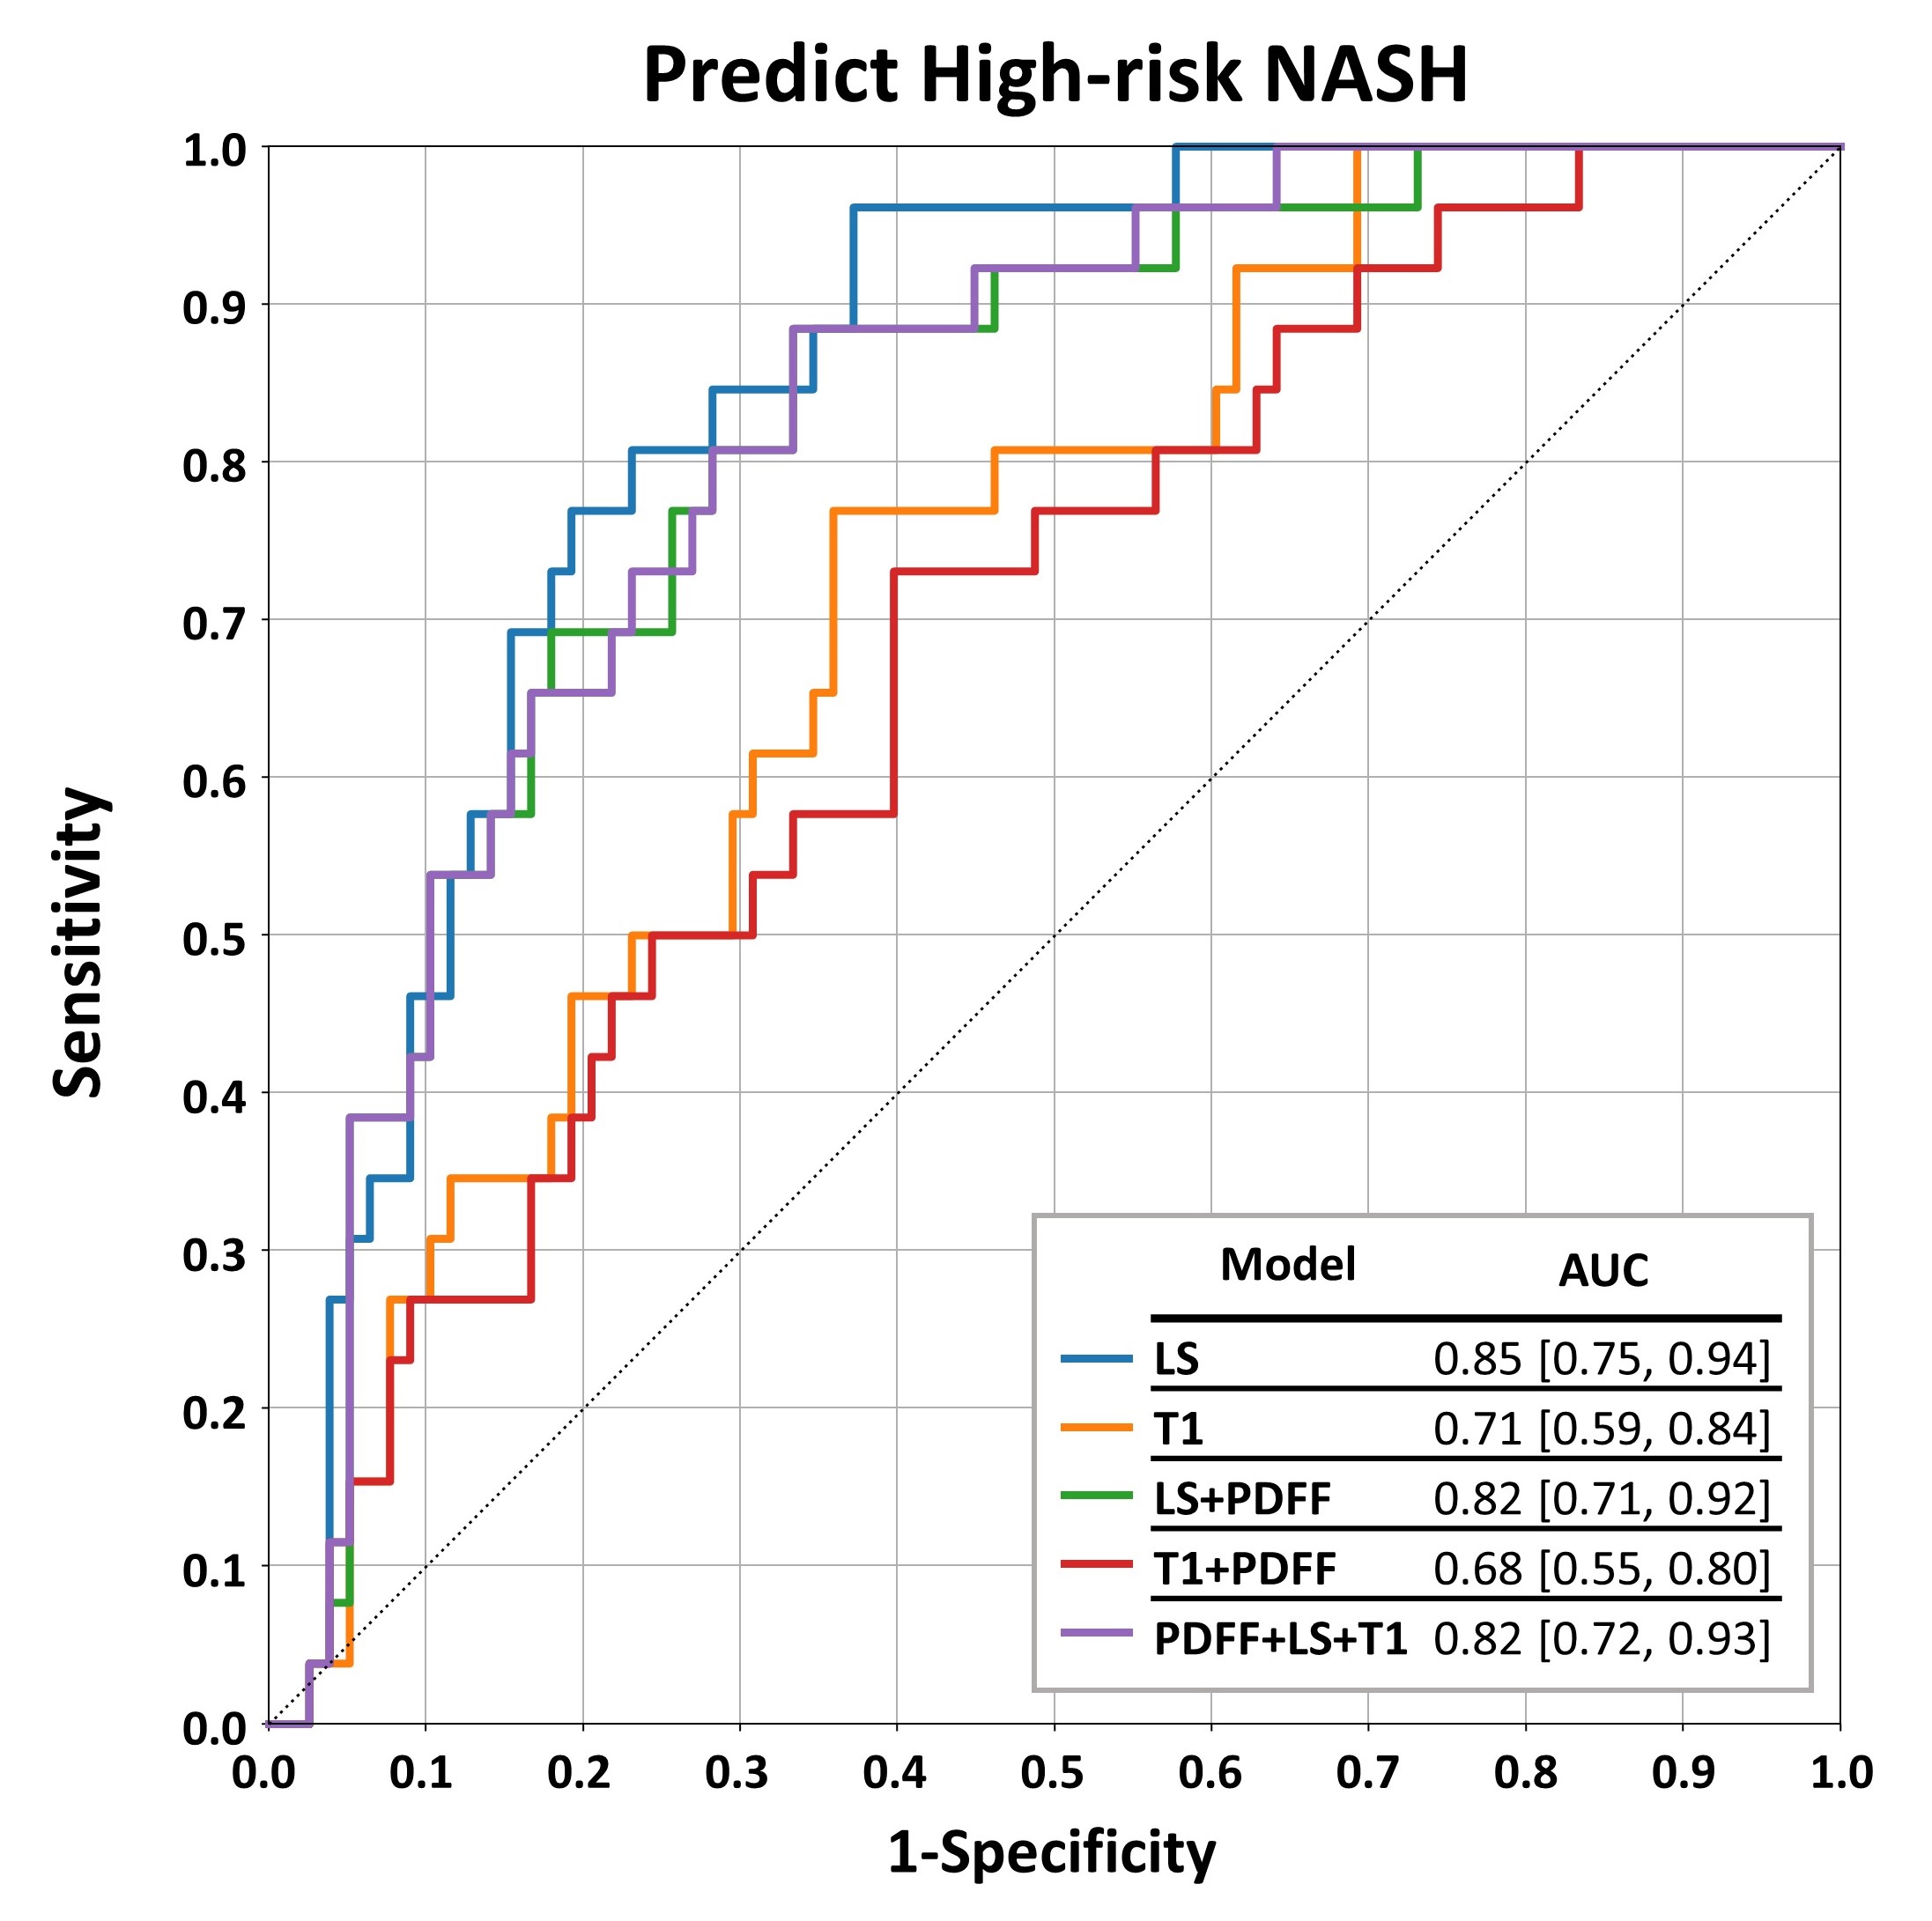
As shown in Figure 1, both PDFF and T1 showed significant increases as the severity of steatosis increased from Grade 0 to Grade 2. There was a consistent, substantial increase for Grade 3 in PDFF (Grade2 vs. Grade3: 23.4±5.1%, 28.1±4.6%, p=1.00), but a relative decrease in T1 (Grade2 vs. Grade3: 980±118ms, 967±143ms, p=1.00). Both PDFF and T1 showed significant increase in NASH patients. Figure 2 demonstrates that LS and T1 increased significantly in clinically significant Fibrosis (≥ Stage2), and patients with high-risk NASH. T1 positively correlated with PDFF, while LS did not show a significant relationship with PDFF (Figure 3). In single-parameter models, the diagnostic accuracy of PDFF is superior to T1 in identifying patients with NASH (p=0.02). However, adding LS and/or T1 in the models did not improve the c-statistic significantly (Figure 4). In contrast, the diagnostic accuracy of LS is superior to T1 in stratifying high-risk NASH patients (p=0.02). Again, there was no significant improvement in c-statistic when combined with PDFF and/or T1 in the predictive models (Figure 5).Discussion
This study tested the performance of three liver imaging biomarkers alone and in combination in the same patient cohort. Results confirmed the superior diagnostic performance of PDFF in identifying patients with NASH, and superior performance of LS in stratifying those with high-risk NASH. It has been demonstrated that the hepatic T1 relaxation time is affected by many pathophysiologic processes, including steatosis (9), inflammation (10), and fibrosis(11). The lower performance of T1 in diagnosing NASH and high-risk NASH observed in this study is likely due to signal confounders and collinearity with the other biomarkers, including PDFF. A probable factor contributing to the performance of LS in this context is that it is known to be unaffected by liver steatosis (12) and therefore serves as a complementary biomarker, orthogonal to PDFF.Conclusion
This study demonstrated that among the biomarkers evaluated, PDFF alone has high performance for identifying the presence of NASH patients, and LS alone has highest performance for in identifying NASH patients at high risk. These accurate noninvasive biomarkers would be crucial for trial enrollment.Acknowledgements
This study is funded by NIH grants EB017197 (M.Y.), EB001981(R.L.E.), DK115594 (A.M.A.), DK059615 (V.S.), and DoD grant W81XWH-19-1-0583-01 (M.Y.).References
1. Paik JM, Golabi P, Younossi Y, Srishord M, Mishra A, Younossi ZM. The Growing Burden of Disability Related to Nonalcoholic Fatty Liver Disease: Data From the Global Burden of Disease 2007-2017. Hepatology communications 2020;4(12):1769-1780. doi: 10.1002/hep4.1599
2. The global, regional, and national burden of cirrhosis by cause in 195 countries and territories, 1990-2017: a systematic analysis for the Global Burden of Disease Study 2017. Lancet Gastroenterol Hepatol 2020;5(3):245-266. doi: 10.1016/s2468-1253(19)30349-8
3. Dulai PS, Singh S, Patel J, Soni M, Prokop LJ, Younossi Z, Sebastiani G, Ekstedt M, Hagstrom H, Nasr P, Stal P, Wong VW, Kechagias S, Hultcrantz R, Loomba R. Increased risk of mortality by fibrosis stage in nonalcoholic fatty liver disease: Systematic review and meta-analysis. Hepatology 2017;65(5):1557-1565. doi: 10.1002/hep.29085
4. Kleiner DE, Brunt EM, Wilson LA, Behling C, Guy C, Contos M, Cummings O, Yeh M, Gill R, Chalasani N, Neuschwander-Tetri BA, Diehl AM, Dasarathy S, Terrault N, Kowdley K, Loomba R, Belt P, Tonascia J, Lavine JE, Sanyal AJ. Association of Histologic Disease Activity With Progression of Nonalcoholic Fatty Liver Disease. JAMA Netw Open 2019;2(10):e1912565. doi: 10.1001/jamanetworkopen.2019.12565
5. Troelstra MA, Witjes JJ, van Dijk AM, Mak AL, Gurney-Champion O, Runge JH, Zwirs D, Stols-Gonçalves D, Zwinderman AH, Ten Wolde M, Monajemi H, Ramsoekh S, Sinkus R, van Delden OM, Beuers UH, Verheij J, Nieuwdorp M, Nederveen AJ, Holleboom AG. Assessment of Imaging Modalities Against Liver Biopsy in Nonalcoholic Fatty Liver Disease: The Amsterdam NAFLD-NASH Cohort. Journal of magnetic resonance imaging : JMRI 2021. doi: 10.1002/jmri.27703
6. Singh S, Venkatesh SK, Wang Z, Miller FH, Motosugi U, Low RN, Hassanein T, Asbach P, Godfrey EM, Yin M, Chen J, Keaveny AP, Bridges M, Bohte A, Murad MH, Lomas DJ, Talwalkar JA, Ehman RL. Diagnostic performance of magnetic resonance elastography in staging liver fibrosis: a systematic review and meta-analysis of individual participant data. Clinical gastroenterology and hepatology : the official clinical practice journal of the American Gastroenterological Association 2015;13(3):440-451 e446. doi: 10.1016/j.cgh.2014.09.046
7. Allen AM, Shah VH, Therneau TM, Venkatesh SK, Mounajjed T, Larson JJ, Mara KC, Schulte PJ, Kellogg TA, Kendrick ML, McKenzie TJ, Greiner SM, Li J, Glaser KJ, Wells ML, Chen J, Ehman RL, Yin M. The Role of Three-Dimensional Magnetic Resonance Elastography in the Diagnosis of Nonalcoholic Steatohepatitis in Obese Patients Undergoing Bariatric Surgery. Hepatology 2020;71(2):510-521. doi: 10.1002/hep.30483
8. Breit HC, Block KT, Winkel DJ, Gehweiler JE, Henkel MJ, Weikert T, Stieltjes B, Boll DT, Heye TJ. Evaluation of liver fibrosis and cirrhosis on the basis of quantitative T1 mapping: Are acute inflammation, age and liver volume confounding factors? European journal of radiology 2021;141:109789. doi: 10.1016/j.ejrad.2021.109789
9. Ahn JH, Yu JS, Park KS, Kang SH, Huh JH, Chang JS, Lee JH, Kim MY, Nickel MD, Kannengiesser S, Kim JY, Koh SB. Effect of hepatic steatosis on native T1 mapping of 3T magnetic resonance imaging in the assessment of T1 values for patients with non-alcoholic fatty liver disease. Magnetic resonance imaging 2021;80:1-8. doi: 10.1016/j.mri.2021.03.015
10. Hoad CL, Palaniyappan N, Kaye P, Chernova Y, James MW, Costigan C, Austin A, Marciani L, Gowland PA, Guha IN, Francis ST, Aithal GP. A study of T₁ relaxation time as a measure of liver fibrosis and the influence of confounding histological factors. NMR in biomedicine 2015;28(6):706-714. doi: 10.1002/nbm.3299
11. Li Z, Sun J, Hu X, Huang N, Han G, Chen L, Zhou Y, Bai W, Yang X. Assessment of liver fibrosis by variable flip angle T1 mapping at 3.0T. Journal of magnetic resonance imaging : JMRI 2016;43(3):698-703. doi: 10.1002/jmri.25030
Figures
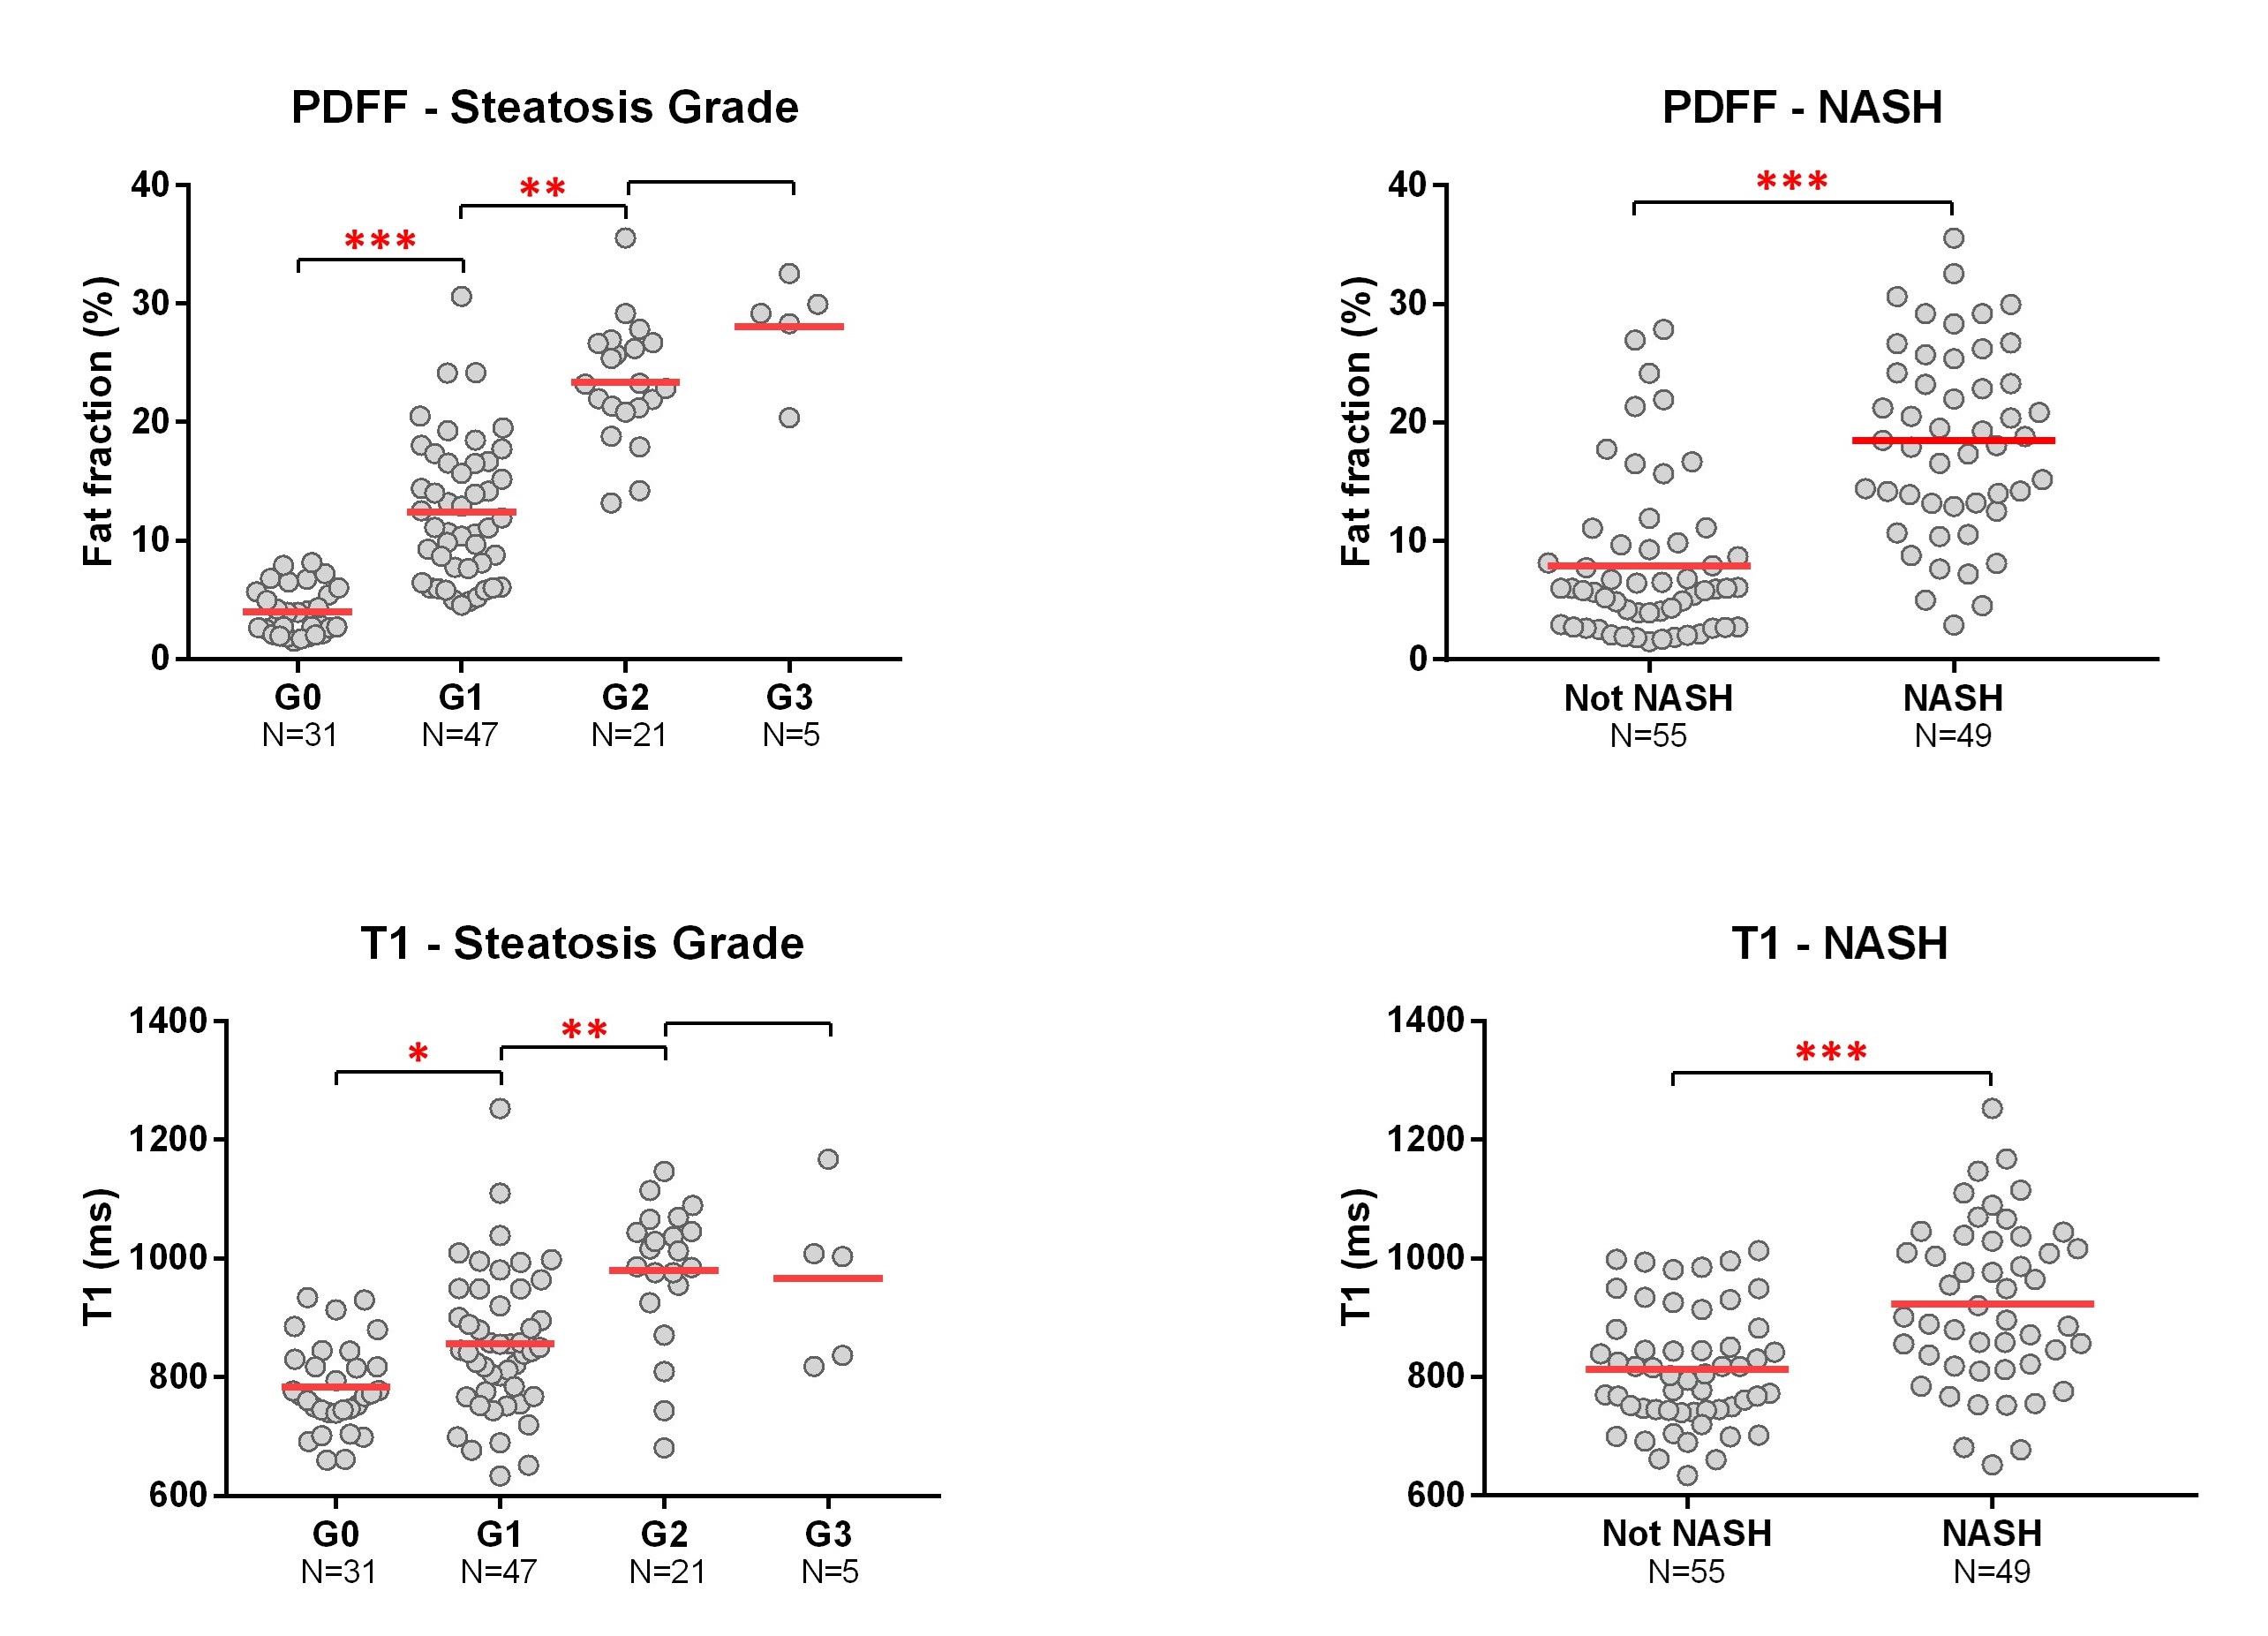
Figure 1. Performance of PDFF and T1 in diagnosing steatosis and NASH PDFF, proton density fat fraction. *: p<0.05; **: p<0.01; ***: p<0.0001.
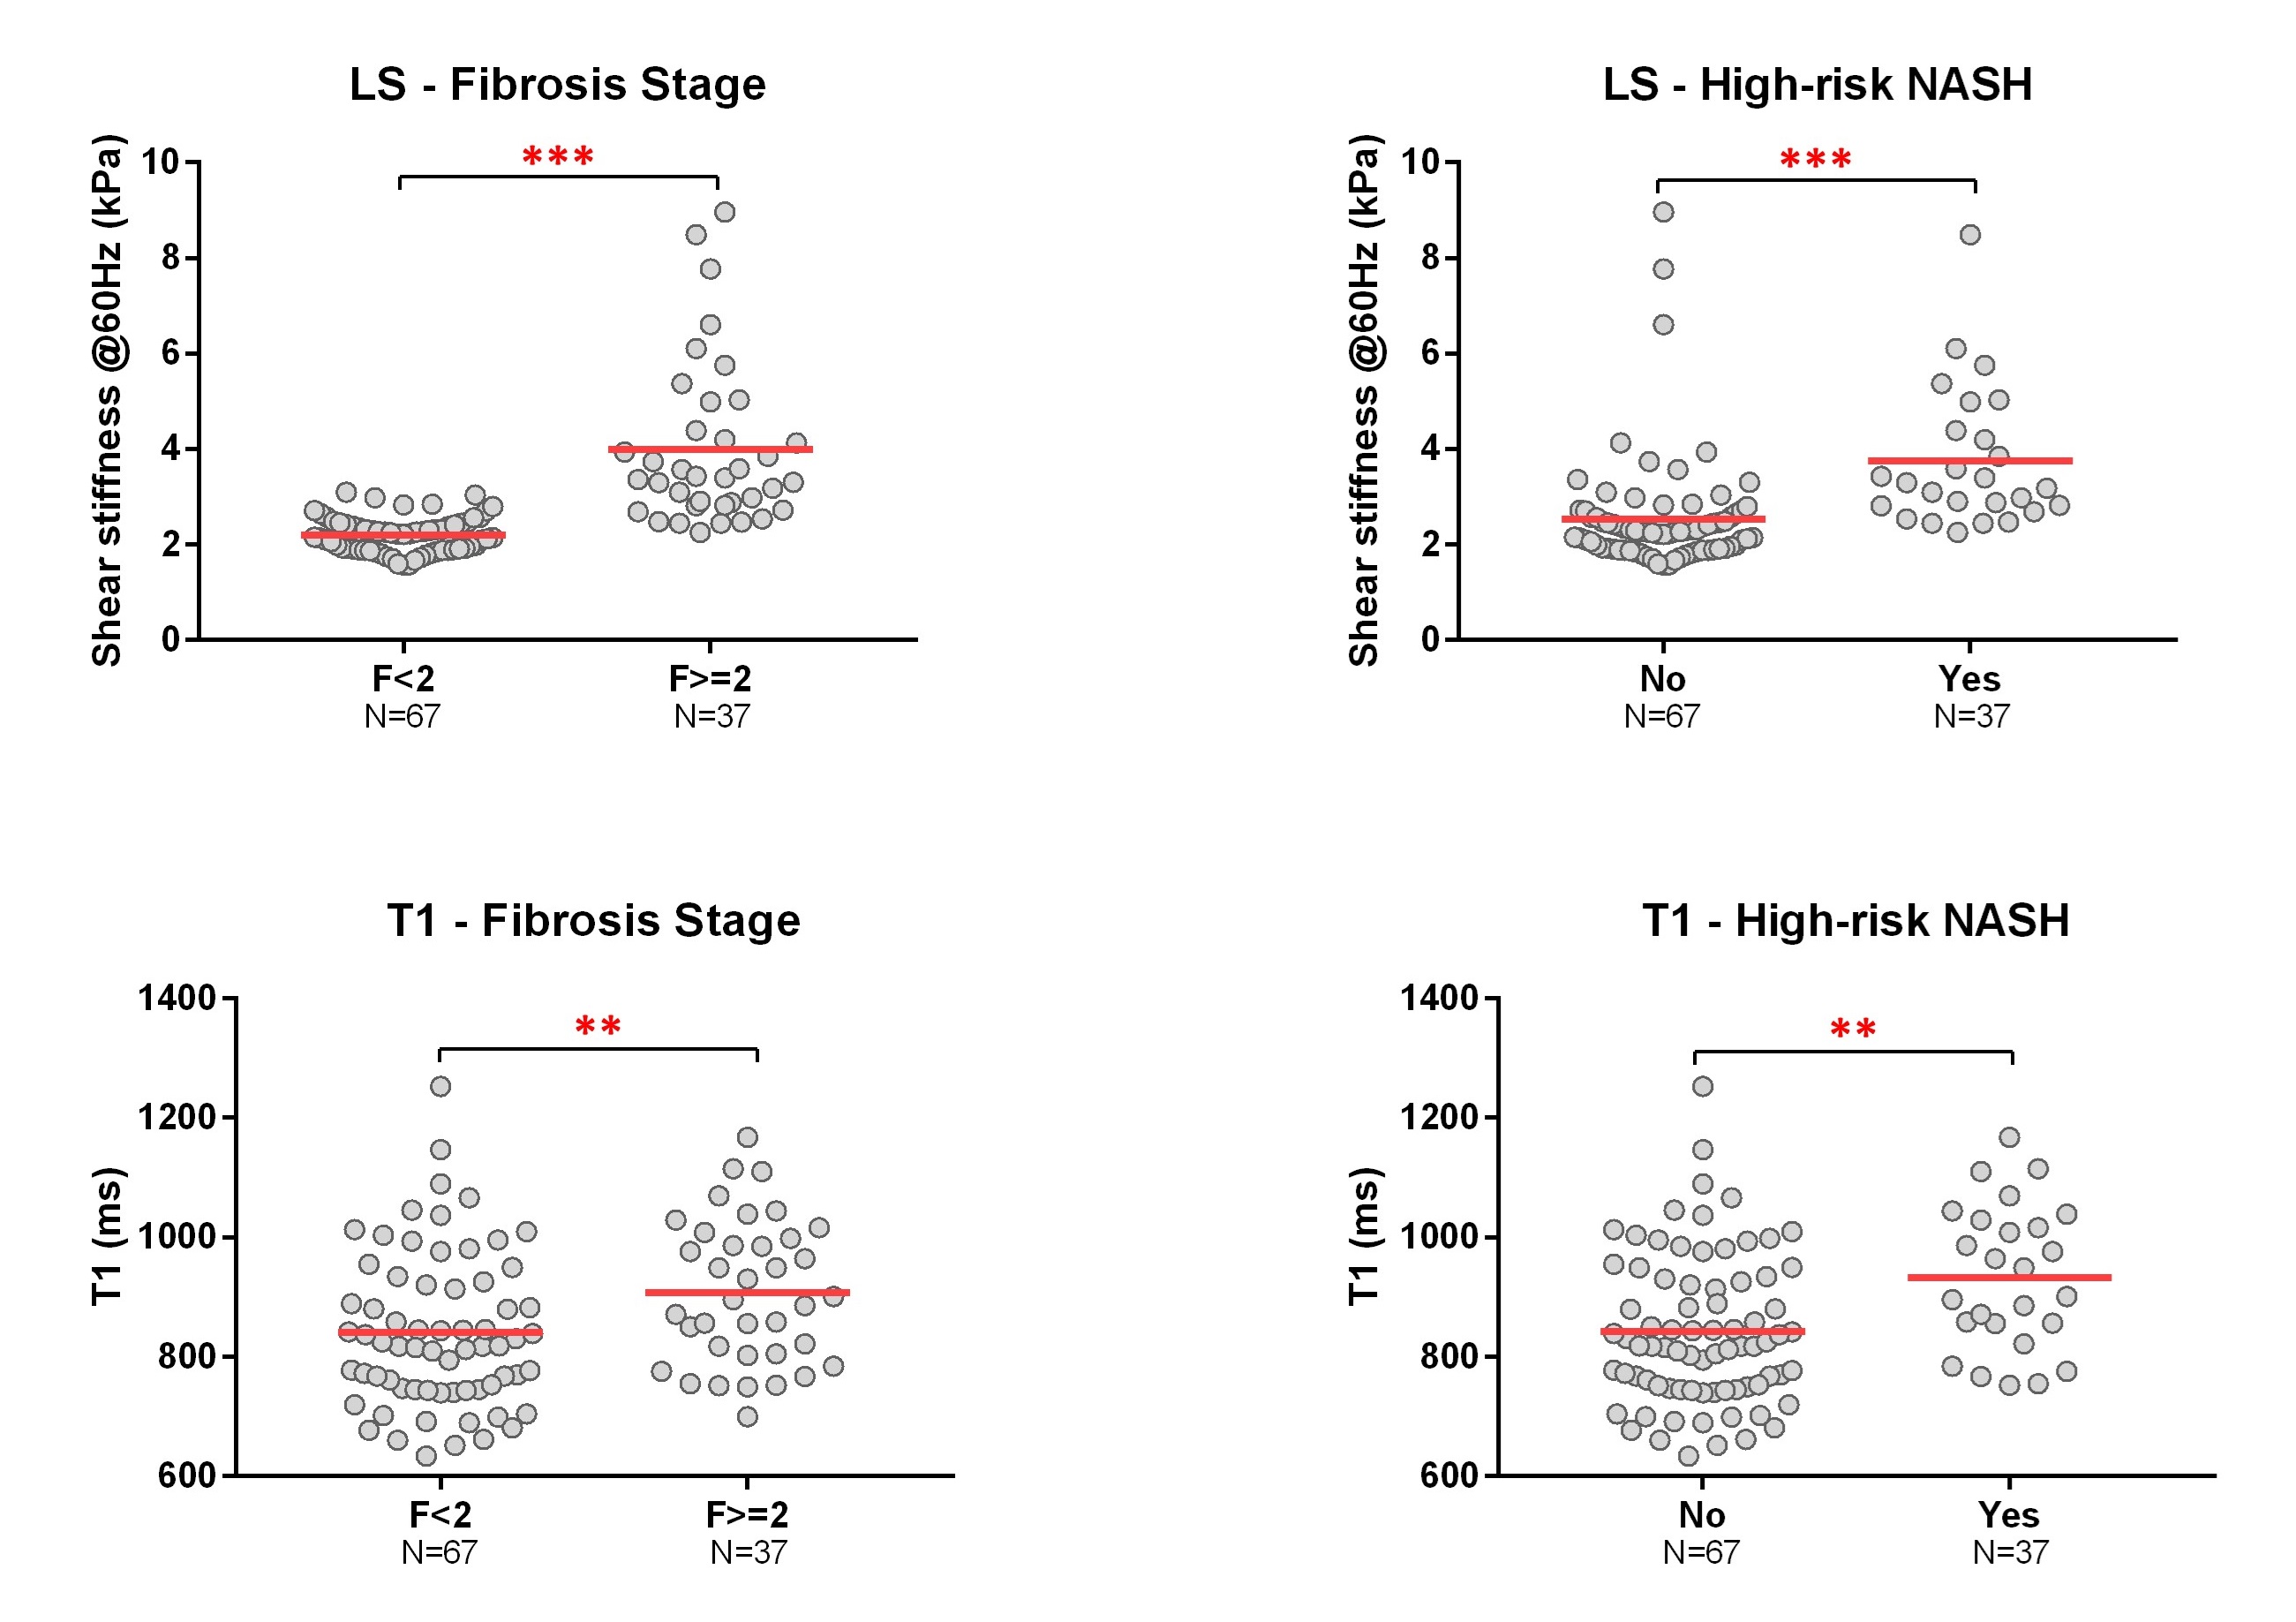
Figure 2. Performance of LS and T1 in diagnosing Fibrosis and high-risk NASH LS, liver stiffness. *: p<0.05; **: p<0.01; ***: p<0.0001.