0438
Direct parameter estimation of white matter model from DKI maps using recurrent neural network1Laboratory of Functional and Metabolic Imaging, Ecole Polytechnique Fédérale de Lausanne, Lausanne, Switzerland, 2CIBM Center for Biomedical Imaging, Lausanne, Switzerland, 3Animal Imaging and Technology, Ecole Polytechnique Fédérale de Lausanne, Lausanne, Switzerland, 4Department of Radiology, Lausanne University Hospital, Lausanne, Switzerland
Synopsis
WMTI-Watson is a widely used biophysical model that estimates microstructure parameters from the diffusion and kurtosis tensors. Here we propose a deep learning (DL) approach based on the recurrent neural network (RNN) to increase the robustness and accelerate the parameter estimation. The RNN solver achieved high accuracy, had good generality and was extremely fast in computation. The proposed DL approach is highly promising to replace the conventional nonlinear least-squares optimization in parameter estimation of WMTI-Watson model and thus estimate WM parameters from any DKI maps.
Introduction
Biophysical modelling of diffusion MRI provides specific microstructural tissue properties. Although nonlinear least-squares (NLLS) optimization is the most used method for model estimation, it suffers from local minima, high computational cost and uncertain accuracy1,2. Deep Learning (DL) approaches are replacing NL fitting, but with the limitation that the model needs to be retrained for each acquisition protocol (b-values, directions…) and noise level. The White Matter Tract Integrity (WMTI)-Watson model3 was proposed as an implementation of the Standard Model that estimates parameters from the diffusion and kurtosis tensors (DKI), thereby overcoming fitting the model signal equation. Here we propose a DL approach based on the recurrent neural network (RNN) to increase the robustness and accelerate the parameter estimation of WMTI-Watson. This RNN has the advantage of being more readily translatable to other datasets, irrespective of acquisition protocol, provided DKI was pre-computed from the data. We compared the NLLS and RNN methods both in synthetic and two independent datasets of rat brain in vivo, in terms of estimation accuracy and precision.Methods
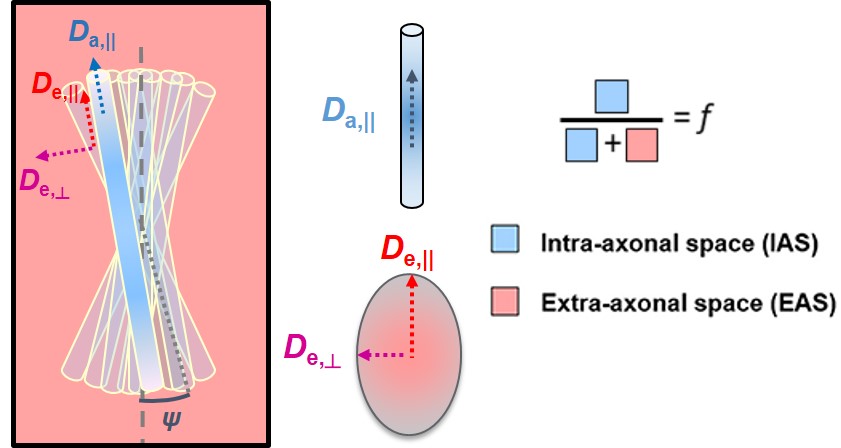
WMTI-Watson model description is provided in Fig. 1. It consists of 5 parameters that are directly derived from tensor metrics: mean/axial/radial diffusivities (md/ad/rd) and mean/axial/radial kurtosis (mk/ak/rk).Experimental: All experiments were approved by the local Service for Veterinary Affairs. Eight male Wistar rats were scanned on a 14T Bruker system with a home-built surface coil. Diffusion MRI images were acquired using a PGSE-EPI sequence. Dataset1 (N=7) was acquired with parameters: 4 b=0 and 3 b-shells b=0.8/1.3/2 ms/μm2 with 12/16/30 directions; δ/Δ=4/27 ms; TE/TR=48/2500 ms, resolution: 0.18x0.27x1 mm3. Dataset2 (N=1) was acquired with parameters: 3 b=0 and 2 shells b=1/2.5ms/μm2 with 24 directions per shell; δ/Δ=4.5/11 ms; TE/TR=58/3000 ms, resolution: 0.25x0.25x0.8 mm3. Images were denoised5, Gibbs-ringing corrected6 and EDDY-corrected7. Diffusion and kurtosis tensors were calculated8 and the WMTI-Watson model was estimated using NLLS for voxels in corpus callosum, cingulum and fimbria which were automatically segmented using atlas-based registration. Finally, voxels were filtered to retain WM only: fractional anisotropy (FA) > 0.25.
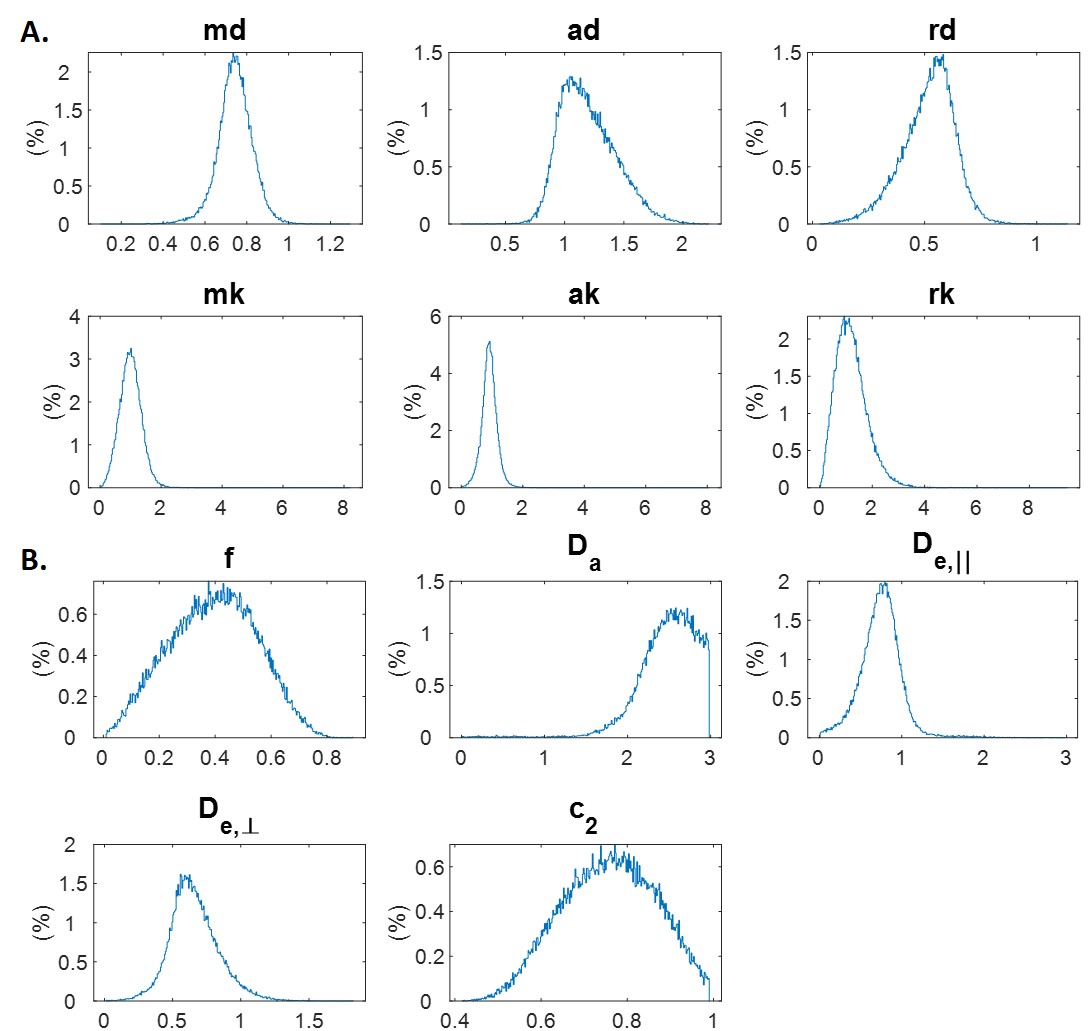
Simulations: Synthetic WMTI-Watson parameters (f, $$$D_a$$$, $$$D_{e,∥}$$$, $$$D_{e,⊥}$$$, $$$c_2$$$) were generated as the ground truth by sampling from the parameter distributions in the filtered experimental dataset (Fig.3B). Then synthetic diffusion and kurtosis metrics (md, ad, rd, mk, ak, rk) were calculated from the WMTI-Watson parameters3. The total synthetic dataset was split into 4 subsets: training, validation, test and evaluation, with 3M, 1M, 1M and 600k samples, respectively.
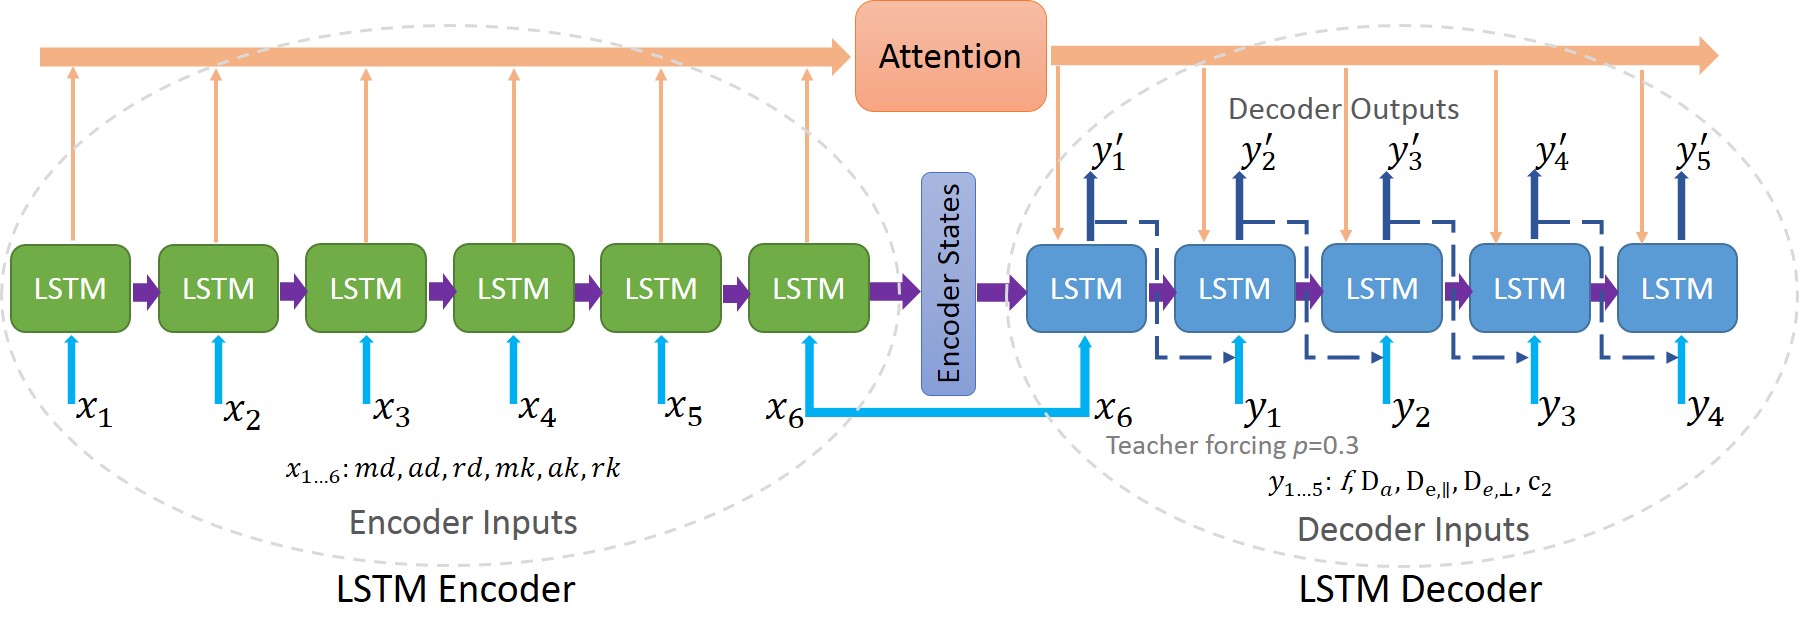
Network implementation: Since in this fitting problem 5 parameters were to be estimated from 6 inputs, it could be treated as a sequence-to-sequence prediction problem. We therefore proposed a DL network based on the RNN encoder-decoder architecture9 with diffusion and kurtosis metrics as the input sequence and the WMTI-Watson parameters as the output sequence (Fig.2).
Model fitting: The RNN network was first trained on the synthetic datasets and tested on a separate synthetic evaluation set. Further, it was tested on an experimental dataset (Dataset1) where the synthetic data distributions were drawn from, and validated on an independent dataset (Dataset2), where tensor metrics had been estimated from different acquisition protocols. To compare the RNN network and NLLS, NLLS were also applied on the synthetic evaluation set and two experimental datasets.
Results and Discussion
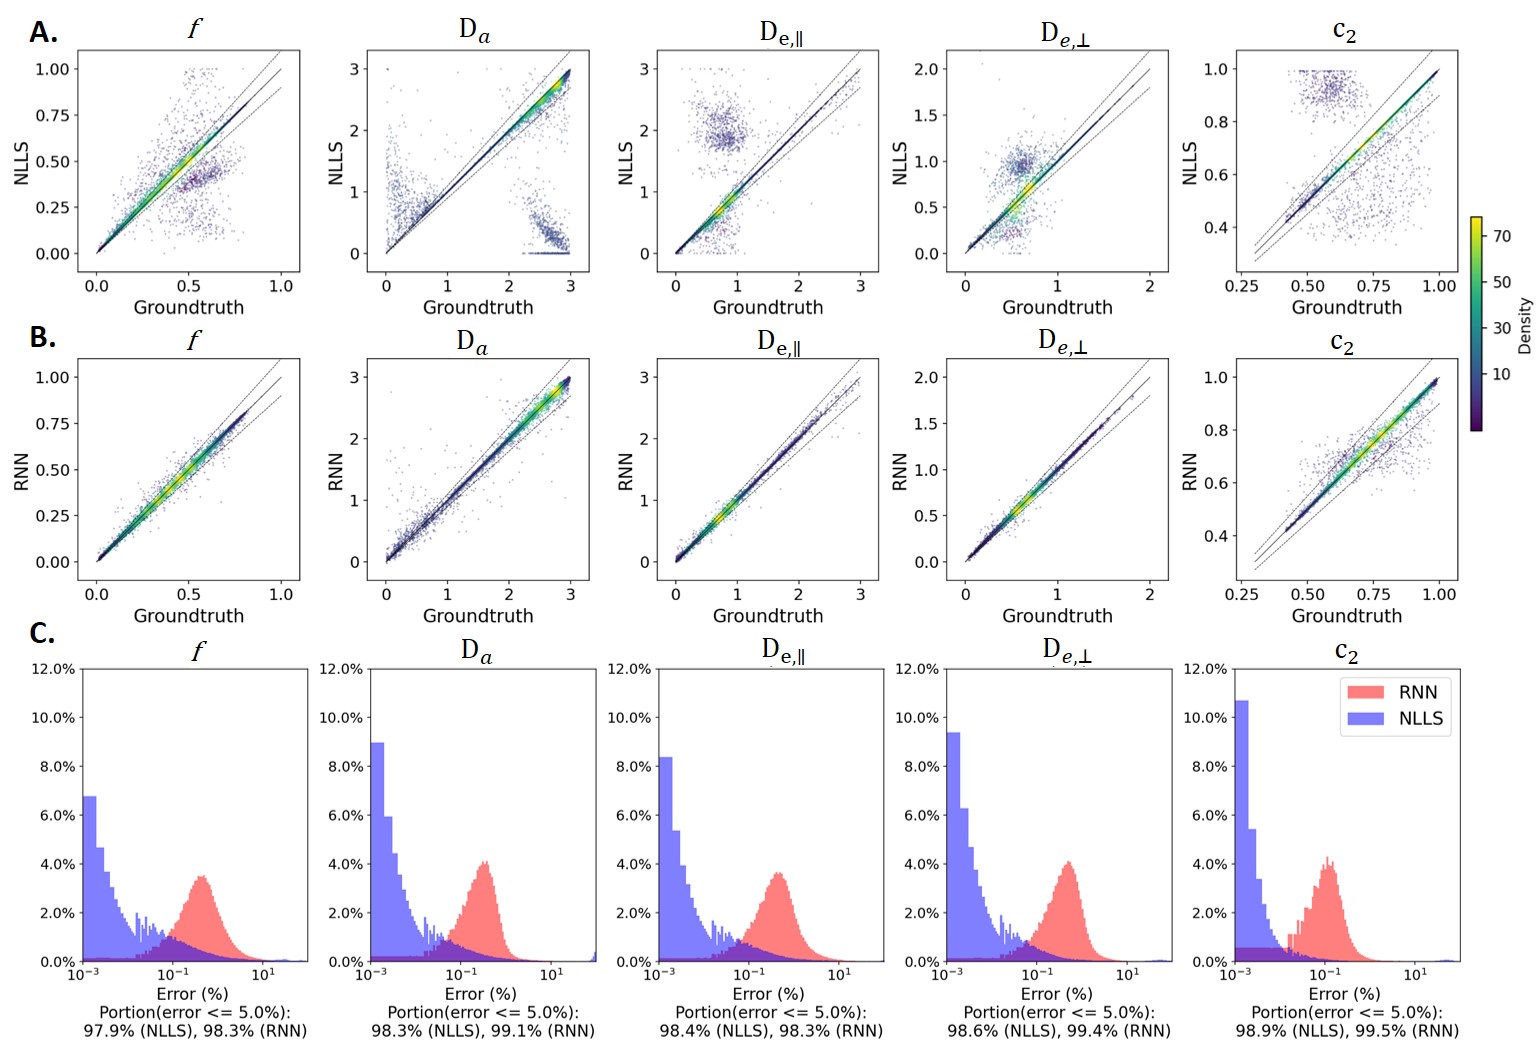
Figure 3 shows distributions of DKI tensor metrics and WMTI-Watson model parameters in the WM voxels of experimental dataset1.In the synthetic evaluation dataset, NLLS estimation displayed multiple off-diagonal clusters for each parameter indicating convergence to local minima or hitting admitted parameter bounds (Fig. 4A). On the other hand, the error distributions (Fig. 4C) show NLLS achieved a high accuracy with ~97% of trials having an error < 5% for all parameters.
RNN performance on the same dataset was more robust with fewer outliers (Fig. 4B) and ~ 98% of trials with an error < 5% (Fig. 4C).
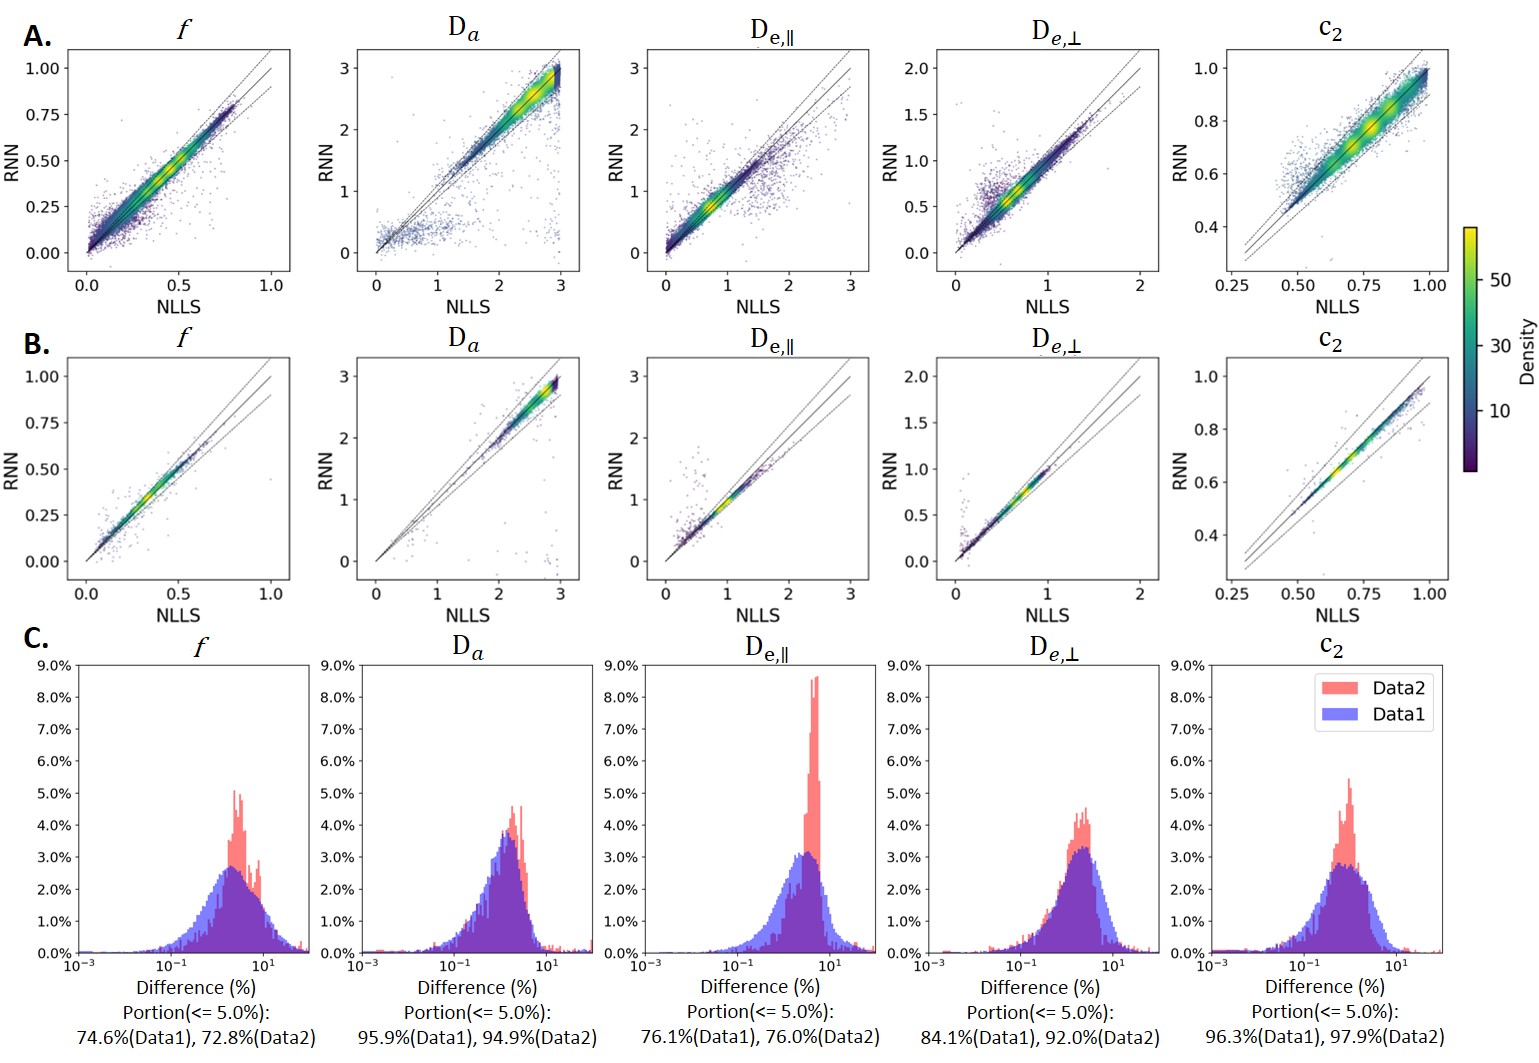
Remarkably, RNN and NLLS reached high agreement (~ 80% for f,$$$D_{e,∥}$$$ and $$$D_{e,⊥}$$$, and ~ 95% for $$$D_a$$$ and $$$c_2$$$) not only on experimental dataset1 used to create distributions for the synthetic training data but also on an independent dataset2 acquired in different conditions (Fig. 5). It suggests that the RNN model has a good generality to different datasets.
Importantly, NLLS took 88 hours to estimate 600K data points while the RNN model only took 20 seconds on the same machine (4 cores). The RNN network showed great advantage over NLLS in computation time.
Conclusion
Derived from diffusion and kurtosis tensor metrics which are linearly estimated from signal, WMTI-Watson is widely usable model. However, its parameter estimation using NLLS is either extremely time consuming or suffers from degeneracy due to local minima. RNN network-based solver instead achieved high agreement with ground-truth targets in synthetic data, showed good model translatability to new datasets and more importantly showed 104 times faster computation while suffering less from degeneracy. In conclusion, the proposed RNN is highly promising to replace NLLS in parameter estimation of WMTI-Watson model and thus estimate WM parameters from any DKI maps. The applicability to human DKI data without retraining will be assessed in future work.Acknowledgements
The authors thank Catarina Tristao Pereira for contributing code for WM ROI segmentation and acknowledge access to the facilities and expertise of the CIBM Center for Biomedical Imaging, a Swiss research center of excellence founded andsupported by Lausanne University Hospital (CHUV), University of Lausanne (UNIL), Ecole polytechnique fédérale de Lausanne (EPFL), University of Geneva (UNIGE) and Geneva University Hospitals (HUG).
References
1. Jelescu, I. O., Veraart, J., Fieremans, E. & Novikov, D. S. Degeneracy in model parameter estimation for multi-compartmental diffusion in neuronal tissue. NMR in biomedicine 29, 33 (2016).
2. Harms, R. L., Fritz, F. J., Tobisch, A., Goebel, R. & Roebroeck, A. Robust and fast nonlinear optimization of diffusion MRI microstructure models. NeuroImage 155, 82–96 (2017).
3. Jespersen, S. N., Olesen, J. L., Hansen, B. & Shemesh, N. Diffusion time dependence of microstructural parameters in fixed spinal cord. NeuroImage 182, 329–342 (2018).
4. Jelescu, I. O. & Budde, M. D. Design and Validation of Diffusion MRI Models of White Matter. Front. Phys. 5, (2017).
5. Veraart, J., Fieremans, E. & Novikov, D. S. Diffusion MRI noise mapping using random matrix theory: Diffusion MRI Noise Mapping. Magn. Reson. Med. 76, 1582–1593 (2016).
6. Kellner, E., Dhital, B., Kiselev, V. G. & Reisert, M. Gibbs-ringing artifact removal based on local subvoxel-shifts. Magnetic Resonance in Medicine 76, 1574–1581 (2016).
7. Andersson, J. L. R. & Sotiropoulos, S. N. An integrated approach to correction for off-resonance effects and subject movement in diffusion MR imaging. NeuroImage 125, 1063–1078 (2016).
8. Veraart, J., Sijbers, J., Sunaert, S., Leemans, A. & Jeurissen, B. Weighted linear least squares estimation of diffusion MRI parameters: Strengths, limitations, and pitfalls. NeuroImage 81, 335–346 (2013).
9. Cho, K. et al. Learning Phrase Representations using RNN Encoder-Decoder for Statistical Machine Translation. arXiv:1406.1078 [cs, stat] (2014).
10. Vaswani, A. et al. Attention Is All You Need. arXiv:1706.03762 [cs] (2017).
Figures