0437
Diffusion MRI data analysis using brain segmentation from anatomical images synthesized from diffusion data by deep learning (DeepAnat)1Wellcome Centre for Integrative Neuroimaging, FMRIB, Nuffield Department of Clinical Neurosciences, University of Oxford, Oxford, United Kingdom, 2Athinoula A. Martinos Center for Biomedical Imaging, Department of Radiology, Massachusetts General Hospital, Boston, MA, United States, 3Harvard Medical School, Boston, MA, United States, 4Department of Biomedical Engineering, Tsinghua University, Beijing, China
Synopsis
The analysis of diffusion MRI data requires brain segmentation from separate anatomical images, which may be unavailable or cannot be accurately co-registered to diffusion images due to image distortions in diffusion data. Two state-of-the-art convolutional neural networks, U-Net and generative adversarial network (GAN), are employed to synthesize high-quality, distortion-matched T1w images directly from diffusion data, suitable for generating accurate cerebral cortical surfaces and volumetric segmentation for surface-based analysis of DTI metrics and tractography. The accuracy is quantitatively evaluated, and the systematical comparison shows that GAN-synthesized images are more visually appealing while U-Net-synthesized images achieve higher data consistency and segmentation accuracy.
Introduction
Diffusion MRI is useful for mapping the tissue microstructure and structural connectivity noninvasively. Many analyses of diffusion data, such as region-of-interest specific quantification, tractography, and surface-based analysis, require brain segmentation and cortical surfaces from additional co-registered high-resolution anatomical MRI data, which might be unacquired or unavailable. Furthermore, to accurately co-register the diffusion and anatomical data with substantially different image resolution and contrast, specialized sequences1 or additional data (e.g., images with reversed phase-encoding direction2-4) are required to correct susceptibility-induced geometric distortions in the diffusion data, which are also often unavailable.Prior works proposed to synthesize T1w images from diffusion images using inverse contrast normalization5 or Bloch simulations based on tissue volume fractions derived from diffusion data6, or reconstruct cortical surfaces directly from diffusion data7. However, the performance of these methods is limited due to the complex nonlinear mapping between diffusion and anatomical images and their inability to correct image artifacts and improve the low resolution of diffusion data.
To address this, we propose to leverage convolutional neural networks (CNNs) that have demonstrated superiority in image-to-image translation8-11. We synthesize T1w images from diffusion images using two state-of-the-art CNNs, i.e., U-Net12,13 and generative adversarial network (GAN)14, and systematically quantify the accuracy of cortical surfaces and volumetric segmentation derived from synthesized images. Finally, we demonstrate the value of our method in surface-based analysis of DTI metrics and tractography.
Methods
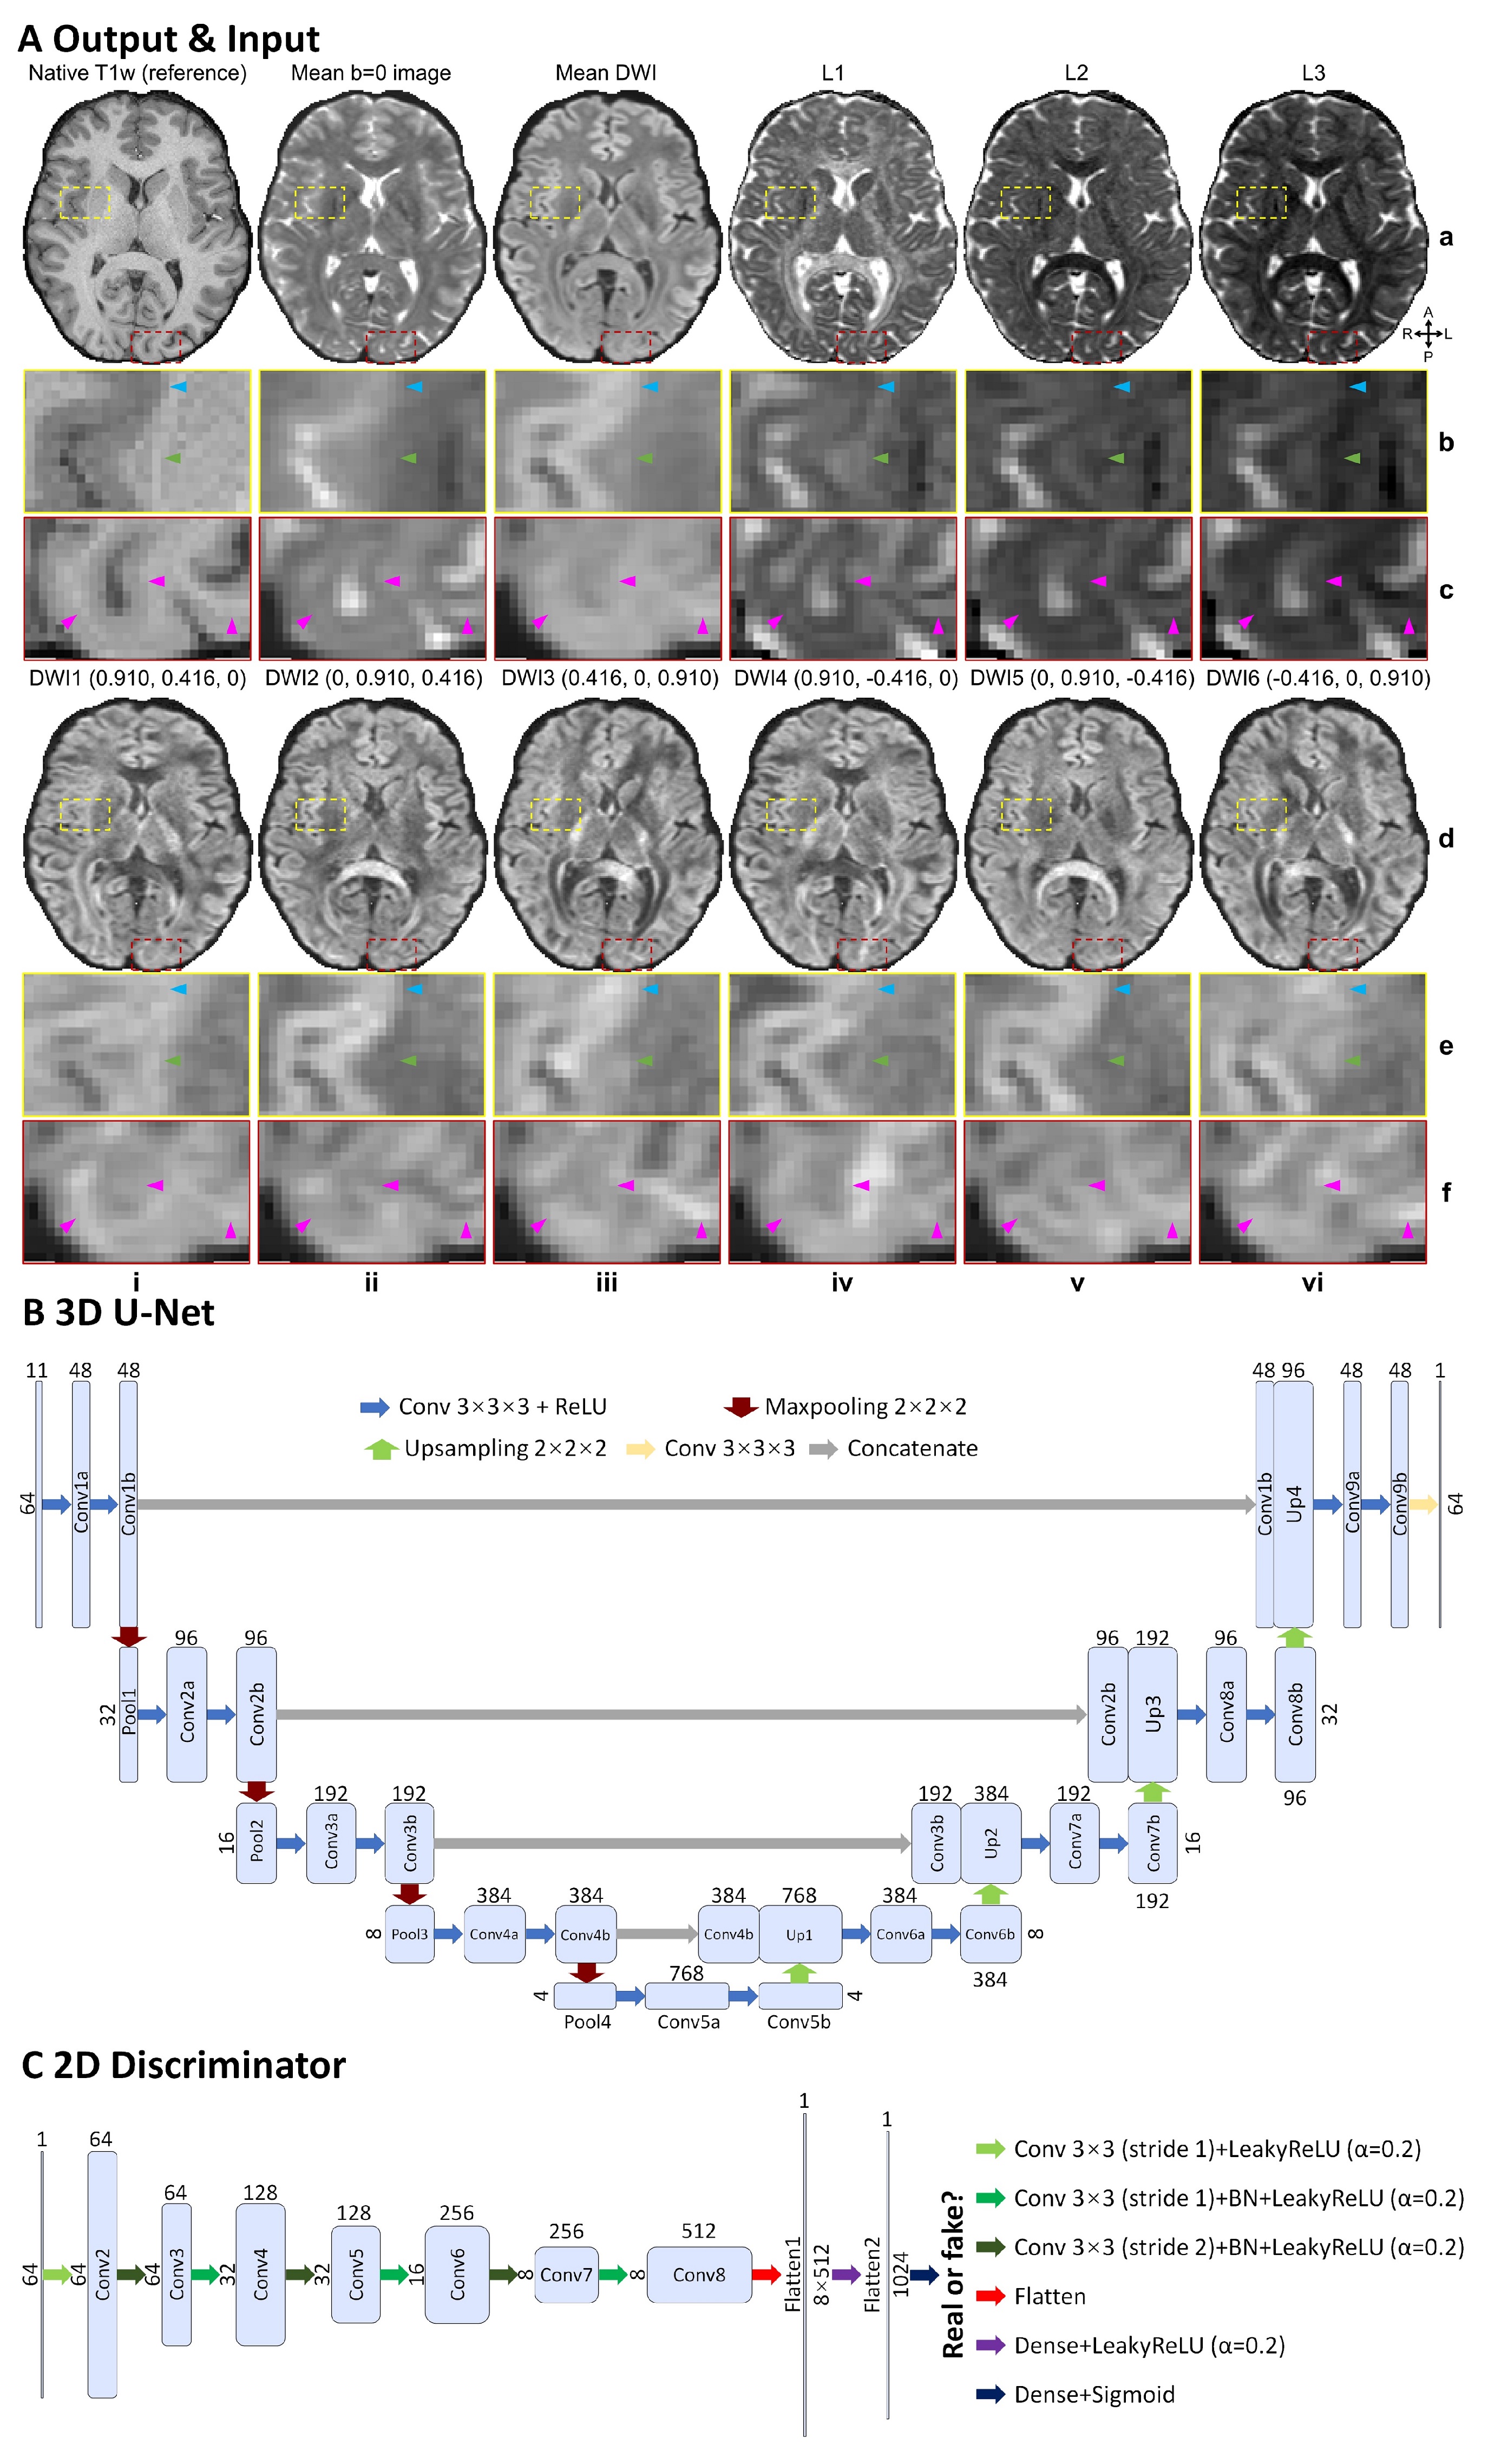
Data. Pre-processed and co-registered diffusion (1.25-mm isotropic) and T1w (0.7-mm isotropic) data of 60 subjects from the Human Connectome Project were used15,16. To mimic a common acquisition protocol, T1w images were re-sampled to 1-mm isotropic resolution and three b=0 and 30 DWI volumes were used (up-sampled to 1-mm isotropic resolution). DTI tensors and metrics were derived using FSL’s “dtifit” function.Networks. CNN input includes: mean b=0 and mean DWI volumes, three volumes of tensor eigenvalues (L1, L2, L3), six DWI volumes along optimal diffusion-encoding directions17 computed from tensors which preserved angular information and high gray-white contrast (Fig. 1A arrows). CNN output is a distortion-matched, co-registered T1w volume (Fig. 1A).
A 3D U-Net12 (Fig. 1B) and a hybrid GAN14 were used to map diffusion images to T1w images. The hybrid GAN consists of a 3D U-Net as the generator (Fig. 1B) and a 2D discriminator from SRGAN18 (Fig. 1C) that distinguishes synthesized 2D T1w images from real images, embracing superior image synthesis performance from the 3D generator while only requiring moderate amount of training data14.
CNNs were implemented using the Keras API with a Tensorflow backend. Training and validation were performed on 64×64×64 image blocks from 40 subjects using an Adam optimizer to minimize the mean squared error (MSE) for U-Net, and a weighted summation of MSE and adversarial loss (1:0.001) for GAN.
Evaluation. Results were evaluated on 20 subjects unseen during training. Cortical surface reconstruction and volumetric segmentation were performed using FreeSurfer19-22. The similarity between synthesized and native images were quantified using MSE and VGG18,23 perceptual loss. The FreeSurfer longitudinal pipeline24-26 was used to quantify the discrepancies between surface positioning and cortical thickness estimation from synthesized and native images27,28. Dice coefficients between segmented regions (“aparc+aseg” results) from synthesized and native images were computed. The correlation between whole-brain vertex-wise thickness estimates of each subject from synthesized and native images, and between segmented volumes across subjects from synthesized and native images were computed.
Analysis. DTI metrics were projected to mid-gray surfaces. Probabilistic tractography was performed with thalamus as “seed”, ipsilateral white matter of precentral gyrus as “target”, corpus callosum as “avoiding mask” using provided “bedpostx”29,30 fiber orientation estimates and FSL’s “probtrackx2” function for tracking the thalamocortical radiation31.
Results
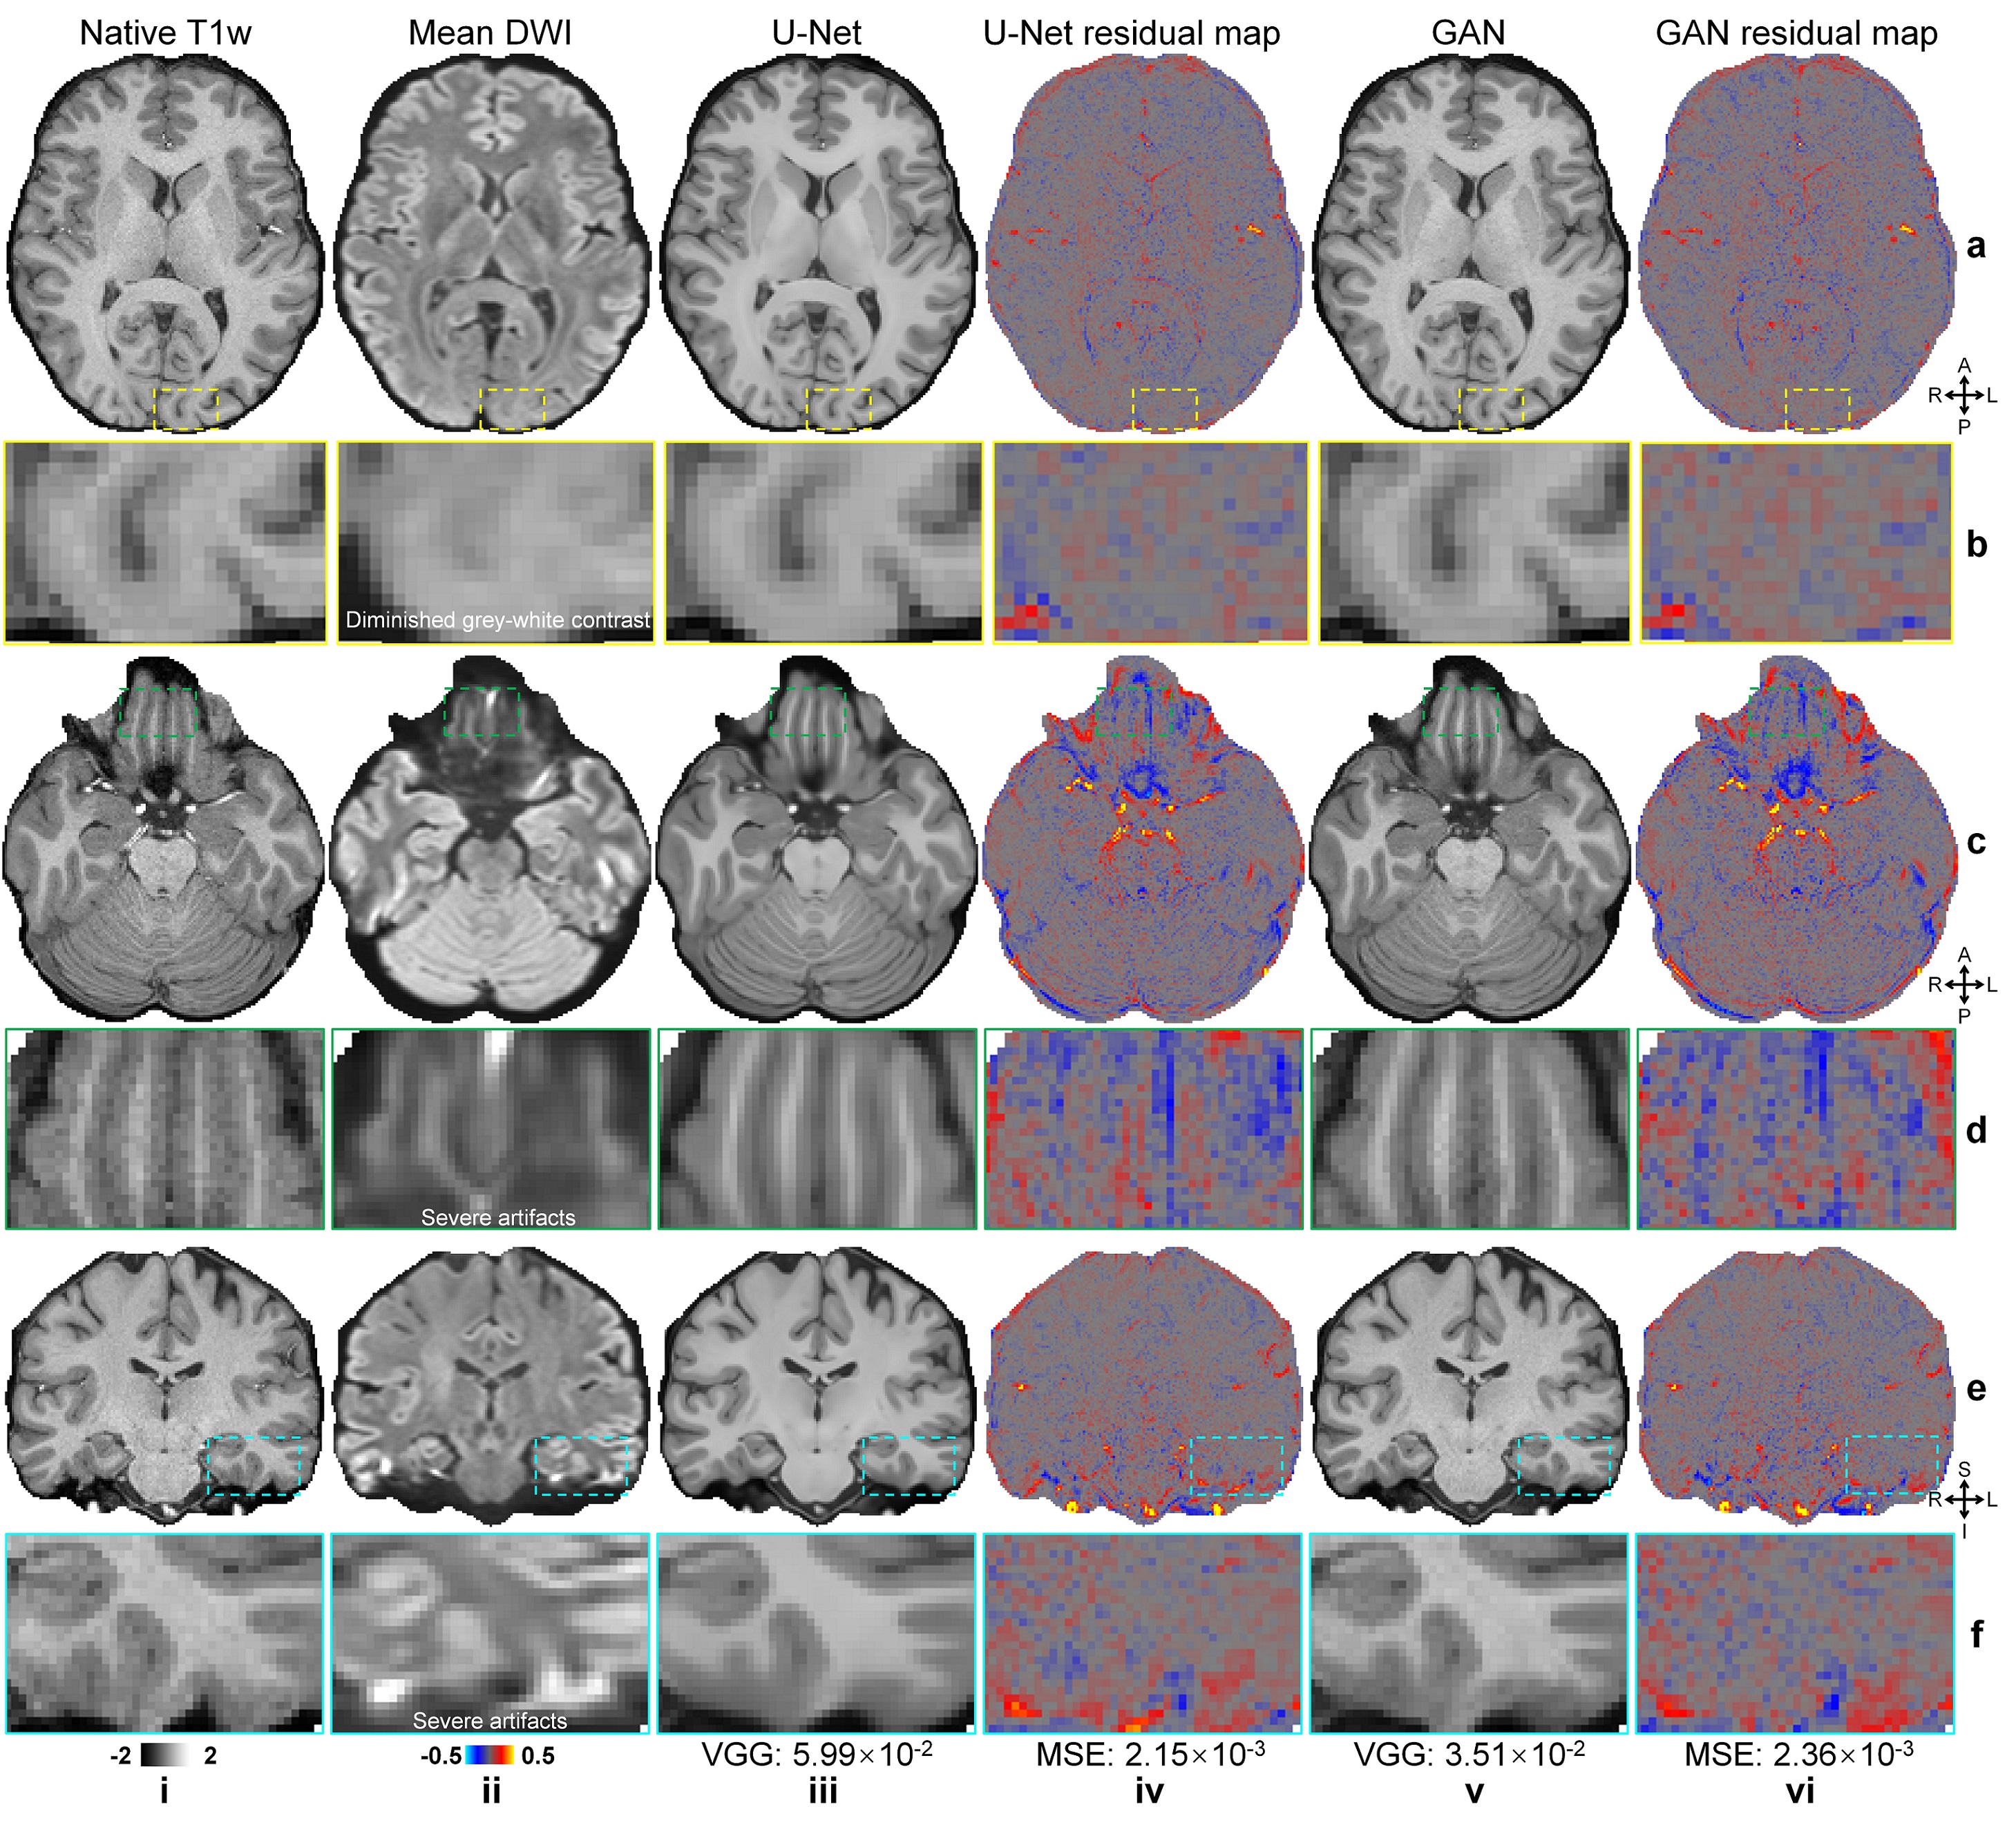
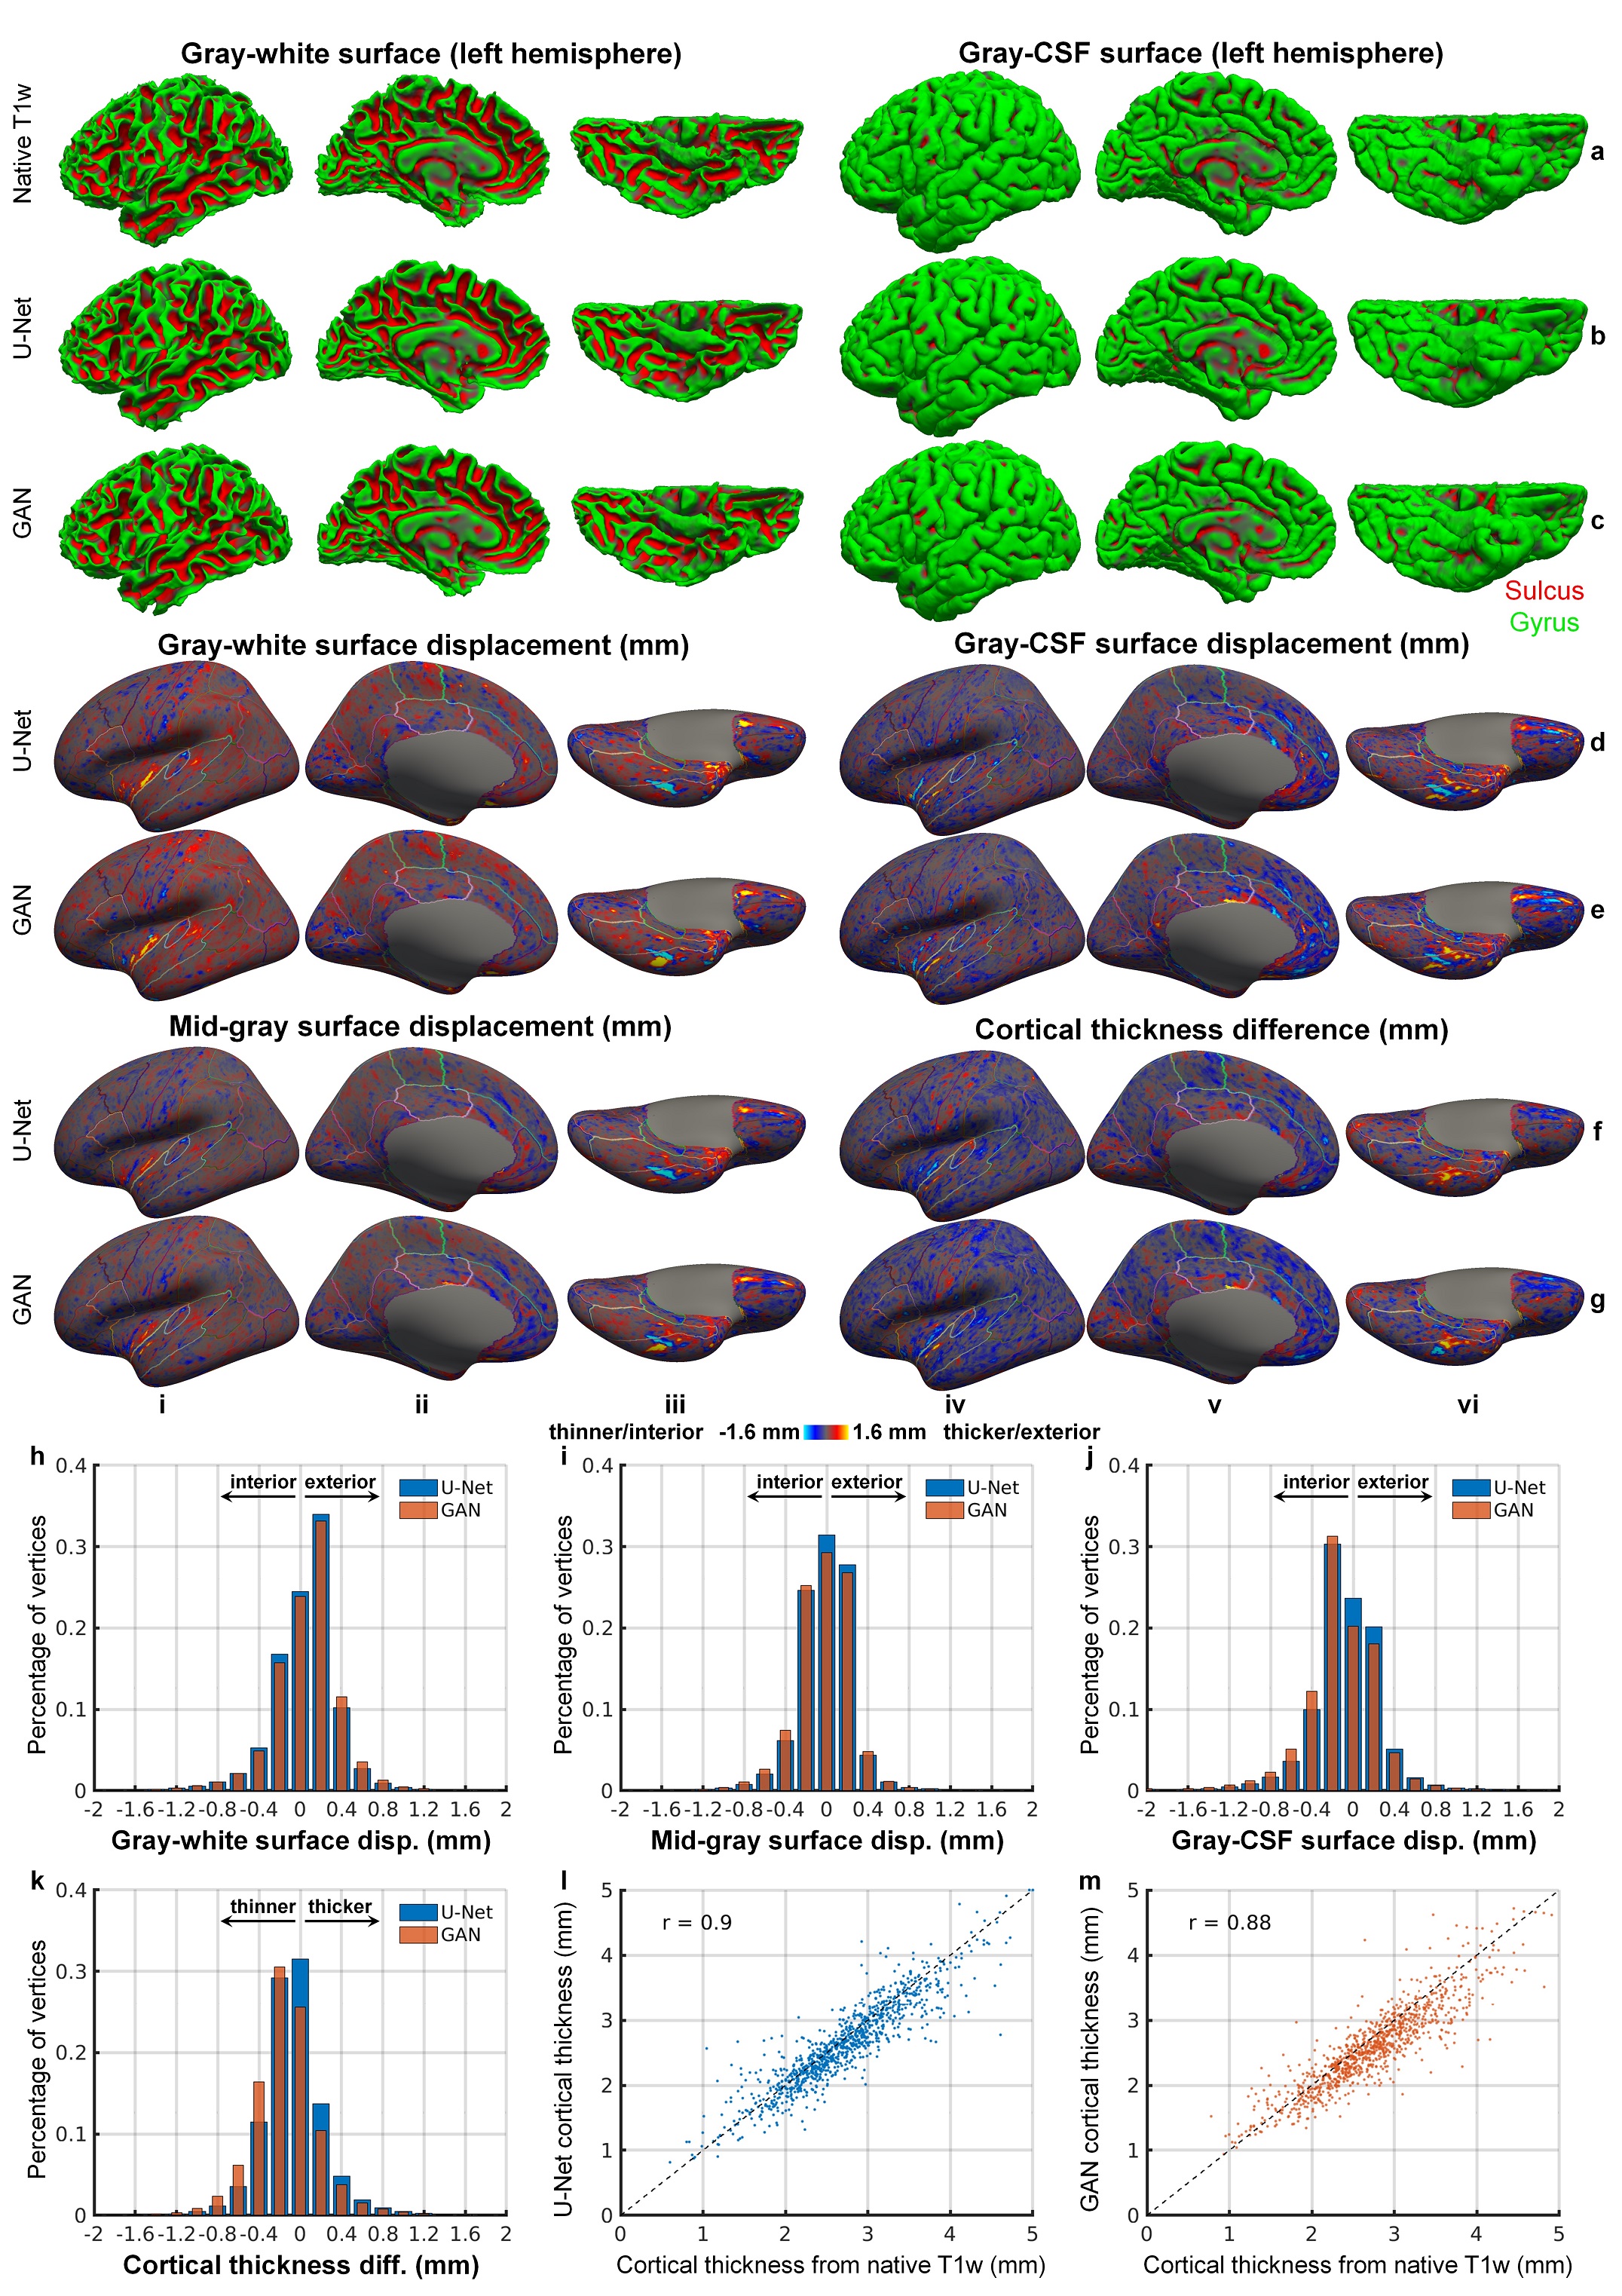
CNNs synthesized high-quality T1w images (Fig.2), even near regions with severe artifacts in the diffusion data (Fig.2d,f). Quantitatively, MSE was lower for U-Net (2.17×10⁻³±0.31×10⁻³ vs. 2.45×10⁻³±0.31×10⁻³) while VGG loss was lower for GAN (2.78×10⁻²±0.37×10⁻² vs. 5.14×10⁻²±0.43×10⁻²).Cortical surfaces from synthesized T1w images were similar to those from native images (Fig.3a–c). Discrepancies did not exhibit clear spatial patterns suggesting anatomical bias (Fig.3d–g) and were minor (Fig.3h–m). Group-level means (±standard deviation, in mm) of the whole-brain averaged discrepancy for gray-white, mid-gray, gray-CSF surface positioning and thickness estimation were lower for U-Net (0.25±0.019, 0.21±0.015, 0.27±0.021, 0.22±0.012) than for GAN (0.25±0.02, 0.22±0.015, 0.28±0.018, 0.24±0.015). For reference, the scan-rescan precision of FreeSurer is 0.2 mm32,33. The correlation for vertex-wise thickness estimates was also higher for U-Net (0.89±0.012 vs. 0.88±0.009).
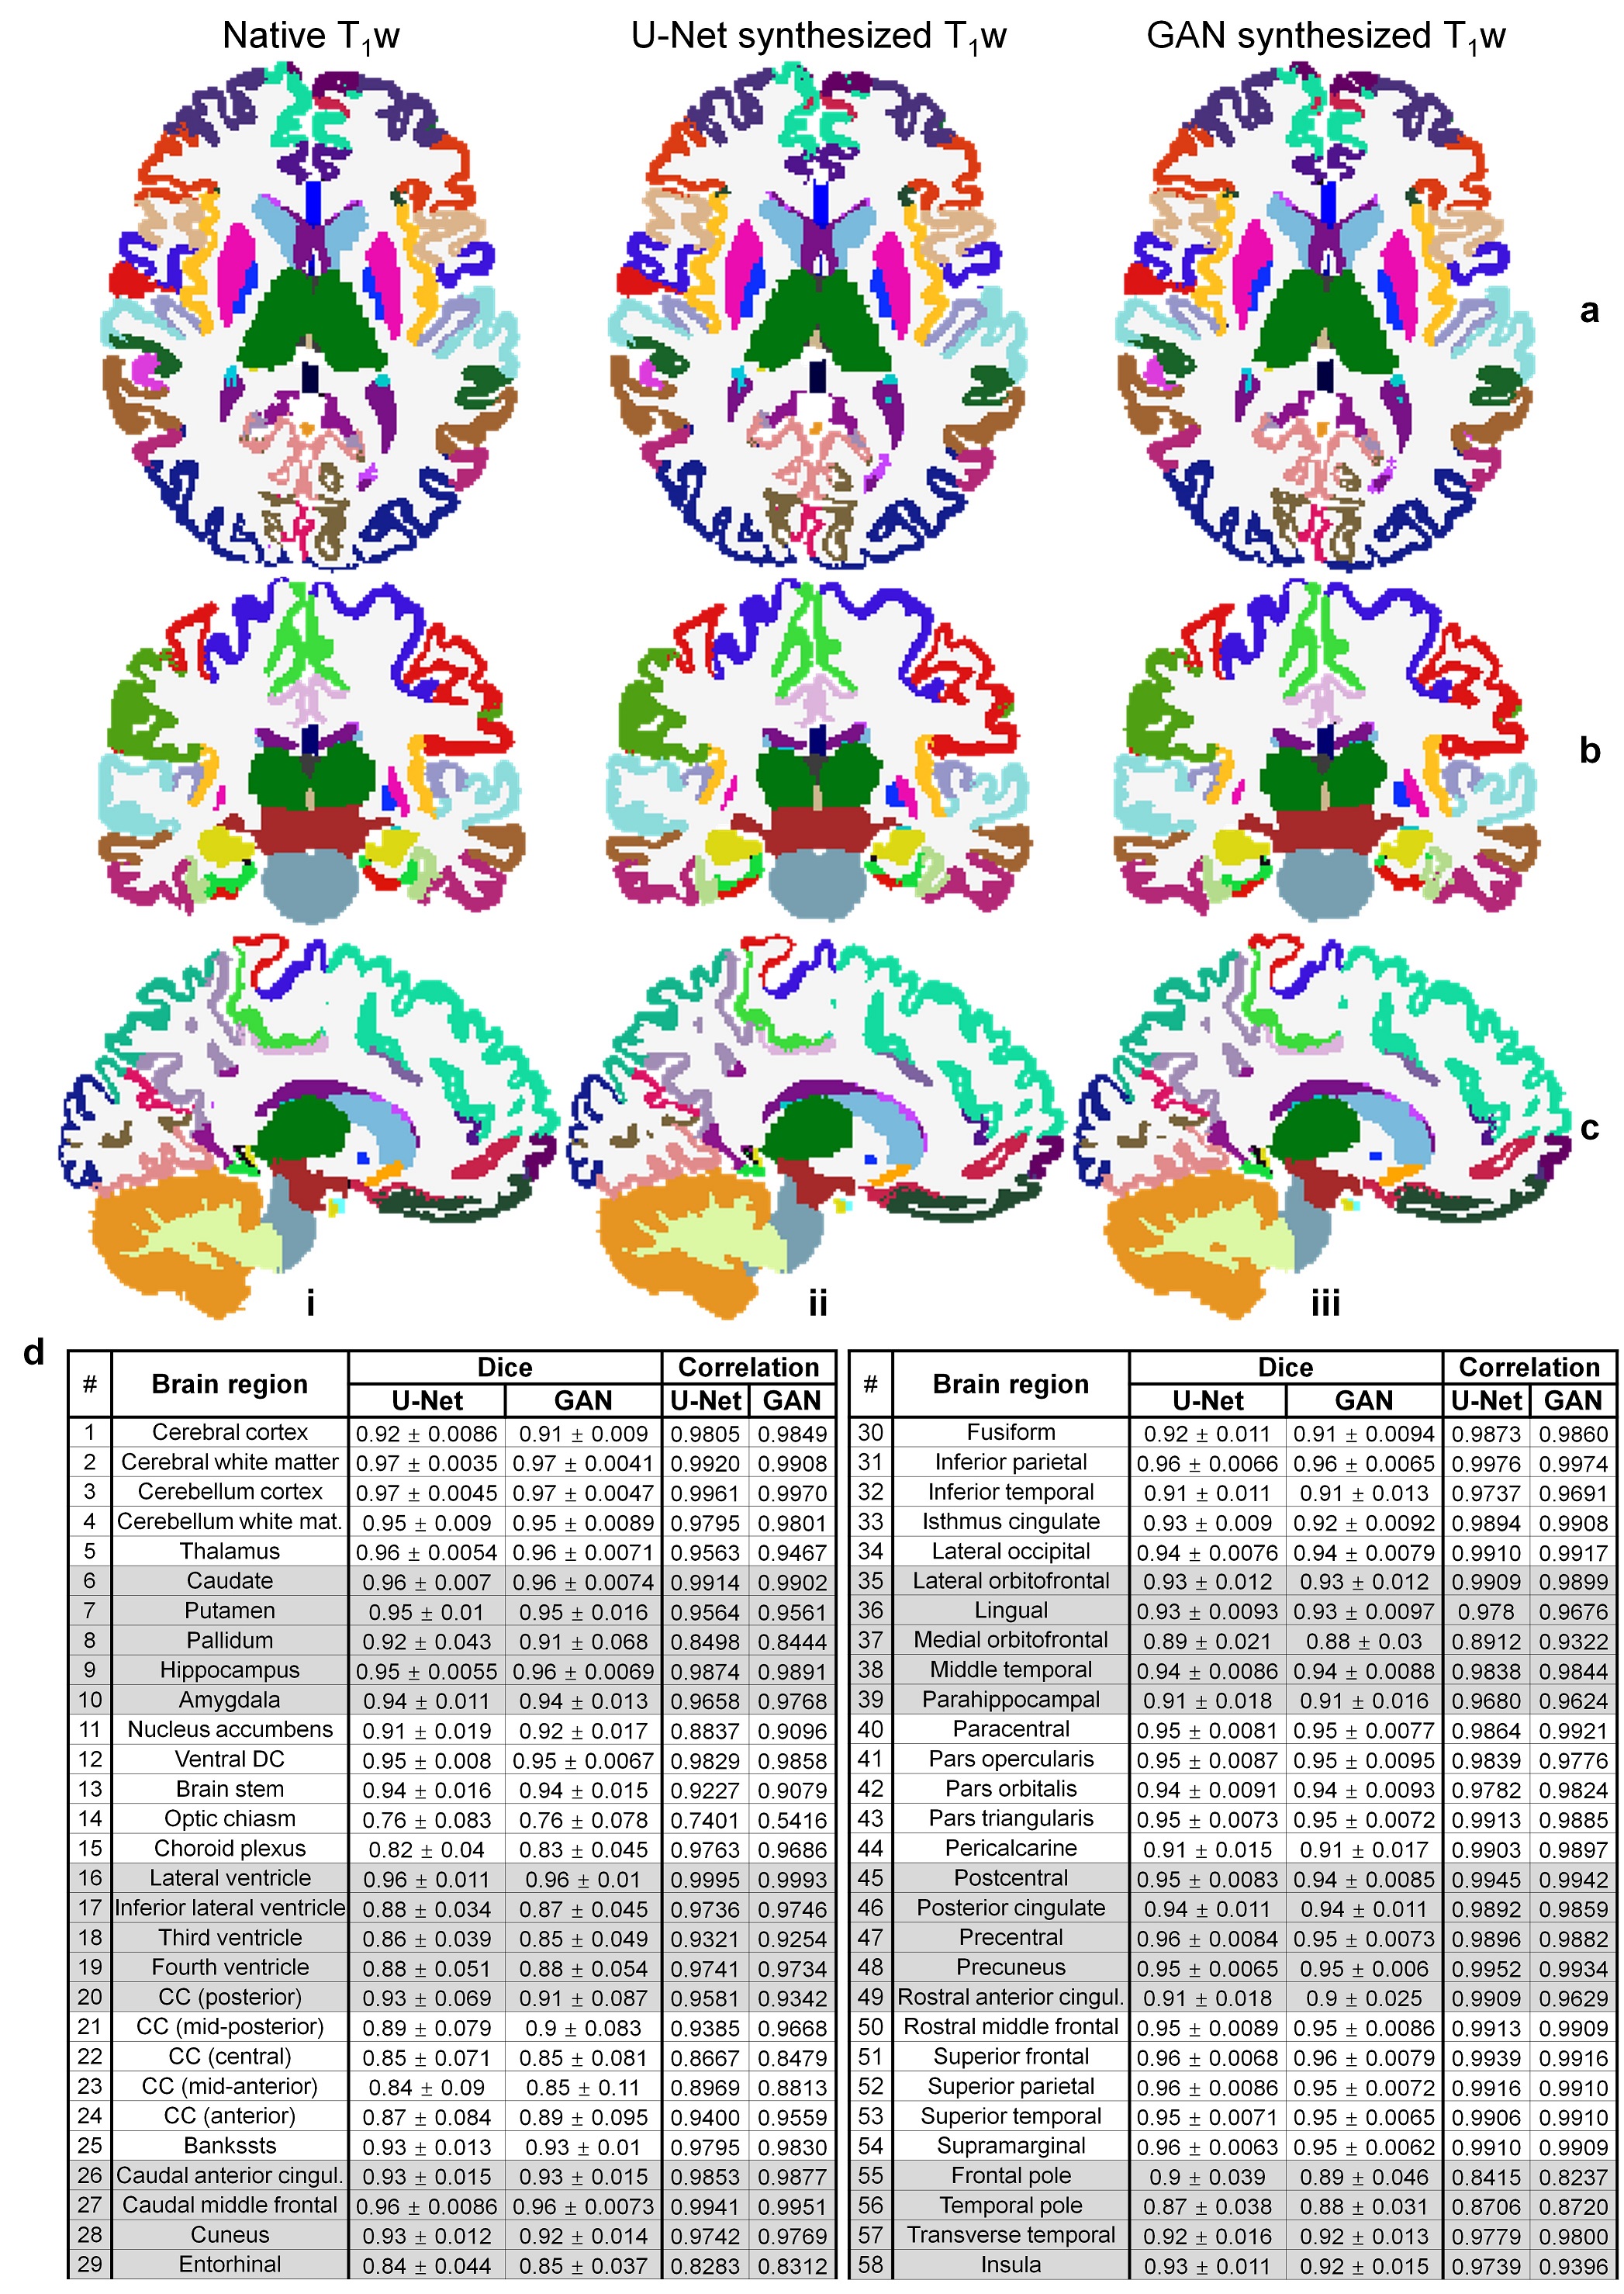
Volumetric segments from synthesized images were similar to those from native images (Fig.4a–c), with Dice coefficients higher than 0.9 and correlations for segmented volumes higher than 0.95 for most regions (Fig.4d).
Figure 5 depicted maps of the diffusion orientation tangentiality (angle between DTI primary eigenvector and cortical surface normal), fractional anisotropy, mean and radial diffusivity (Fig.5a–d), the reconstructed thalamocortical radiation and tractography-identified ventral intermediate nucleus location (Fig.5e–n) generated using U-Net-synthesized T1w images, which were similar to those from native images.
Discussion and Conclusion
Our results support the use of CNN-synthesized T1w images to facilitate analysis of diffusion data. GAN-synthesized images are more visually appealing but with lower data consistency since GAN minimizes a combination of content and adversarial loss, resulting in less accurate brain segmentation. Therefore U-Net is recommended.Acknowledgements
The T1w and diffusion MRI data were provided by the Human Connectome Project, WU-Minn-Ox Consortium (Principal Investigators: David Van Essen and Kamil Ugurbil; U54-MH091657) funded by the 16 NIH Institutes and Centers that support the NIH Blueprint for Neuroscience Research; and by the McDonnell Center for Systems Neuroscience at Washington University. This work was supported by the National Institutes of Health (grant numbers P41-EB015896, P41-EB030006, U01-EB026996, S10-RR023401, S10-RR019307, S10-RR023043, K99-AG073506, R01 EB028797, R03 EB031175, U01 EB025162), the NVidia Corporation for computing support, and the Athinoula A. Martinos Center for Biomedical Imaging.References
1. Liao C, Bilgic B, Tian Q, et al. Distortion‐free, high‐isotropic‐resolution diffusion MRI with gSlider BUDA‐EPI and multicoil dynamic B0 shimming. Magnetic Resonance in Medicine. 2021;86(2):791-803.
2. Andersson JL, Graham MS, Drobnjak I, Zhang H, Campbell J. Susceptibility-induced distortion that varies due to motion: Correction in diffusion MR without acquiring additional data. NeuroImage. 2018;171:277-295.
3. Andersson JL, Skare S, Ashburner J. How to correct susceptibility distortions in spin-echo echo-planar images: application to diffusion tensor imaging. NeuroImage. 2003;20(2):870-888.
4. Andersson JL, Sotiropoulos SN. An integrated approach to correction for off-resonance effects and subject movement in diffusion MR imaging. NeuroImage. 2016;125:1063-1078.
5. Bhushan C, Haldar JP, Choi S, Joshi AA, Shattuck DW, Leahy RM. Co-registration and distortion correction of diffusion and anatomical images based on inverse contrast normalization. Neuroimage. 2015;115:269-280.
6. Beaumont J, Gambarota G, Prior M, Fripp J, Reid LB. Avoiding Data Loss: Synthetic MRIs Generated from Diffusion Imaging Can Replace Corrupted Structural Acquisitions For Freesurfer-Seeded Tractography. bioRxiv. 2021.
7. Little G, Beaulieu C. Automated cerebral cortex segmentation based solely on diffusion tensor imaging for investigating cortical anisotropy. NeuroImage. 2021;237:118105.
8. Iglesias JE, Billot B, Balbastre Y, et al. Joint super-resolution and synthesis of 1 mm isotropic MP-RAGE volumes from clinical MRI exams with scans of different orientation, resolution and contrast. NeuroImage. 2021:118206.
9. La Rosa F, Yu T, Barquero G, Thiran J-P, Granziera C, Cuadra MB. MPRAGE to MP2RAGE UNI translation via generative adversarial network improves the automatic tissue and lesion segmentation in multiple sclerosis patients. Computers in Biology and Medicine. 2021;132:104297.
10. Yurt M, Dar SU, Erdem A, Erdem E, Oguz KK, Çukur T. Mustgan: Multi-stream generative adversarial networks for MR image synthesis. Medical Image Analysis. 2021;70:101944.
11. Kaji S, Kida S. Overview of image-to-image translation by use of deep neural networks: denoising, super-resolution, modality conversion, and reconstruction in medical imaging. Radiological physics and technology. 2019;12(3):235-248.
12. Falk T, Mai D, Bensch R, et al. U-Net: deep learning for cell counting, detection, and morphometry. Nature Methods. 2019;16(1):67-70.
13. Ronneberger O, Fischer P, Brox T. U-net: Convolutional networks for biomedical image segmentation. Paper presented at: International Conference on Medical image computing and computer-assisted intervention2015.
14. Li Z, Tian Q, Ngamsombat C, et al. High-fidelity fast volumetric brain MRI using synergistic wave-controlled aliasing in parallel imaging and a hybrid denoising generative adversarial network. bioRxiv. 2021.
15. Sotiropoulos SN, Jbabdi S, Xu J, et al. Advances in diffusion MRI acquisition and processing in the Human Connectome Project. NeuroImage. 2013;80:125-143.
16. Glasser MF, Sotiropoulos SN, Wilson JA, et al. The minimal preprocessing pipelines for the Human Connectome Project. NeuroImage. 2013;80:105-124.
17. Skare S, Hedehus M, Moseley ME, Li T-Q. Condition number as a measure of noise performance of diffusion tensor data acquisition schemes with MRI. Journal of Magnetic Resonance. 2000;147(2):340-352.
18. Ledig C, Theis L, Huszar F, et al. Photo-Realistic Single Image Super-Resolution Using a Generative Adversarial Network. 30th IEEE Conference on Computer Vision and Pattern Recognition2017:105-114.
19. Fischl B. FreeSurfer. NeuroImage. 2012;62(2):774-781.
20. Fischl B, Sereno MI, Dale AM. Cortical surface-based analysis: II: inflation, flattening, and a surface-based coordinate system. NeuroImage. 1999;9(2):195-207.
21. Fischl B, Van Der Kouwe A, Destrieux C, et al. Automatically parcellating the human cerebral cortex. Cerebral Cortex. 2004;14(1):11-22.
22. Dale AM, Fischl B, Sereno MI. Cortical surface-based analysis: I. Segmentation and surface reconstruction. Neuroimage. 1999;9(2):179-194.
23. Simonyan K, Zisserman A. Very deep convolutional networks for large-scale image recognition. arXiv preprint arXiv:14091556. 2014.
24. Reuter M, Schmansky NJ, Rosas HD, Fischl B. Within-subject template estimation for unbiased longitudinal image analysis. NeuroImage. 2012;61(4):1402-1418.
25. Reuter M, Rosas HD, Fischl B. Highly accurate inverse consistent registration: a robust approach. NeuroImage. 2010;53(4):1181-1196.
26. Reuter M, Fischl B. Avoiding asymmetry-induced bias in longitudinal image processing. NeuroImage. 2011;57(1):19-21.
27. Zaretskaya N, Fischl B, Reuter M, Renvall V, Polimeni JR. Advantages of cortical surface reconstruction using submillimeter 7 T MEMPRAGE. Neuroimage. 2018;165:11-26.
28. Tian Q, Zaretskaya N, Fan Q, et al. Improved cortical surface reconstruction using sub-millimeter resolution MPRAGE by image denoising. NeuroImage. 2021;233:117946.
29. Behrens T, Woolrich M, Jenkinson M, et al. Characterization and propagation of uncertainty in diffusion‐weighted MR imaging. Magnetic resonance in medicine. 2003;50(5):1077-1088.
30. Jbabdi S, Sotiropoulos SN, Savio AM, Graña M, Behrens TE. Model‐based analysis of multishell diffusion MR data for tractography: how to get over fitting problems. Magnetic resonance in medicine. 2012;68(6):1846-1855.
31. Tian Q, Wintermark M, Elias WJ, et al. Diffusion MRI tractography for improved transcranial MRI-guided focused ultrasound thalamotomy targeting for essential tremor. NeuroImage: Clinical. 2018;19:572-580.
32. Fujimoto K, Polimeni JR, Van Der Kouwe AJ, et al. Quantitative comparison of cortical surface reconstructions from MP2RAGE and multi-echo MPRAGE data at 3 and 7 T. NeuroImage. 2014;90:60-73.
33. Han X, Jovicich J, Salat D, et al. Reliability of MRI-derived measurements of human cerebral cortical thickness: the effects of field strength, scanner upgrade and manufacturer. NeuroImage. 2006;32(1):180-194.
Figures