0436
Retrospective Pharmacokinetic Quantification of Clinical Abdominal DCE-MRI using Deep Learning1Biomedical Imaging Research Institute, Cedars-Sinai Medical Center, Los Angeles, CA, United States, 2Department of Bioengineering, University of California, Los Angeles, Los Angeles, CA, United States, 3Radiology Department, Stanford University, Stanford, CA, United States, 4Division of Digestive and Liver Diseases, Cedars-Sinai Medical Center, Los Angeles, CA, United States
Synopsis
Quantitative dynamic contrast-enhanced (DCE) MRI has the potential for early detection, accurate staging, and therapy monitoring of cancers. However, clinical abdominal DCE-MRI has limited temporal resolution and can only provide qualitative or semi-quantitative assessments of tissue vascularity. In this study, we investigated the feasibility of retrospective quantification of multi-phasic abdominal DCE-MRI by improving the temporal resolution via deep learning. Simulated multi-phasic DCE data was generated using 2-sec temporal-resolution Multitasking DCE images. Results show that DCE kinetic parameters retrospectively estimated by deep learning agree with the ground truth, and are capable of differentiating abnormal tissues.
Purpose
Pharmacokinetic parameters from quantitative DCE-MRI are potential biomarkers to help differentiate tumor stages and assess prognosis before treatment1,2. However, clinical multi-phasic abdominal DCE-MRI has limited temporal resolution (approximately 30-sec) and number of samples (n=4), and thus can only provide qualitative or semi-quantitative assessments3. The long-term objective of this project is to develop a retrospective quantification method for multi-phasic abdominal DCE-MRI by improving the temporal resolution via deep learning. In this proof-of-concept study, we will simulate conventional multi-phasic abdominal DCE-MRI by downsampling 2-sec temporal resolution Multitasking DCE4 data and assess the accuracy of retrospectively estimated kinetic parameters against the ground truth.Materials and Methods
Inputs and labels preparation40 subjects (16 healthy volunteers, 14 patients with pancreatic ductal adenocarcinoma (PDAC), 10 patients with pancreatitis) were scanned on a 3T scanner (MAGNETOM Vida, Siemens Healthcare, Germany). Six-dimensional free-breathing Multitasking DCE4,5 (MT-DCE) was used to obtain dynamic T1 mapping at 2-sec temporal resolution. The total imaging time was 12 min; 0.1 mmol/kg contrast media was administered 2-min into the scan. Other imaging parameters include: spatial resolution=1.4x1.4x3.0 mm3, number of slices=96.
Figure 1(A) summarizes the simulation of conventional multi-phasic DCE-MRI from Multitasking DCE. Multi-phasic DCE-MRI is based on the following clinical protocol6: 3D breath-holding T1W GRE, temporal resolution 30 s (TA 10 s, rest time 20 s), TR 2.8 ms, TE 1.1 ms, Cartesian linear sampling, one pre-contrast phase, and three post-contrast phases. The simulated T1W signals were generated by the GRE signal equation and served as inputs to the deep learning model. 2-sec temporal-resolution T1W signals simulated from the Multitasking data served as labels during training. To convert T1W signal intensity to contrast agent concentration for parametric quantification, both input and label signals were baseline-corrected and normalized by the pre-contrast signal $$$S_0$$$. A total of ~57,891 voxels were used for training and validation.
Network architecture and training
A deep neural network was constructed for temporal super-resolution and kinetic mapping. As shown in Figure 1(B), 30-s temporal-resolution $$$S(t)$$$ was passed to an upsampling block and compared with the 2-s temporal-resolution label $$$S(t)$$$. Data consistency loss was added to enforce the consistency between the inputs and the corresponding samples of the labels. For quantification, the temporally-super-resolved $$$S(t)$$$ and arterial input function (AIF) was passed to a deconvolution block to output $$$k_{ep}$$$ and $$$K^{trans}$$$ was then calculated as $$$K^{trans}\ /k_{ep}$$$. This deconvolution block was trained entirely self-supervised without quantitative labels, such that the mapped $$$k_{ep}$$$ and $$$K^{trans}$$$ were consistent with the super-resolution signal output. In brief, the cost function was:$$L=\left\|S_{\mathrm{out}}-S_{\mathrm{label}}\right\|_{2}^{2}+\lambda_{1}\left\|S_{\mathrm{in}}-\Omega S_{\mathrm{out}}\right\|_{2}^{2}+\lambda_{2}\left\|S_{\text {out }}-f_{\mathrm{Tofts}}\left(A I F_{\text {out }}, k_{\mathrm{ep}, \mathrm{out}}, K_{\mathrm{out}}^{\mathrm{trans}}\right)\right\|_{2}^{2}$$ with Tofts model7 $$$f_{Tofts}(C_p,k_{ep},K^{trans})=K^{trans}C_p*e^{-k_{ep}t}$$$ and temporal down-sampling operator $$$\Omega$$$.
The network was trained with Adam optimizer8 with an initial learning rate of 10-3. The learning rate was reduced by a factor of 10 when the validation loss stopped improving in 10 continuous epochs. The training was ended in 100 epochs.
Testing
For testing, pharmacokinetic parameters were fitted from Multitasking images using least-square fitting of the Tofts model with variable projection (VARPRO9). These parameters served as testing labels.
Results
Representative examplesA representative example of temporal super-resolution from a 57-year-old subject with PDAC was shown in Figure 2(A). The tumor mass was marked by a yellow boundary on the simulated artery phase image and the abdominal aorta was depicted by a red dashed circle. One example of retrospectively quantified and ground truth pharmacokinetic maps from the same subject was shown in Figure 2(B). The overlaid colored voxels show the pharmacokinetic maps from retrospective quantification (top) and Multitasking DCE data (bottom). The yellow arrow points out a benign cyst while the red arrow points out the tumor mass.
Agreement between estimated parameters and ground truth
The correlation between retrospectively quantified kinetic maps from the proposed method and the ground truth from Multitasking DCE is shown in Figure 3A, with Bland-Altman plots shown in Figure 3B. The intraclass correlation coefficient (ICC), the coefficient of determination (R), and the coefficient of variation (CoV) were also evaluated.
Ability to differentiate abnormal tissue
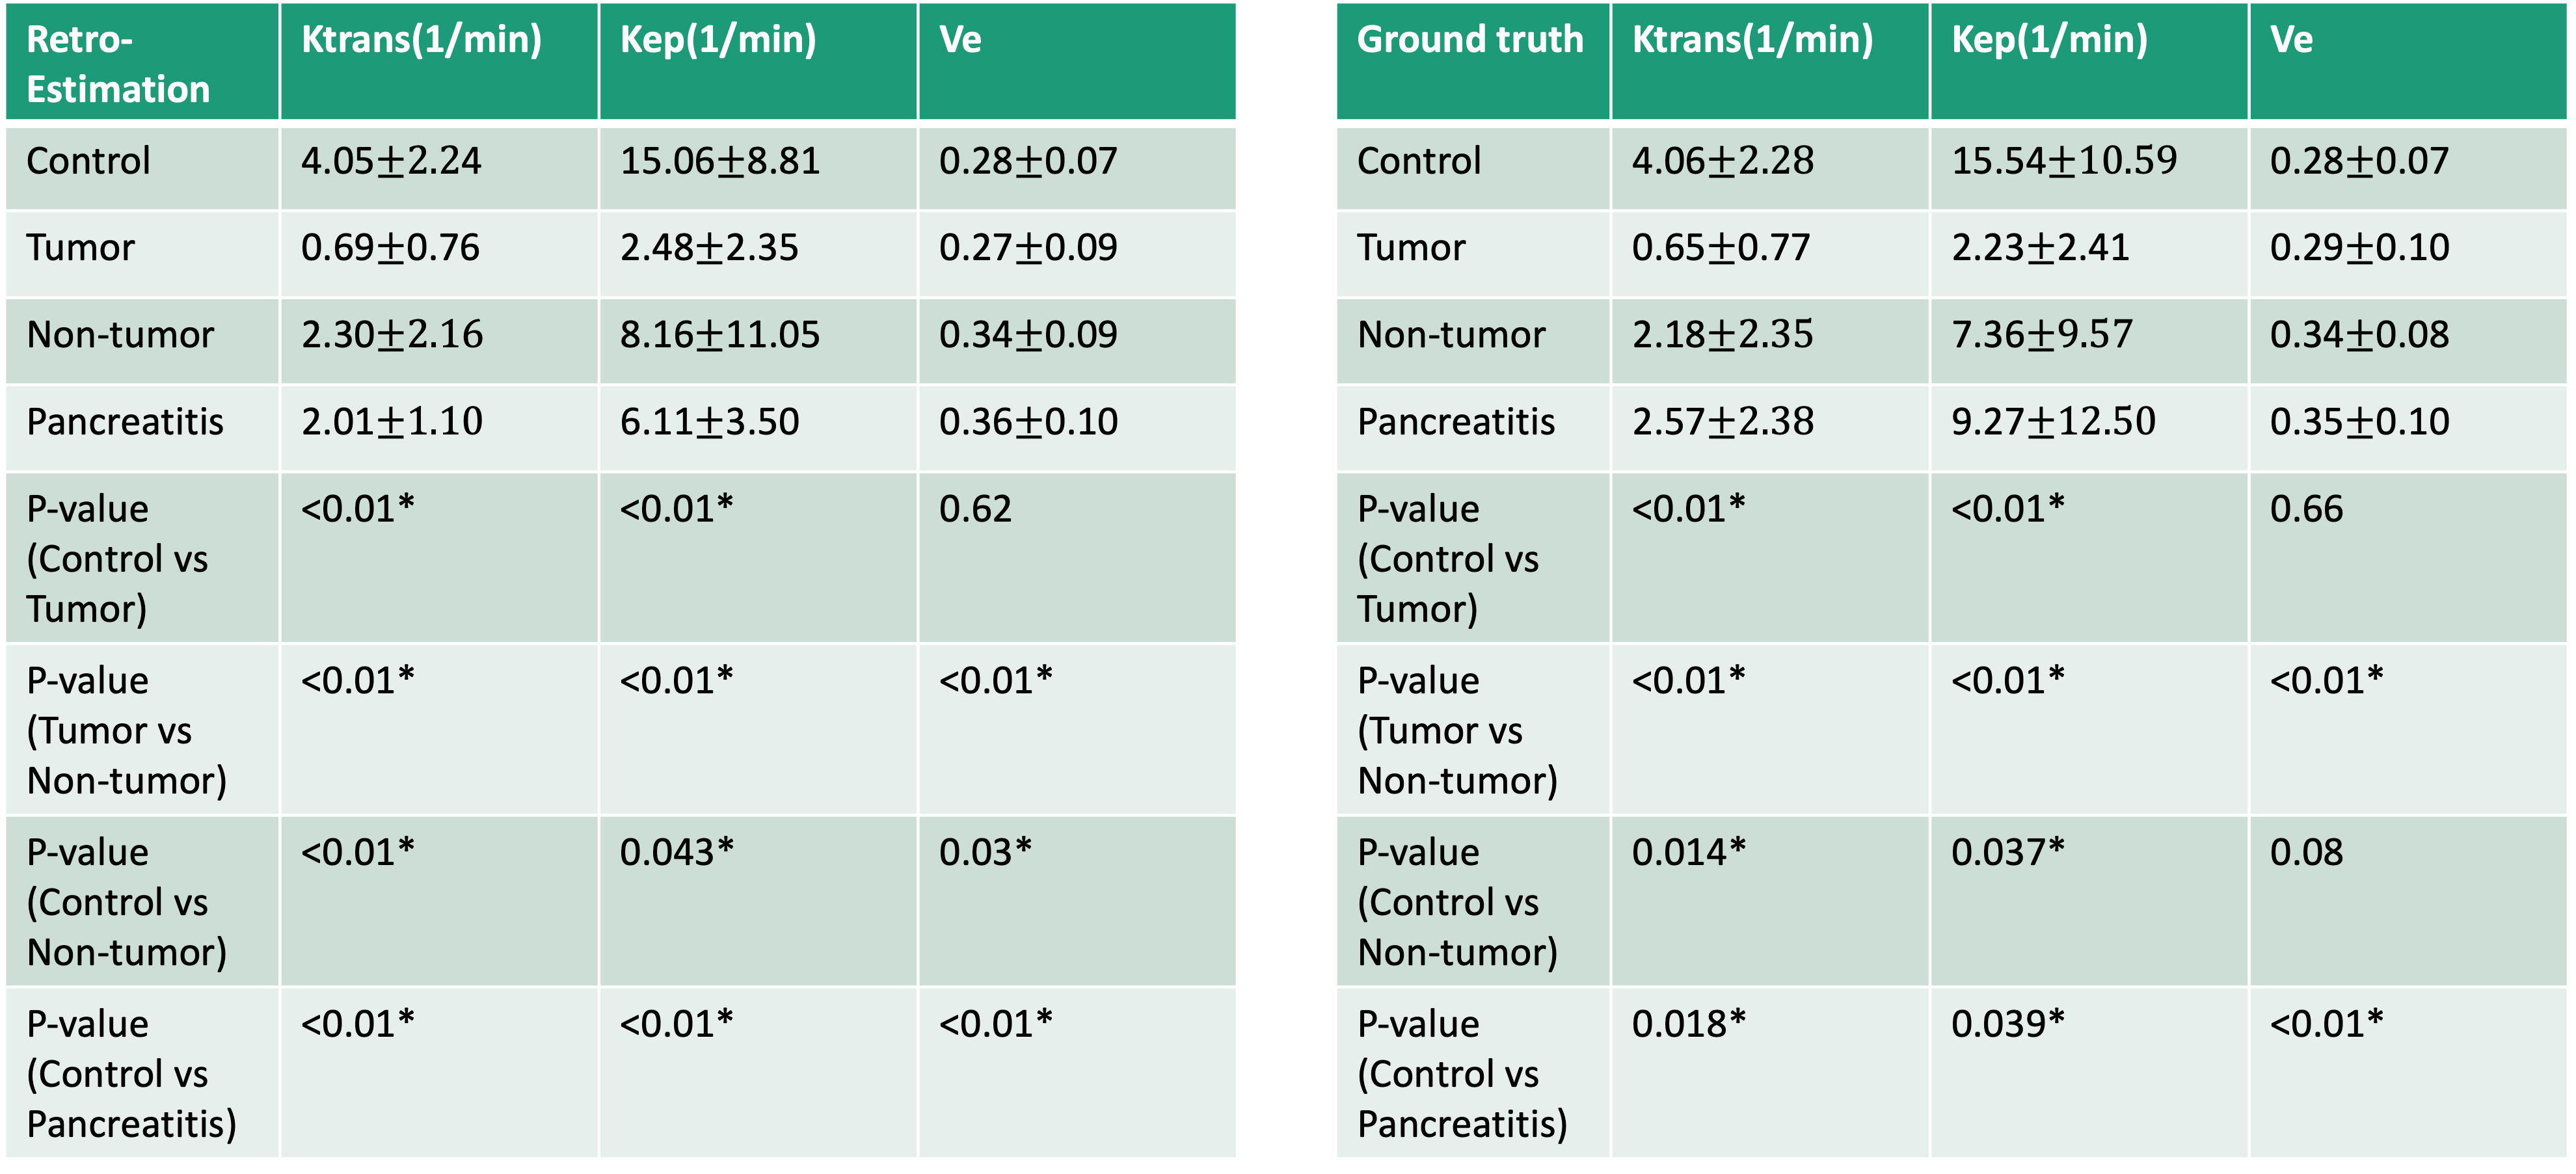
Figure 4 contains a box plot that shows the median and quartiles of the retrospectively quantified parameters (left) and ground truth (right) from the control, tumor, nontumoral and pancreatitis regions. Paired t-tests were used to evaluate the mean difference between different regions. Tumor and non-tumor regions showed significant differences in $$$v_e$$$, $$$K^{trans}$$$, $$$k_{ep}$$$ estimated by the proposed method (P= <0.01, <0.01, <0.01, respectively). The control region showed significant differences comparing to tumor region in $$$K^{trans}$$$ and $$$k_{ep}$$$ (P = <0.01, <0.01, respectively), and to pancreatitis region in $$$v_e$$$, $$$K^{trans}$$$, $$$k_{ep}$$$ (P= <0.01, <0.01, <0.01, respectively). Retrospectively quantified $$$K^{trans}$$$, $$$k_{ep}$$$ showed significant difference in control and non-tumor regions (P= <0.01, 0.043 respectively). $$$v_e$$$ estimated by the proposed method showed significant difference in control and non-tumor regions (P=0.03) while $$$v_e$$$ of ground truth did not (P=0.08). These findings were all consistent with the ground truth and were in general agreement with published findings10,11.
Conclusion and Discussion
We demonstrated that quantification of clinical multiphasic DCE-MRI is possible by deep learning. Future work will prospectively acquire MT-DCE and clinical multiphasic DCE images on the same subjects and validate the approach. If validated, this technique has the potential to improve cancer diagnosis.Acknowledgements
This work was supported in part by the National Institutes of Health (Grant/Award Nos. R01EB028146 and R01HL156818).References
1. Alonzi, R., et al., Antivascular effects of neoadjuvant androgen deprivation for prostate cancer: an in vivo human study using susceptibility and relaxivity dynamic MRI. International Journal of Radiation Oncology* Biology* Physics, 2011. 80(3): p. 721-727.
2. Zhang, N., et al., Correlation of volume transfer coefficient Ktrans with histopathologic grades of gliomas. Journal of Magnetic Resonance Imaging, 2012. 36(2): p. 355-363.
3. Kershaw, L.E. and H.L.M. Cheng, Temporal resolution and SNR requirements for accurate DCE‐MRI data analysis using the AATH model. Magnetic Resonance in Medicine, 2010. 64(6): p. 1772-1780.
4. Wang, N., et al., Six‐dimensional quantitative DCE MR Multitasking of the entire abdomen: Method and application to pancreatic ductal adenocarcinoma. Magnetic resonance in medicine, 2020. 84(2): p. 928-948.
5. Christodoulou, A.G., et al., Magnetic resonance multitasking for motion-resolved quantitative cardiovascular imaging. Nature biomedical engineering, 2018. 2(4): p. 215-226.
6. Ito, K., S. Koike, and N. Matsunaga, MR imaging of pancreatic diseases. European journal of radiology, 2001. 38(2): p. 78-93.
7. Tofts, P.S., B. Berkowitz, and M.D. Schnall, Quantitative analysis of dynamic Gd‐DTPA enhancement in breast tumors using a permeability model. Magnetic resonance in medicine, 1995. 33(4): p. 564-568.
8. Kingma, D.P. and J. Ba, Adam: A method for stochastic optimization. arXiv preprint arXiv:1412.6980, 2014.
9. Golub, G.H. and V. Pereyra, The differentiation of pseudo-inverses and nonlinear least squares problems whose variables separate. SIAM Journal on numerical analysis, 1973. 10(2): p. 413-432.
10. Bali, M.A., et al., Tumoral and nontumoral pancreas: correlation between quantitative dynamic contrast-enhanced MR imaging and histopathologic parameters. Radiology, 2011. 261(2): p. 456-466.
11. Kim, J.H., et al., Solid pancreatic lesions: characterization by using timing bolus dynamic contrast-enhanced MR imaging assessment—a preliminary study. Radiology, 2013. 266(1): p. 185-196.
Figures
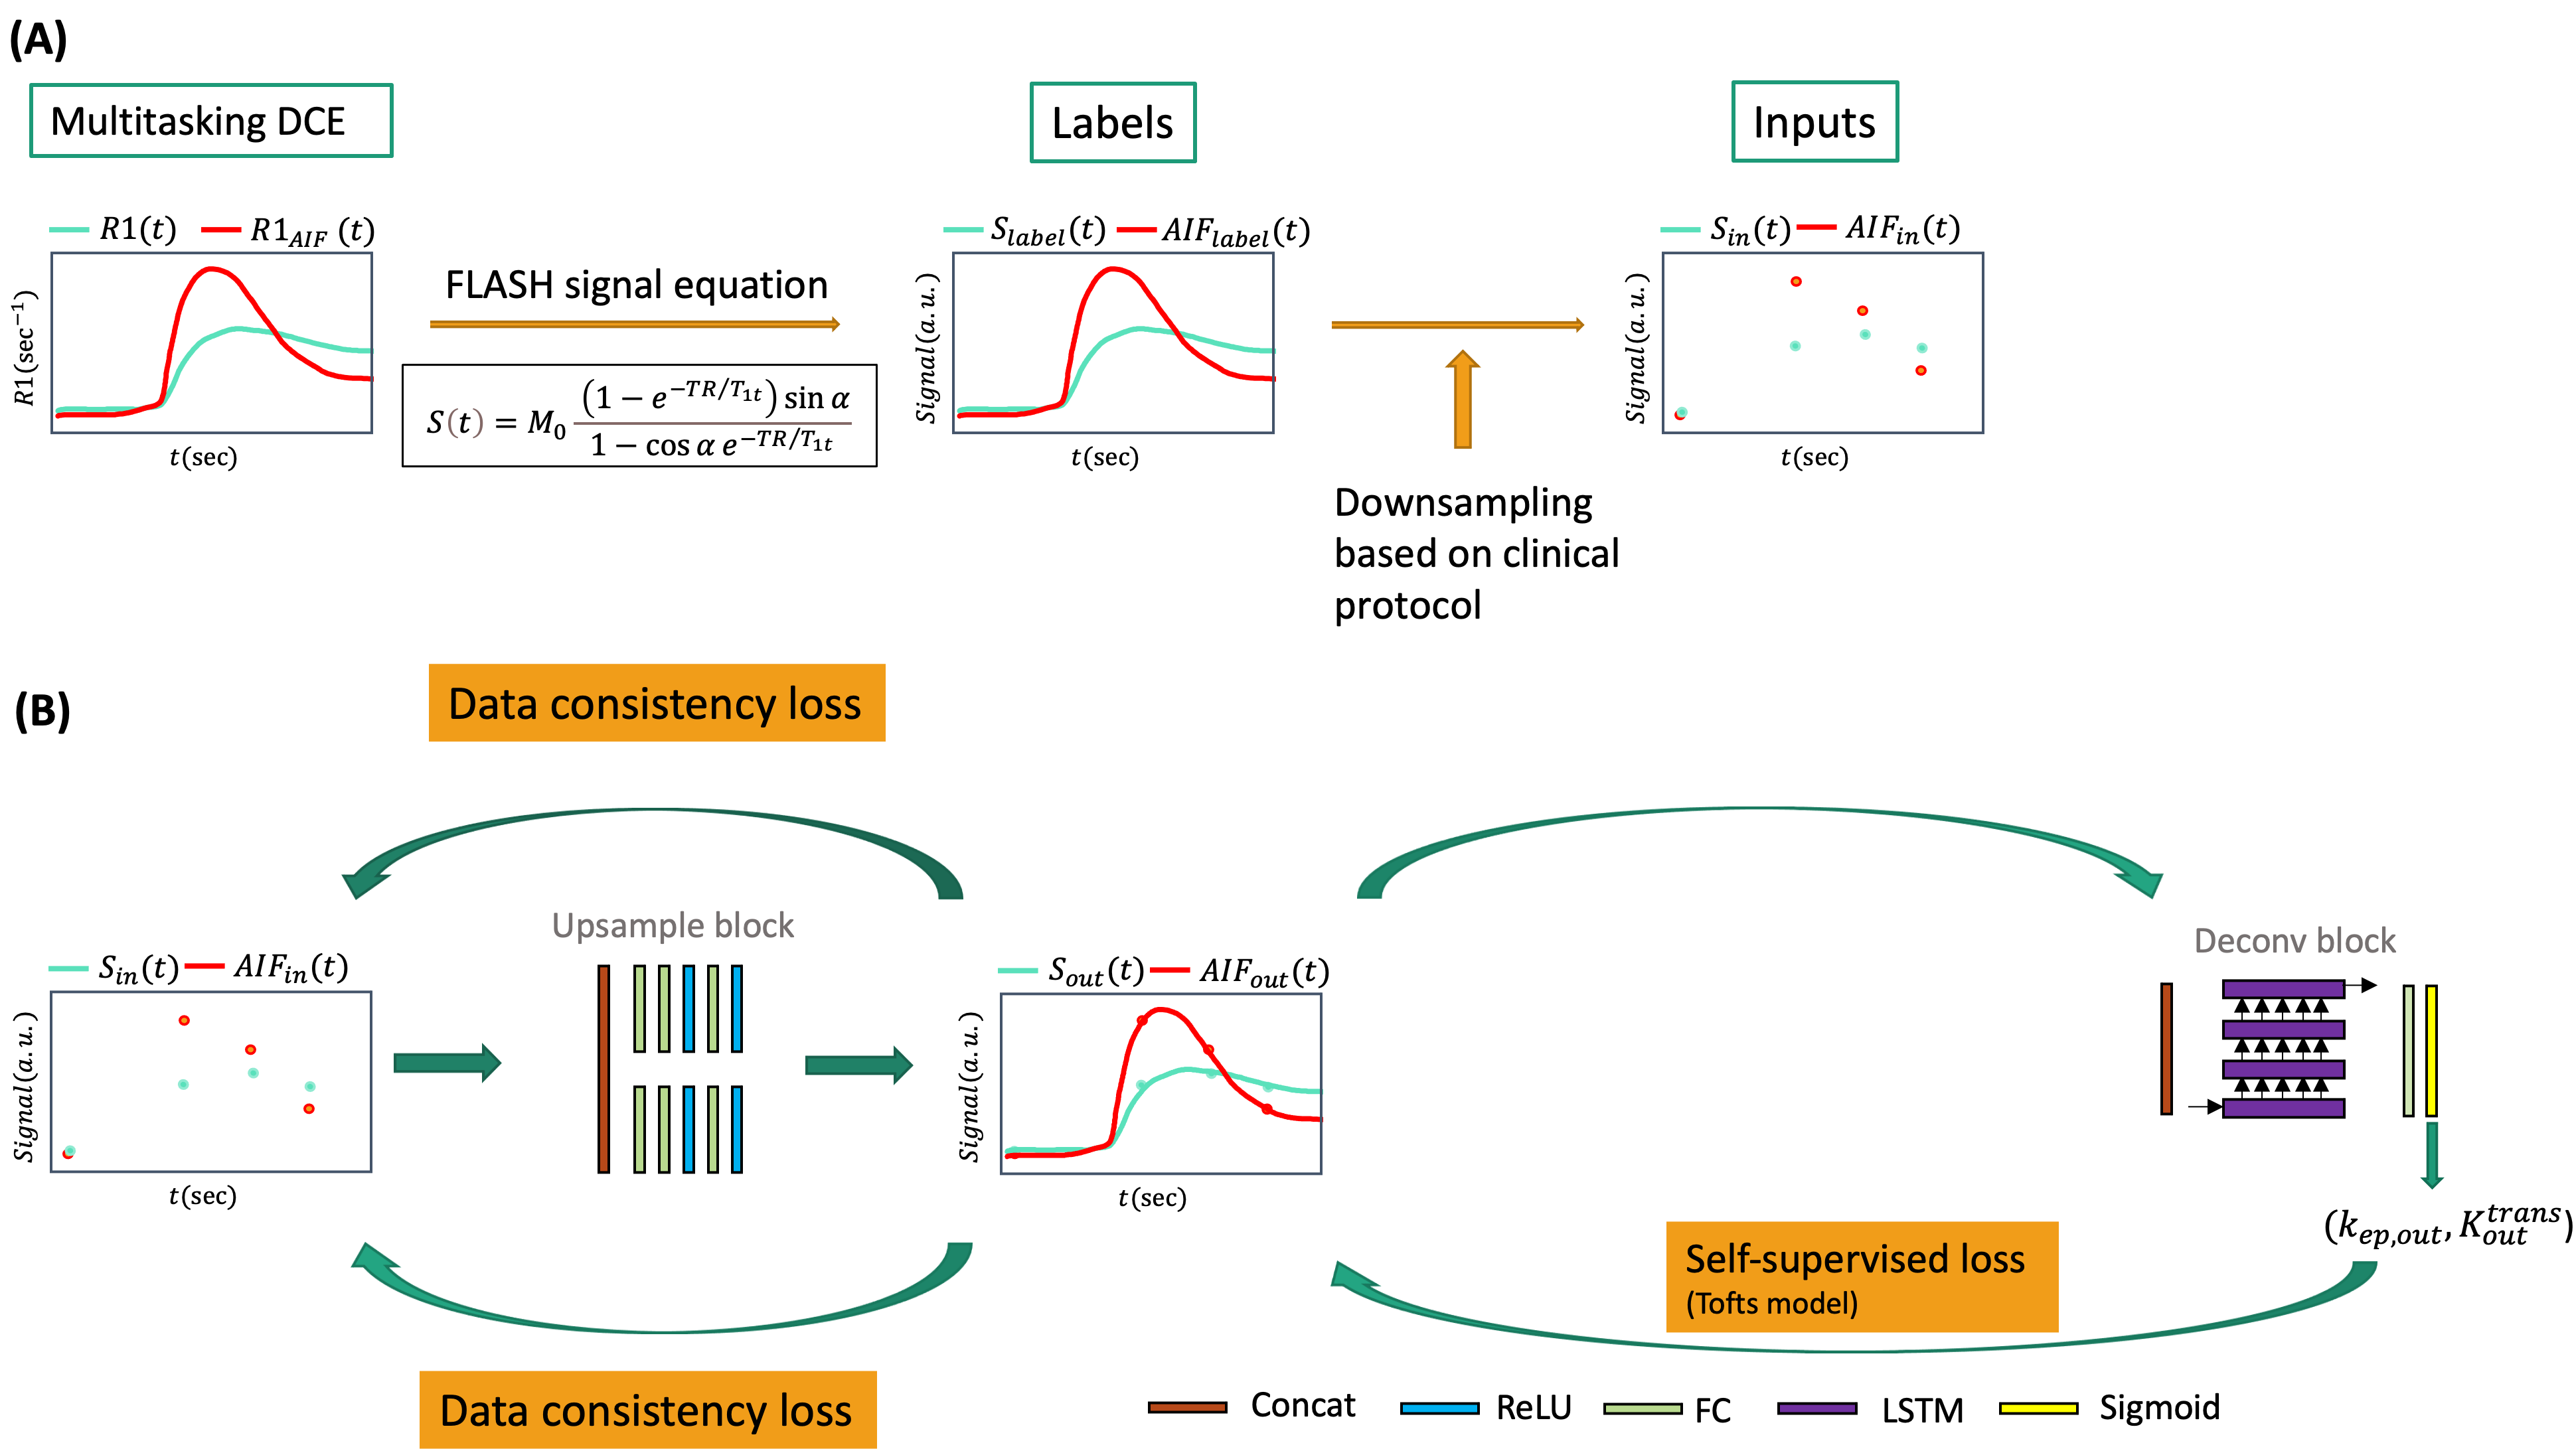
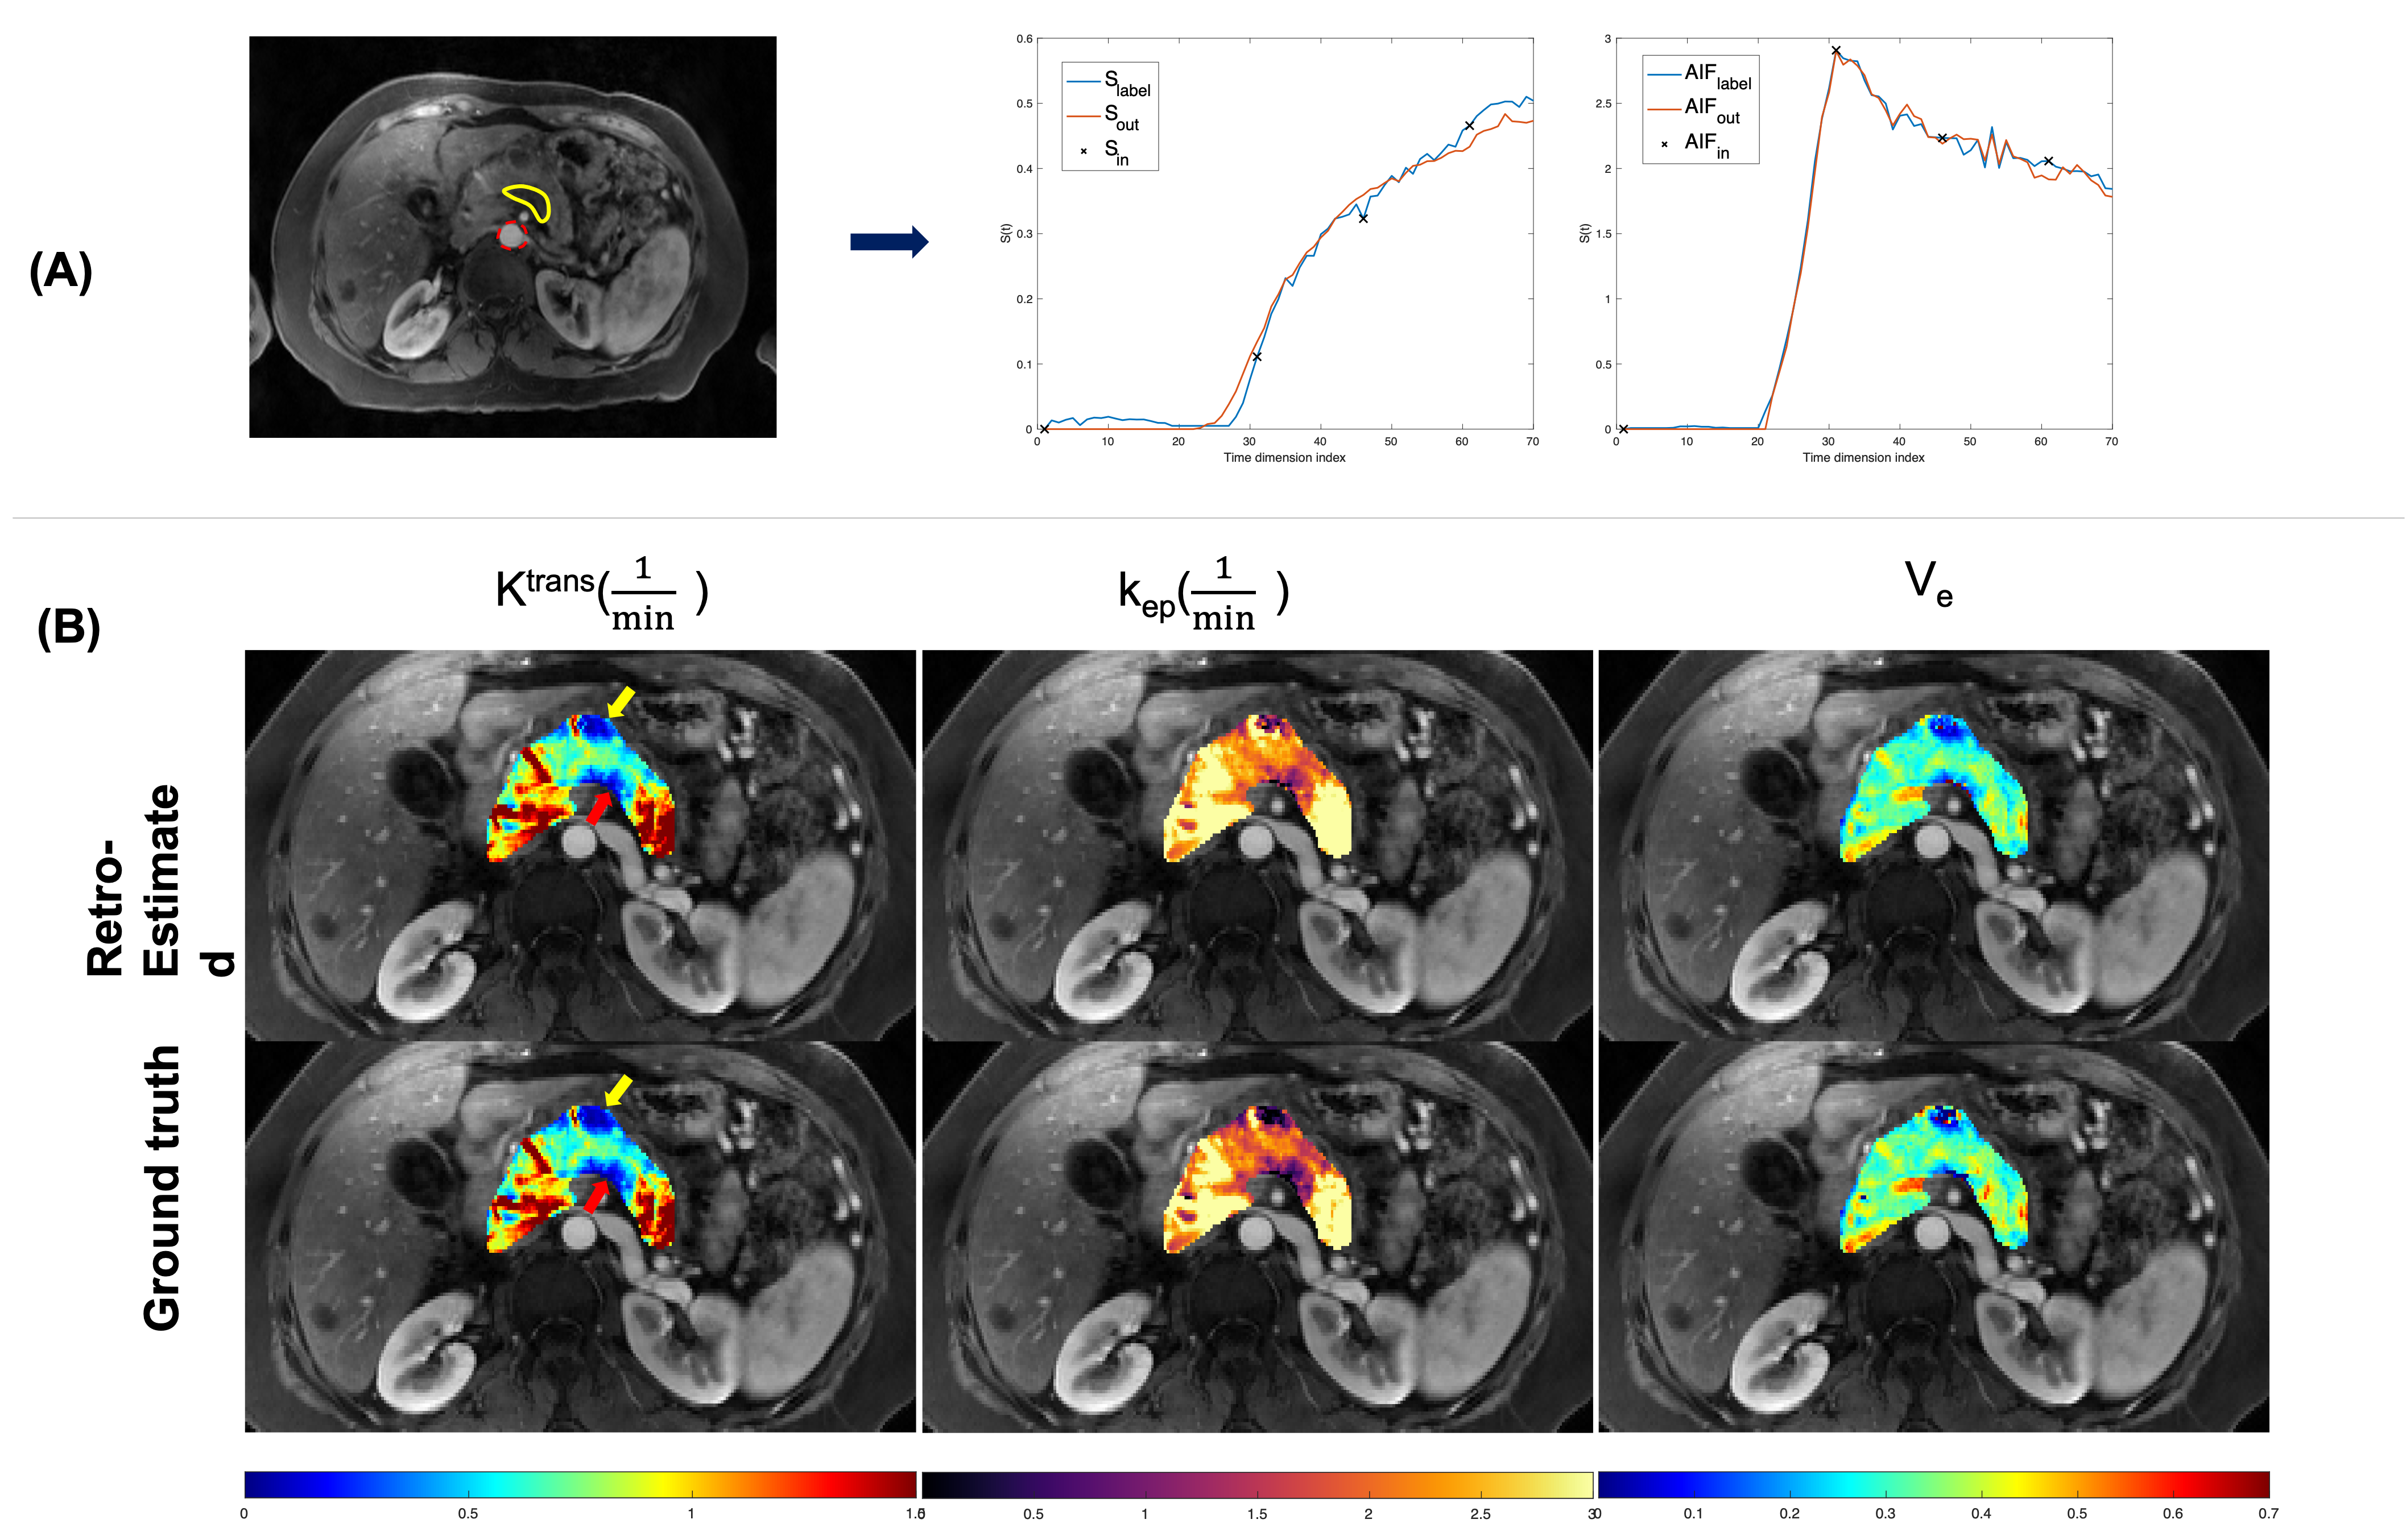
Figure 2 (A) Representative temporal super-resolution example from a 57-year-old subject with PDAC marked by yellow boundary. The abdominal aorta was depicted by a red dashed circle. The simulated multi-phasic DCE-MRI (black crosses), the network super-resolved (blue curves) and ground truth (2-sec temporal-resolution Multitasking data, red curves) were shown. (B) Pancreatic pharmacokinetic mapping of the same subject. Top row: retrospectively estimated parameters by neural network. Bottom row: ground truth parameters fitted with Multitasking data via VARPRO.
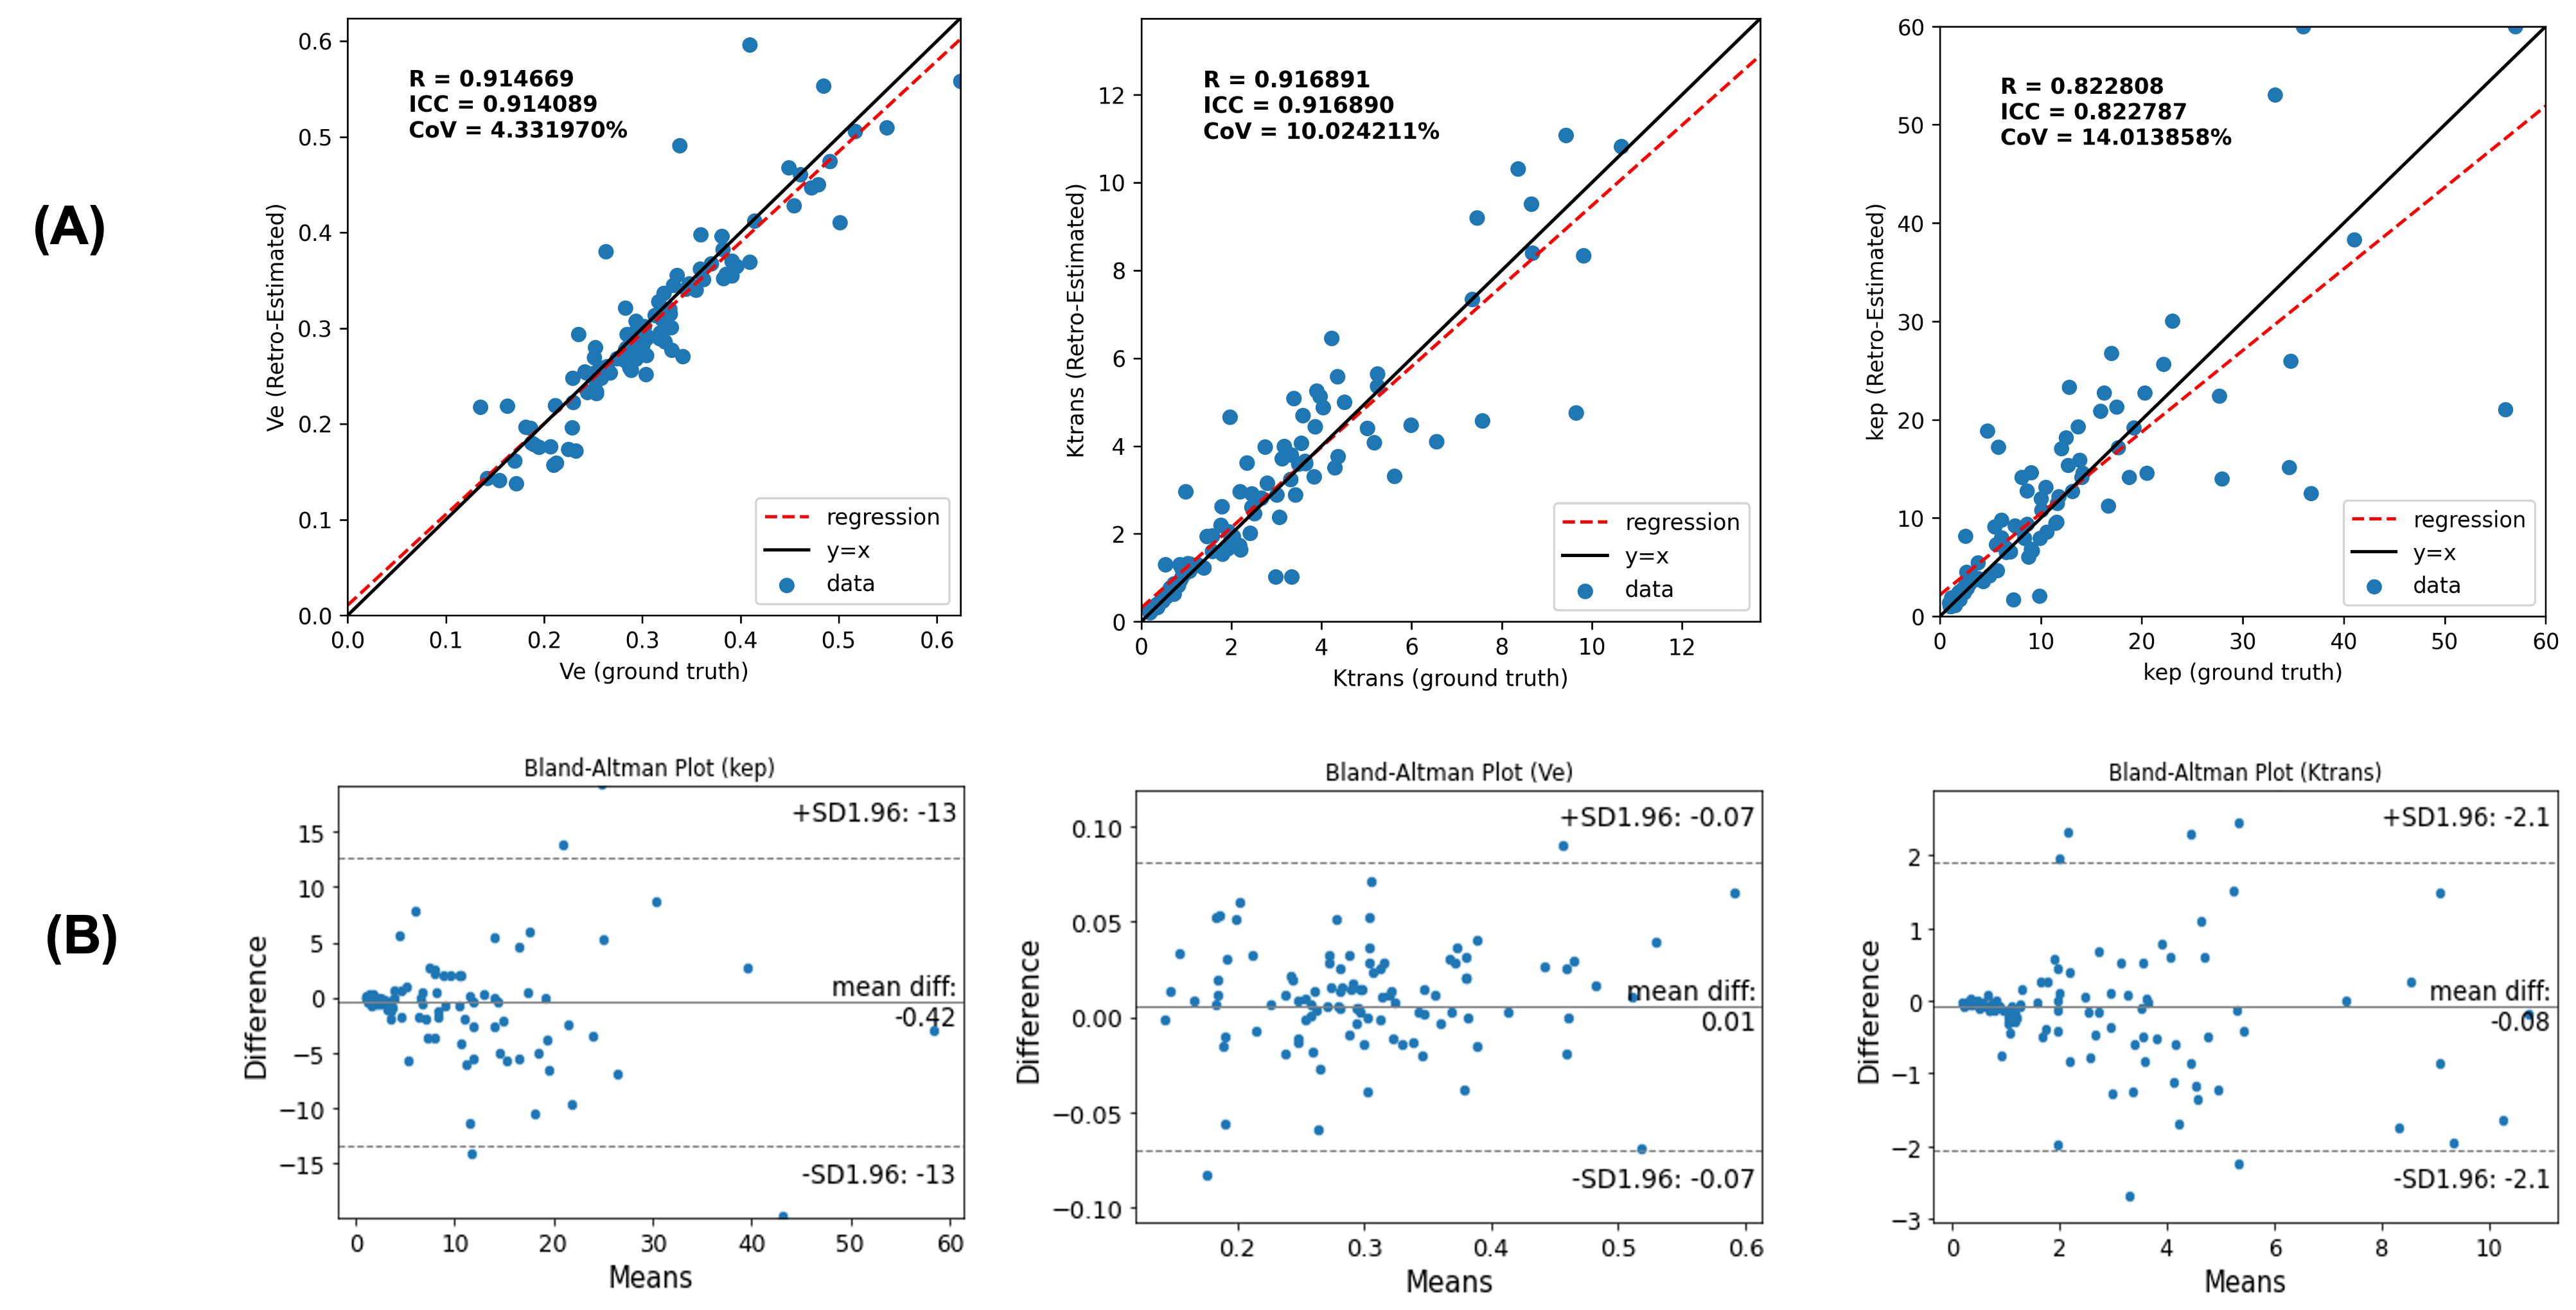
Figure 3 Correlation plot (A) and Bland-Altman plot (B) of the retrospectively estimated kinetic parameters versus ground truth. Left to right: $$$v_e$$$, $$$K^{trans}$$$, $$$k_{ep}$$$. The intraclass correlation coefficient (ICC), the coefficient of determination (R), and the coefficient of variation (CoV) were calculated to evaluate the correlation between retrospectively estimated kinetic parameters and the ground truth.
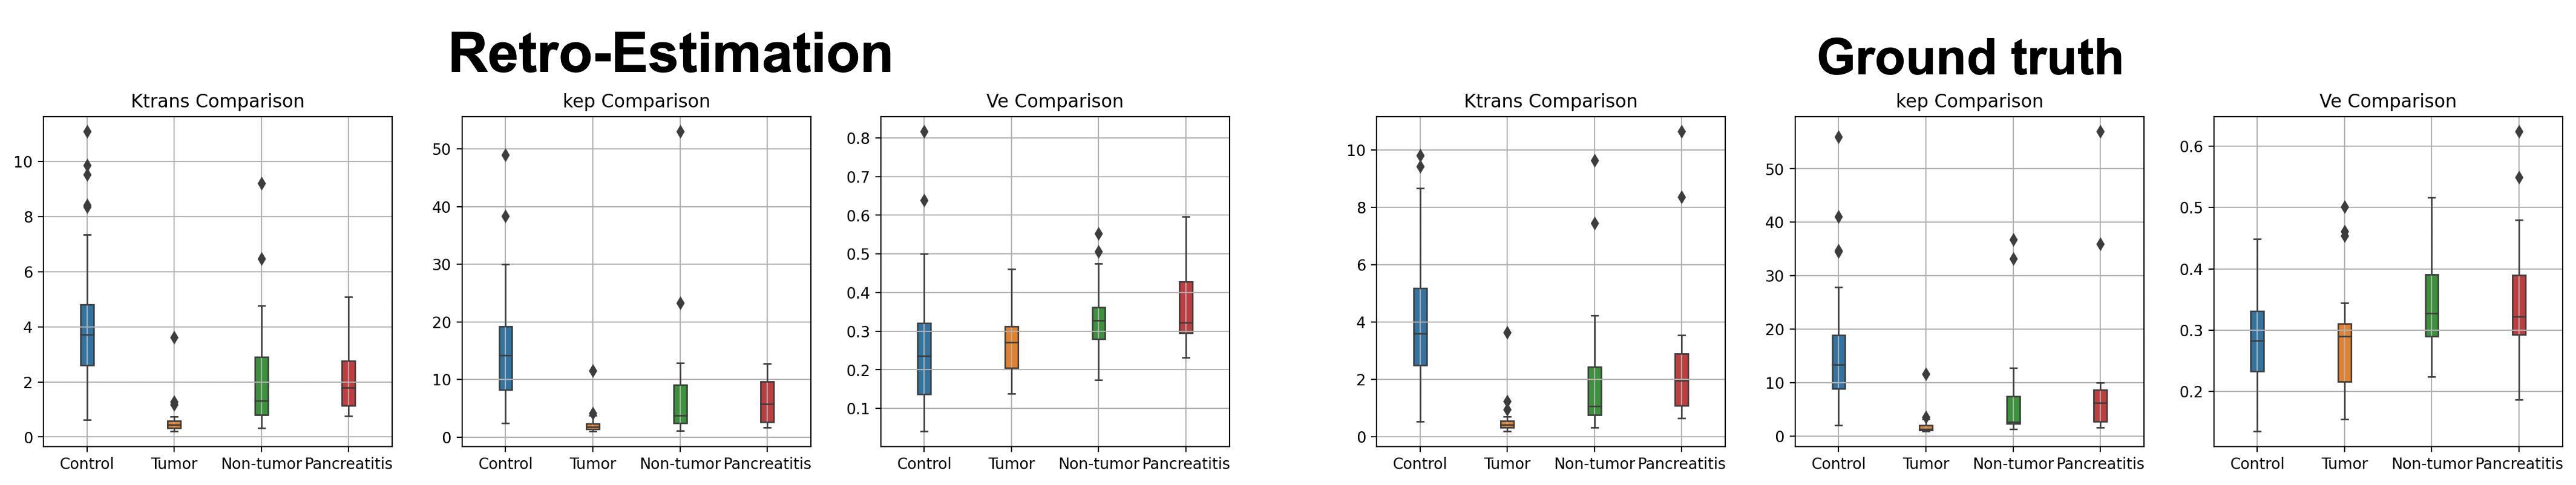
Figure 4 Box graph of averaged kinetic parameters within different ROIs. Left figure: group comparison of retrospectively estimated parameters. Right figure: group comparison of ground truth parameters. Control: pancreas of healthy volunteers. Tumor: tumor areas of PDAC patients. Non-tumor: non-tumor area within the pancreas of PDAC patients. Pancreatitis: pancreas of pancreatitis patients.