0432
Fast inline reconstruction of T2 maps from dual echo spin echo images1Biomedical Engineering, University of Alberta, Edmonton, AB, Canada, 2Department of Medicine, Division of Neurology, University of Alberta, Edmonton, AB, Canada
Synopsis
A fast reconstruction method for PD-T2w T2 maps is presented and compared to the previous L2 norm minimization technique using Bland-Altman analysis in a five patient multiple sclerosis data set acquired at 3 T. The new (subtraction) technique was in excellent agreement with the L2 norm method (confidence intervals of -1.1 to +1.2 ms), with average single slice reconstruction times of 0.6 s compared to 134 s. The speed of T2 map production allowed accurate (based on sequence simulation via Bloch equations) inline T2 maps directly on the MRI console.
Introduction
Measuring T2 quantitatively has benefited several clinical areas, including multiple sclerosis (1,2) and assessing atherosclerotic risk (3,4). While several studies seek to improve T2 quantification via increased speed (5,6), additional sequences required for mapping remain undesirable clinically due to stringent time limits and delay of resultant T2 maps from demanding computational processes. To circumvent this, T2 mapping schemes have been applied based on weighted images (PDw and T2w) typically acquired during clinical scans (7,8). However, reconstruction of T2 maps from PD-T2 image sets still requires several hours for multi-slice data on recent desktop hardware. This delay is merely a nuisance to researchers but is limiting to clinical use of quantitative T2 results. In this study, we propose a fast reconstruction of T2 maps using clinical PD-T2 data, resulting in accurate T2 maps based on Bloch equation sequence modeling directly on the MRI console. In this manner, T2 maps are immediately available and incorporated into the imaging study DICOMs.Methods
The dual-echo 2D T2 (PD-T2) mapping sequence was modelled using Bloch equation methods as described in (9) for multi-echo spin-echo (MESE) and validated in previous work for PD-T2 (10,11). Several T2 values ranging from 5 ms to 1 s and B1 values ranging from 0.5 to 1.5 (where 1.0 is nominal) were simulated for PD and T2w TEs to produce a lookup table of decay curves. In the traditional approach (L2 norm or old method), the measured decay curve is then fit through minimization of the L2 (Euclidean) norm difference between simulated and measured points (9). This technique is compared to the proposed method (subtraction or new), which first prepares the lookup table by constructing a normalized parameter, Sn:$$$ S_n (B1^+, T2)=\frac{S_{PD}-S_{T2}}{S_{PD}} =1-\frac{S_{T2}}{S_{PD}} .$$$ (1)
SPD and ST2 are the simulated responses at the two acquired TEs of the PD-T2 sequence. Similarly, the image data is reduced to a single image matrix:
$$$ I_n=\frac{I_{PD}-I_{T2}}{I_{PD}} =1-\frac{I_{T2}}{I_{PD}} .$$$ (2)
The algorithm begins by iterating through each pixel in In which has a measured B1+ value. B1+ is used to reduce the Sn matrix to a single column, and the differences between the modified image point and Sn are computed, with the minimum difference chosen as the T2 value.
The two methods were compared using Bland-Altman analysis (12,13) of a five multiple sclerosis patient data set. All images were acquired using a Siemens Prisma 3 T scanner with an 80 mT/m gradient set and a 64-channel head and neck array for reception. Standard clinical PD-T2 parameters included: 16 echoes, TE1 = 10 ms, TE2 = 93 ms, 10 ms echo spacing, TR = 2500 ms, flip angle = 165°, 0.94 x 0.94 mm2 in-plane resolution with 3 mm slices (50 total) and TA = 2 min 43 s. A B1+ mapping sequence (14) was included to supply true flip angles to the mapping algorithms. Reconstruction was performed using a desktop PC (Quadcore Intel Core i5-6600, 16 GB RAM) and custom Matlab software. An additional healthy subject was recruited to test the feasibility of inline T2 map reconstruction on the MRI console.
Results
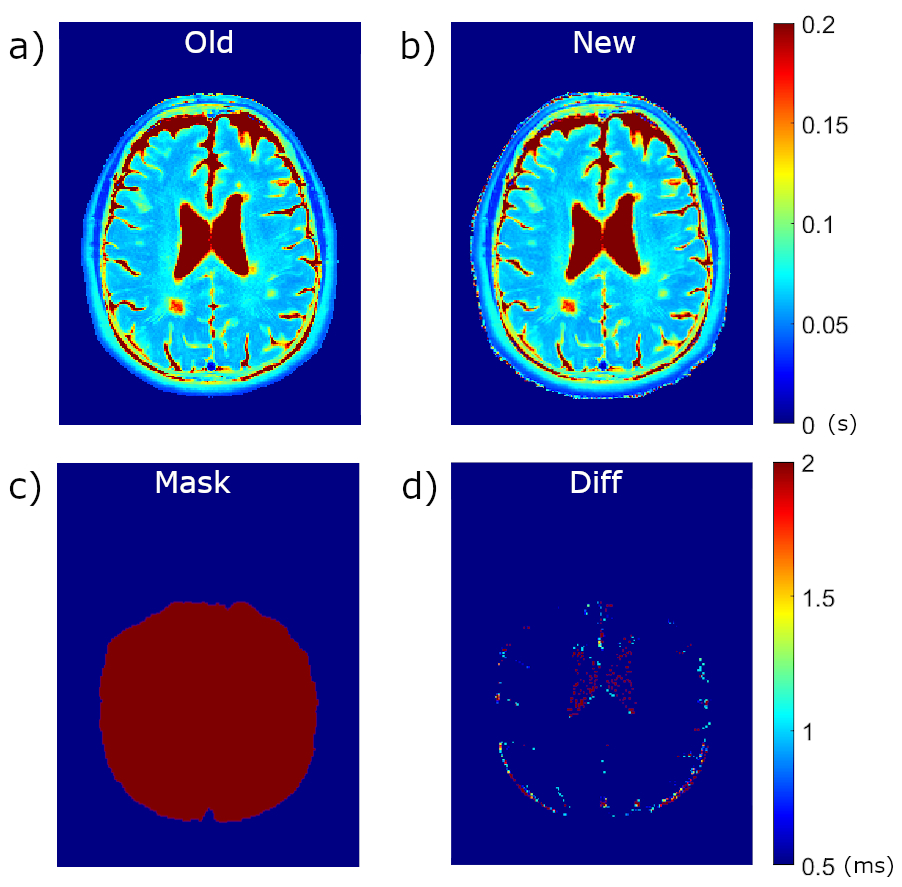
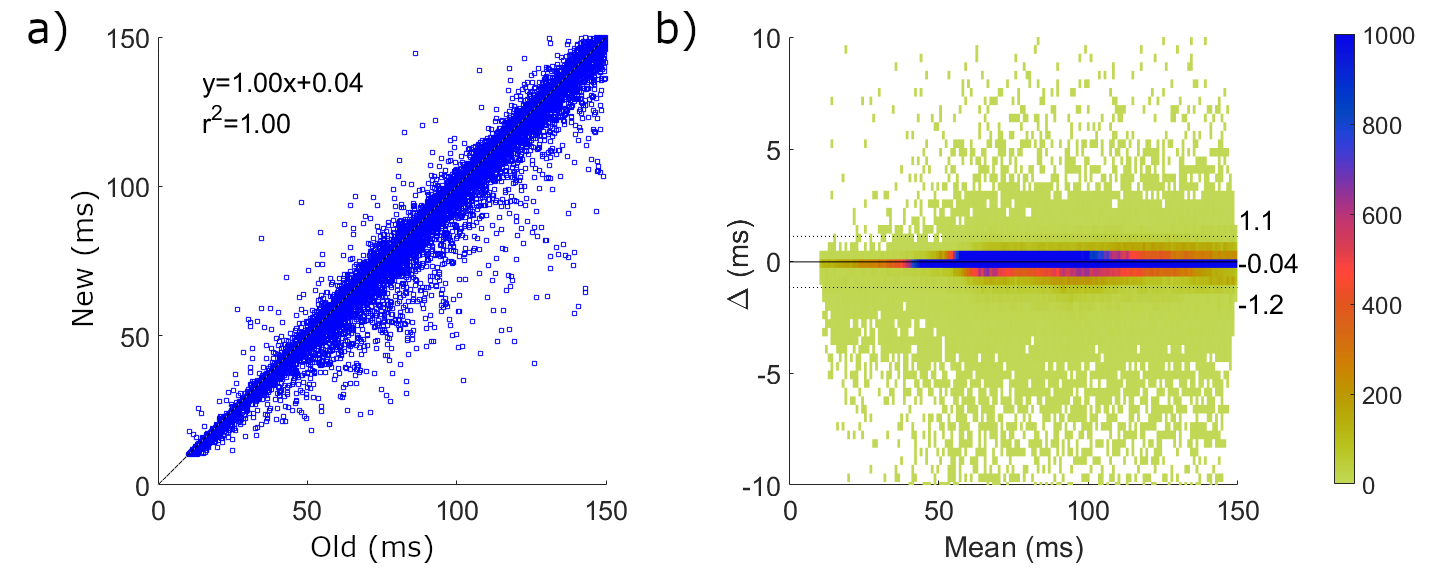
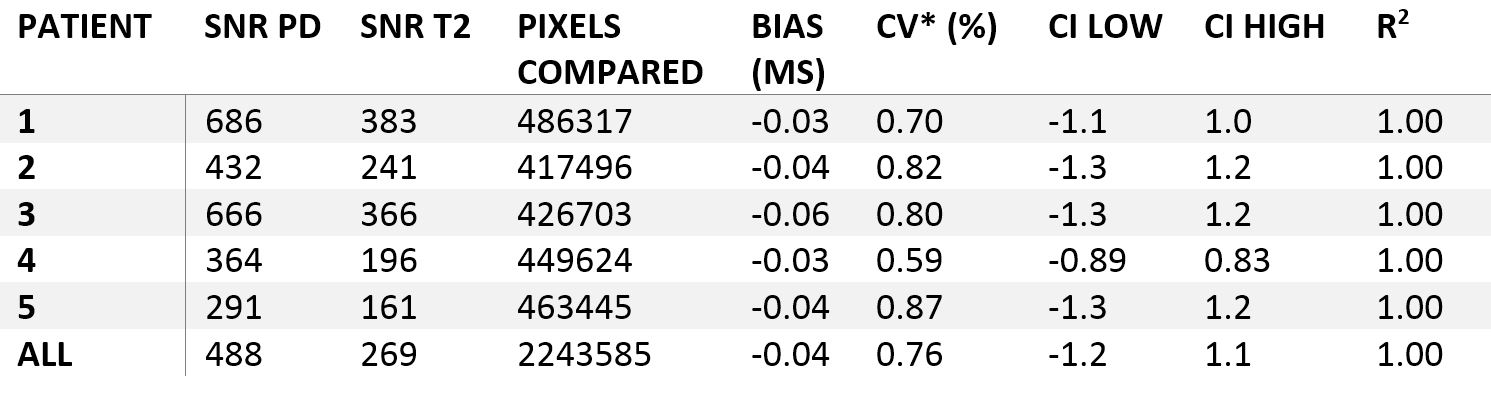
Average single slice reconstruction times for the five patients using the L2 norm method were 134 s compared to 0.61 s using the subtraction method, resulting in whole brain times of 6700 s and 30.5 s, respectively (a speed increase of 220x). T2 maps produced from the PD-T2 images and B1+ maps for the two methods for a single slice of Patient #2 are shown in Figure 1. Differences in 1d are scaled from 0.5 ms to 2.0 ms – all higher values show as red. The majority of T2 values between the two methods are identical with no contribution to the difference map. Areas showing the greatest difference occur at the borders to CSF and remaining scalp and bone, indicative of the difficulty of T2 mapping in these areas with extreme T2 values.A meta-analysis of each pixel in the five patient data set (2243585 pixels) is illustrated in the Bland-Altman plot in Figure 2. The confidence interval (CI) varies from -1.2 to 1.1 ms, indicating that 95% of all differences in T2 value between the old and new method are within this range. A significant concentration occurs near 0 (blue in 2b) with infrequent outliers (light colored). Statistics for Bland-Altman analysis for each subject are shown in Table 1.
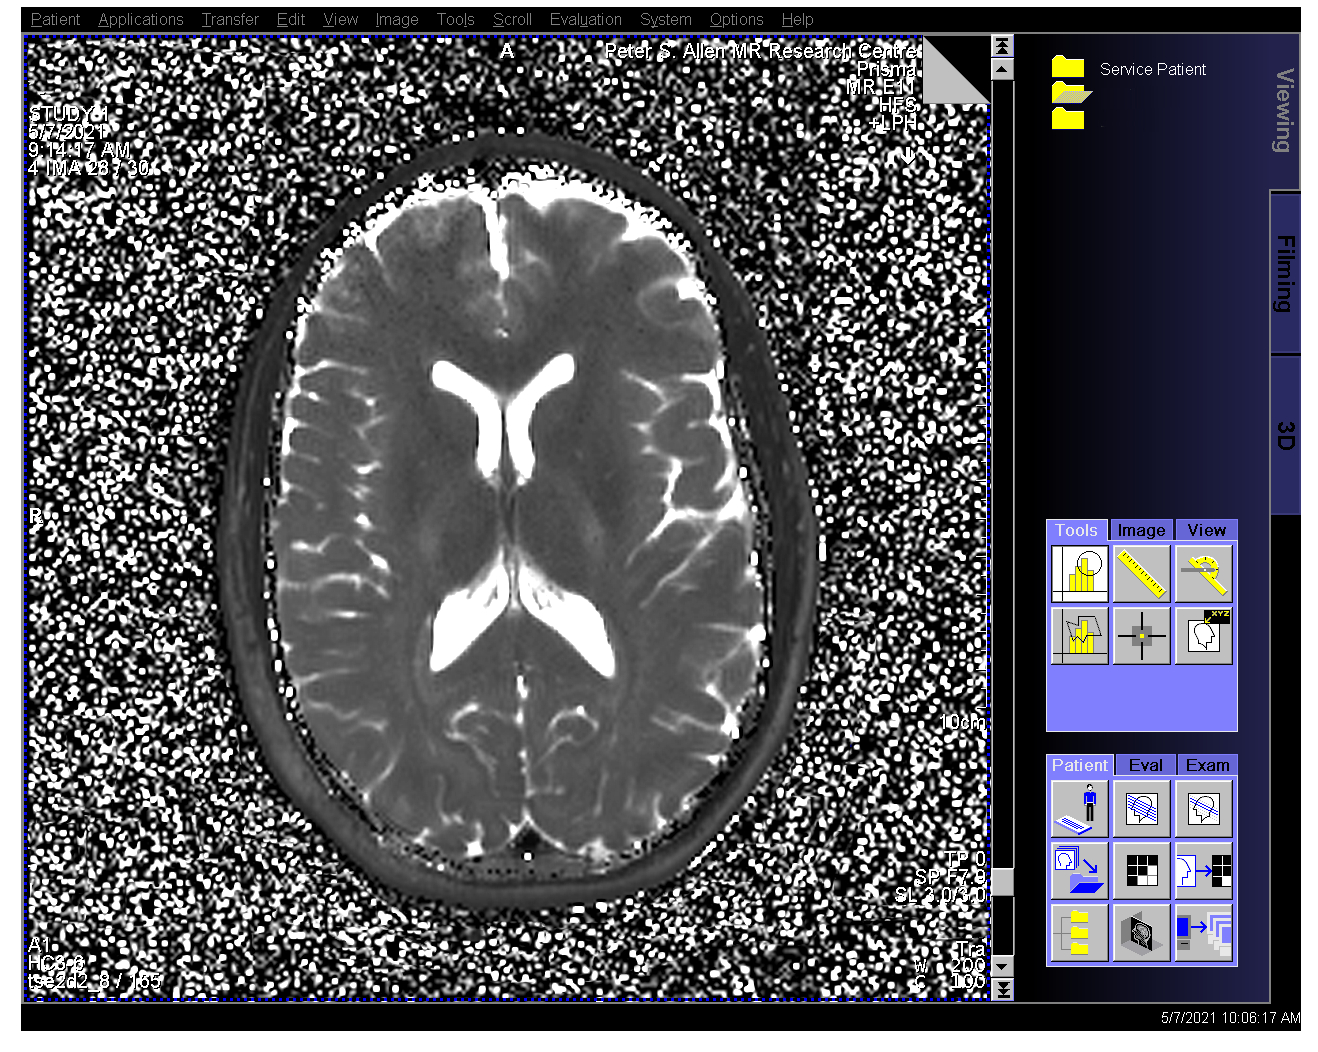
The fast reconstruction of the subtraction method map allowed evaluation of reconstruction on the MRI console, shown in Figure 3 for the non-MS subject. Computation time took 50 s for the 50 slice set, and DICOM images were then included within the study for further analysis.
Discussion
The new subtraction method has excellent agreement with the standard L2 norm method (with CI range of +1.2 ms), allowing interchangeability. While both methods can produce accurate T2 maps based on robust Bloch simulations, the speed of the subtraction method permits creation of inline T2 maps on the MRI console, allowing clinicians to immediately evaluate T2 maps concurrently with other study images without workflow interruptions, and increasing the applicability of quantitative MRI in clinical practice.Acknowledgements
The authors gratefully acknowledge funding from the Canadian Institutes of Health Research and the Natural Sciences and Engineering Research Council of Canada.
References
1. Uddin MN, Lebel RM, Seres P, Blevins G, Wilman AH. Spin echo transverse relaxation and atrophy in multiple sclerosis deep gray matter: A two-year longitudinal study: Mult. Scler. 2016;22(9):1133-43s doi: 10.1177/1352458515614091.
2. Vavasour IM, Huijskens SC, Li DK, et al. Global loss of myelin water over 5 years in multiple sclerosis normal-appearing white matter. Mult. Scler. 2018;24:1557–1568 doi: 10.1177/1352458517723717.
3. Biasiolli L, Lindsay AC, Chai JT, Choudhury RP, Robson MD. In-vivo quantitative T2 mapping of carotid arteries in atherosclerotic patients: Segmentation and T2 measurement of plaque components. J. Cardiovasc. Magn. Reson. 2013;15:1 doi: 10.1186/1532-429X-15-69.
4. Yuan C, Sun J. MR Quantification of Plaque Lipid Content: T2 Mapping Added to the Armamentarium. JACC Cardiovasc. Imaging 2017 doi: 10.1016/j.jcmg.2016.07.004.
5. Keerthivasan MB, Saranathan M, Johnson K, et al. An efficient 3D stack-of-stars turbo spin echo pulse sequence for simultaneous T2-weighted imaging and T2 mapping. Magn. Reson. Med. 2019;82:326–341 doi: 10.1002/mrm.27737.
6. Chen Y, Fang Z, Hung SC, Chang WT, Shen D, Lin W. High-resolution 3D MR Fingerprinting using parallel imaging and deep learning. Neuroimage 2020;206:116329 doi: 10.1016/j.neuroimage.2019.116329.
7. McPhee KC, Wilman AH. T 1 and T 2 quantification from standard turbo spin echo images. Magn. Reson. Med. 2019;81:2052–2063 doi: 10.1002/mrm.27495.
8. Radunsky D, Stern N, Nassar J, Tsarfaty G, Blumenfeld-Katzir T, Ben-Eliezer N. Quantitative platform for accurate and reproducible assessment of transverse (T2) relaxation time. NMR Biomed. 2021;34:e4537 doi: 10.1002/NBM.4537.
9. Ben-Eliezer N, Sodickson DK, Block KT. Rapid and accurate T2 mapping from multi-spin-echo data using bloch-simulation-based reconstruction. Magn. Reson. Med. 2015;73:809–817 doi: 10.1002/mrm.25156.
10. McPhee KC, Wilman AH. Transverse relaxation and flip angle mapping: Evaluation of simultaneous and independent methods using multiple spin echoes. Magn. Reson. Med. 2017;77:2057–2065 doi: 10.1002/mrm.26285.
11. McPhee KC, Wilman AH. T2 quantification from only proton density and T2-weighted MRI by modelling actual refocusing angles. Neuroimage 2015;118:642–650 doi: 10.1016/j.neuroimage.2015.05.079.
12. Martin Bland J, Altman DG. STATISTICAL METHODS FOR ASSESSING AGREEMENT BETWEEN TWO METHODS OF CLINICAL MEASUREMENT. Lancet 1986;327:307–310 doi: 10.1016/S0140-6736(86)90837-8.
13. Giavarina D. Understanding Bland Altman analysis. Biochem. Medica 2015;25:141–151 doi: 10.11613/BM.2015.015.
14. Sacolick LI, Wiesinger F, Hancu I, Vogel MW. B1 mapping by Bloch-Siegert shift. Magn. Reson. Med. 2010;63:1315–1322 doi: 10.1002/mrm.22357.
Figures