0430
Complex fitting of 1H-MR spectra improves quantification precision independent of SNR and noise correlation1Biomedical Engineering, Columbia University, New York, NY, United States, 2Radiology, Columbia University, New York, NY, United States
Synopsis
Quantification of in vivo proton magnetic resonance spectra (1H-MRS) still commonly involves evaluation of exclusively the real part of acquired spectral signals, but ignoring the information contained in the imaginary component may limit precise identification of individual metabolite contributions. Here, we assess quantification precision relative to SNR and noise correlation for both real and complex linear combination model fits of simulated 1H-MRS spectra reflecting brain metabolite concentrations and T2. Extending our results to inclusion of measured in vivo baselines, we demonstrate consistent improvements in metabolite quantification precision and/or accuracy by complex relative to real fits.
Purpose
In vivo proton magnetic resonance spectroscopy (1H-MRS) acquires complex signals from multiple small-molecule tissue metabolites later untangled by linear combination modeling1-3. This method estimates each metabolite’s signal as a known basis shape, to which transformations like amplitude scaling are applied and linearly combined with other bases, plus a baseline, to yield a model resembling the data. This procedure commonly employs only the real aspect of acquired spectra1-7, while the justification for disregarding the imaginary aspect is currently scarce.Assuming that including the imaginary spectral component in a fit doubles both signal trace and noise power, it also increases effective SNR by √2. SNR imposes metabolite- and baseline-specific effects on spectral quantification precision and accuracy8,9; and we hypothesize that effective SNR gains via complex fitting reduce quantification error with similar dependencies.
Here we examine spectral quantification errors for both real and complex fitting at varying SNR, noise correlation, and spectral baseline conditions to empirically demonstrate the degree to which the theoretical prediction of improved precision on complex versus real linear combination model fits is expressed in practice.
Methods
We analyzed differences in linear combination modeling error for real versus complex fits for both simulated Lorentzian singlets and in-vivo-like 3-Tesla 1H-MR spectra using INSPECTOR10 with additional scripting8,9.Singlets comprised one 7-Hz Lorentzian at 3.00 ppm at constant amplitude and 9 noise powers. Each noise power comprised 500 complex uncorrelated or correlated Gaussian noise patterns (seeds) modeling aberrations within domain-specific hardware channels and within-sample particulate Brownian motion, respectively. This generated 9 distinct SNRs with 500 corresponding spectra each for both uncorrelated and correlated noise (Fig. 1).
Uncorrelated noise FIDunc of amplitude input A0 was defined as:
$$FID_{unc}=A_{0}(x_{r}+ix_{i}) \\ x_{r}\leftarrow \mathcal{N}(0,1);\space x_{i}\leftarrow \mathcal{N}(0,1) $$
While correlated noise FIDcor was defined as:
$$FID_{cor} =A_{0}\sqrt 2 x_{m} e^{ix_{p}} \\ x_{m}\leftarrow \mathcal{N}(0,1);\space x_{p}\leftarrow \mathcal{U}(-\pi ,\pi ) $$
These were then quantified using a single Lorentzian basis spectrum, with only amplitude scaling solved by the fit.
A noiseless spectrum of 19 metabolites was simulated using MARSS11 and INSPECTOR based on literature-informed T2 and concentration values reflective, where possible, of semi-LASER measurement in occipital cortex grey matter (Fig 1B), and a semi-LASER sequence12 at 3 T with TE=20.1 ms. Constant starting signal amplitude and 6 noise amplitudes each with 500 complex Gaussian noise patterns for both uncorrelated and correlated conditions were applied (Fig. 1C). These were quantified using the same metabolite bases employed in simulation (Fig. 1B), with amplitude scaling, zero-order phase-correction, Lorentzian broadening, frequency shifting, and offset solved by the fits.
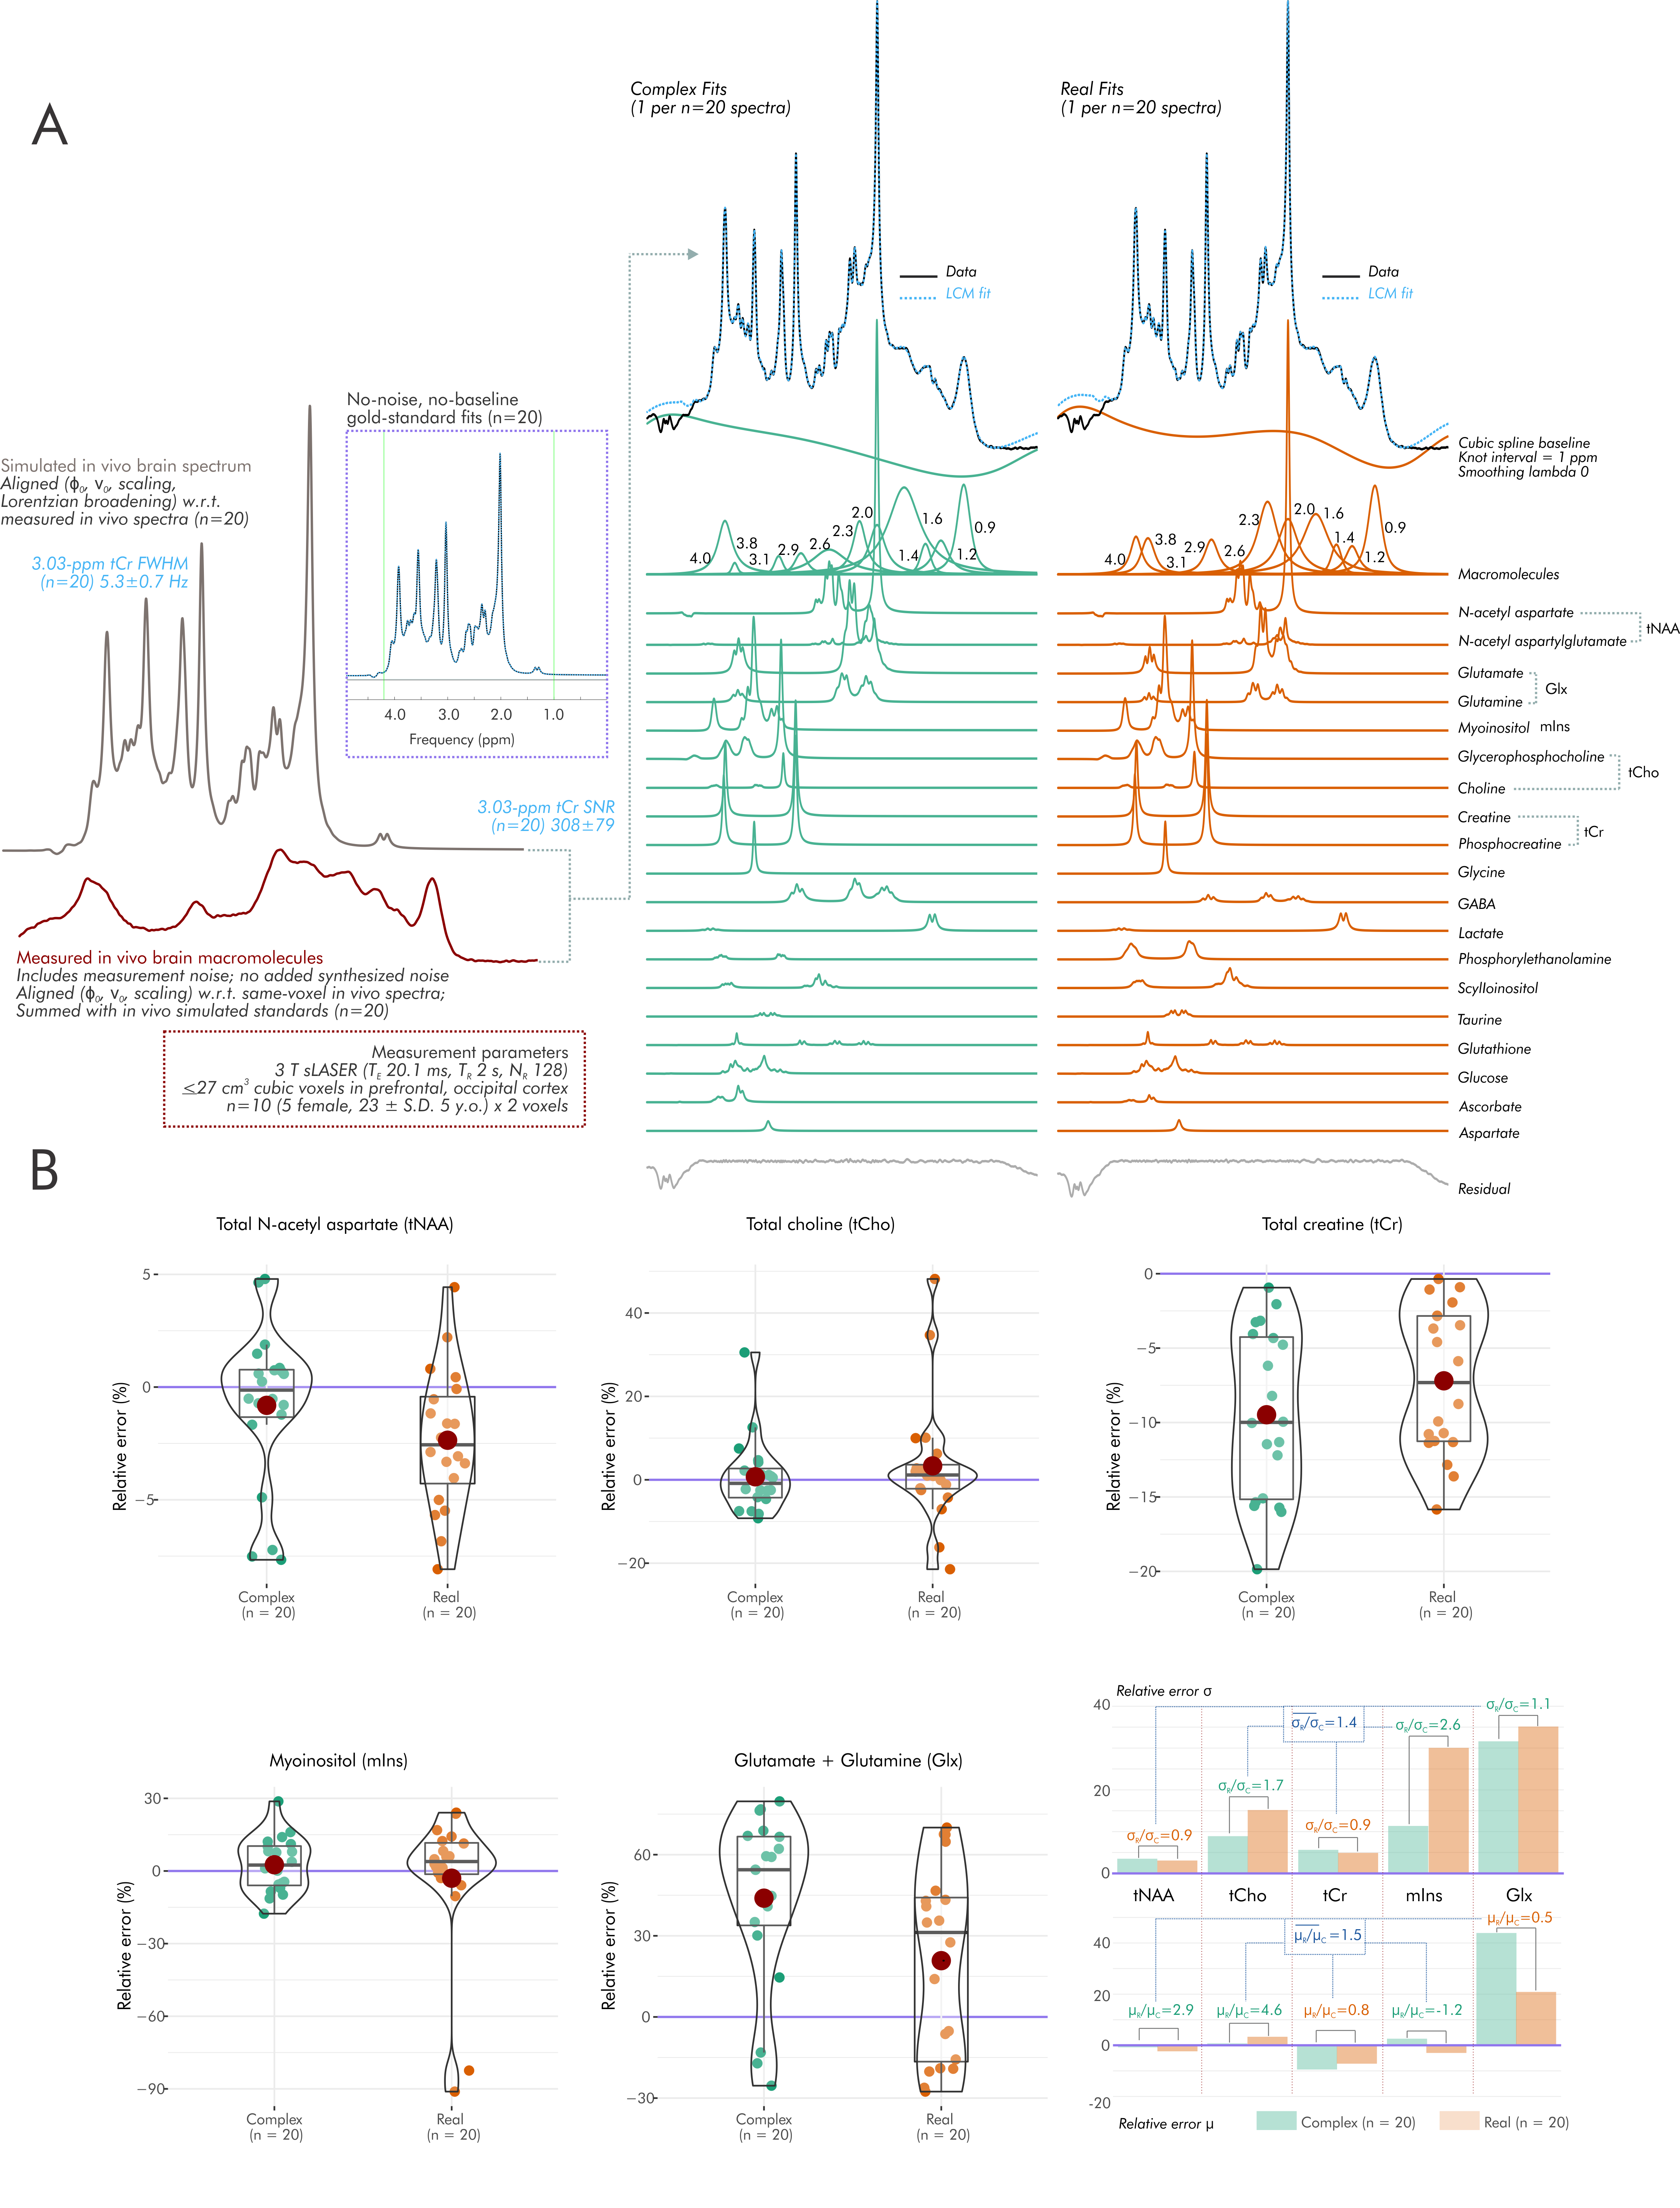
To assess spectral baseline influence, this condition was repeated using the same simulated brain spectrum summed with N=20 measured (3-T semi-LASER; TE=20.1 ms) macromolecule baselines from frontal and occipital cortices of N=10 participants (5 female; 23±5 y.o.)13 creating N=20 in-vivo-like gold-standard spectra as per methods previously detailed14. No additional noise was synthesized. Fits proceeded as before, with additional simulated macromolecule resonances and cubic spline baselines (knot interval 1 ppm; no smoothing) (Fig. 5A).
All quantification errors were quantified relative to gold-standard "perfect" zero-residual fits to no-noise, no-baseline versions of each spectrum analyzed.
Results
For singlets, real fits consistently demonstrated error standard deviations about √2 higher than those of complex fits independent of SNR and noise correlation, with some variability between the two sets of simulated noise seeds for each condition (Fig. 2).For simulated brain spectra, complex fitting also consistently yielded lower error standard deviations than real fits. As with singlet fits the improvement provided by complex fitting became slightly less pronounced at the lowest SNR values regardless of noise correlation (Figs. 3-4).
For simulated brain spectra including measured macromolecule baselines, average error standard deviation and magnitude were also greater for real than complex fits, with individual differences by metabolite (Fig. 5).
Conclusions
Here we have shown the following:- Employing the full complex instead of strictly real data consistently increases the precision and/or accuracy of metabolite amplitude estimates by linear combination modeling.
- Within the context of brain spectra, the degree of precision improvement for complex vs. real fits depends on both metabolite and spectral SNR, a difference from singlet fits possibly deriving from variations in effective signal and overlap among metabolites.
- For in vivo spectra including measured macromolecule baselines, general improvements in average metabolite estimate precision and accuracy are also seen with complex versus real fits, albeit with greater metabolite dependence.
Taken together, our findings underline the potential improvements in quantification that may be drawn from readily available spectral data. As in previous work8,9,14,15 this approach may inform future studies investigating the precision and accuracy of spectral fit procedures, with further consideration of more varied baselines and modeling techniques for consolidating results generalizable to broad in vivo conditions.
Acknowledgements
This work was performed at the Zuckerman Mind Brain Behavior Institute MRI Platform, a shared resource. In vivo measurements were derived from research conducted in accordance with Columbia University Institutional Review Board protocol AAAQ9641.References
1. Provencher SW. Estimation of metabolite concentrations from localized in vivo proton NMR spectra. Magnetic Resonance in Medicine 30:672-679 (1993).
2. Provencher SW. LCModel & LCMgui User’s Manual 2021.
3. Near J, Harris AD, Juchem C, Kreis R, Marjańska M, Öz G, Slotboom J, Wilson M, and Gasparovic C. Preprocessing, analysis and quantification in single-voxel magnetic resonance spectroscopy: Experts' consensus recommendations. NMR in Biomedicine 34 (5), e4257 (2021).
4. Zöllner HJ, Povazan M, Hui SCN, Tapper S, Edden RAE, and Oeltzschner G. Comparison of different linear-combination modeling algorithms for short-TE proton spectra. NMR in Biomedicine 34(4):e4482 (2021).
5. Mierisova S and Ala-Korpela M. MR spectroscopy quantitation: A review of frequency domain methods. NMR in Biomedicine 14:247–259 (2001).
6. Xu K, Sigurdsson S, Gudnason V, Hue T, Schwartz A, and Li X. Reliable quantification of marrow fat content and unsaturation level using in vivo MR spectroscopy. Magnetic Resonance in Medicine 79:1722–1729 (2018).
7. Swanberg KM, Landheer K, Pitt D, and Juchem C. Quantifying the metabolic signature of multiple sclerosis by in vivo proton magnetic resonance spectroscopy: Current challenges and future outlook in the translation from proton signal to diagnostic biomarker. Frontiers in Neurology 10(1173) (2019).
8. Swanberg KM, Prinsen H, and Juchem C. Spectral quality differentially affects apparent concentrations of individual metabolites as estimated by linear combination modeling of in vivo MR spectroscopy data at 7 Tesla. Proc Int Soc Magn Reson Med 4327 (2019).
9. Swanberg KM, Landheer K, Gajdošík M, Treacy MS, and Juchem C. Hunting the perfect spline: Baseline handling for accurate macromolecule estimation and metabolite quantification by in vivo 1H MRS. Proc Int Soc Magn Reson Med 2856 (2020).
10. Gajdošík M, Landheer K, Swanberg KM, and Juchem C. INSPECTOR: Free software for magnetic resonance spectroscopy data Inspection, processing, simulation and analysis. Scientific Reports 11, 2094 (2021).
11. Landheer K, Swanberg KM, and Juchem C. Magnetic resonance Spectrum simulator (MARSS), a novel software package for fast and computationally efficient basis set simulation. NMR in Biomedicine 34:e4129 (2021).
12. Landheer K, Gajdosik M, and Juchem C. A semi-LASER, single-voxel spectroscopic sequence with a minimal echo time of 20.1 ms in the human brain at 3 T. NMR in Biomedicine 33:e4324 (2020).
13. Landheer K, Gajdošík M, Treacy M, Juchem C. Concentration and effective T2 relaxation times of macromolecules at 3T. Magn Reson Med 84(5):2327-2337 (2020).
14. Swanberg KM, Gajdošík M, Landheer K, and Juchem C. Computation of Cramér-Rao Lower Bounds (CRLB) for spectral baseline shapes. Proc Int Soc Magn Reson Med 2010 (2021).
15. Landheer K, Juchem C. Are Cramer-Rao lower bounds an accurate estimate for standard deviations in in vivo magnetic resonance spectroscopy? NMR in Biomedicine (34):e4521. (2021)
16. Wyss PO, Bianchini C, Scheidegger M, Giapitzakis IA, Hock A, Fuchs A, and Henning A. In vivo estimation of transverse relaxation time constant (T2) of 17 human brain metabolites at 3T. Magnetic Resonance in Medicine 80(2):452-461 (2018).
17. Tkác I, Öz G, Adriany G, Ugurbil K, and Gruetter R. In Vivo 1H NMR spectroscopy of the human brain at high magnetic fields: Metabolite quantification at 4T vs. 7T. Magnetic Resonance in Medicine 62:868 – 879 (2009).
18. Hurd R, Sailusata N, Srinivasan R, Vigneron DB, Pelletier D, and Nelson SJ. Measurement of brain glutamate using TE-Averaged PRESS at 3T. Magnetic Resonance in Medicine 51:435– 440 (2004).
19. Edden RAE, Intrapiromkul J, Zhu H, Cheng Y, and Barker PB. Measuring T2 in vivo with J-difference editing: Application to GABA at 3 Tesla. Journal of Magnetic Resonance Imaging 35(1): 229–234 (2012).
Figures
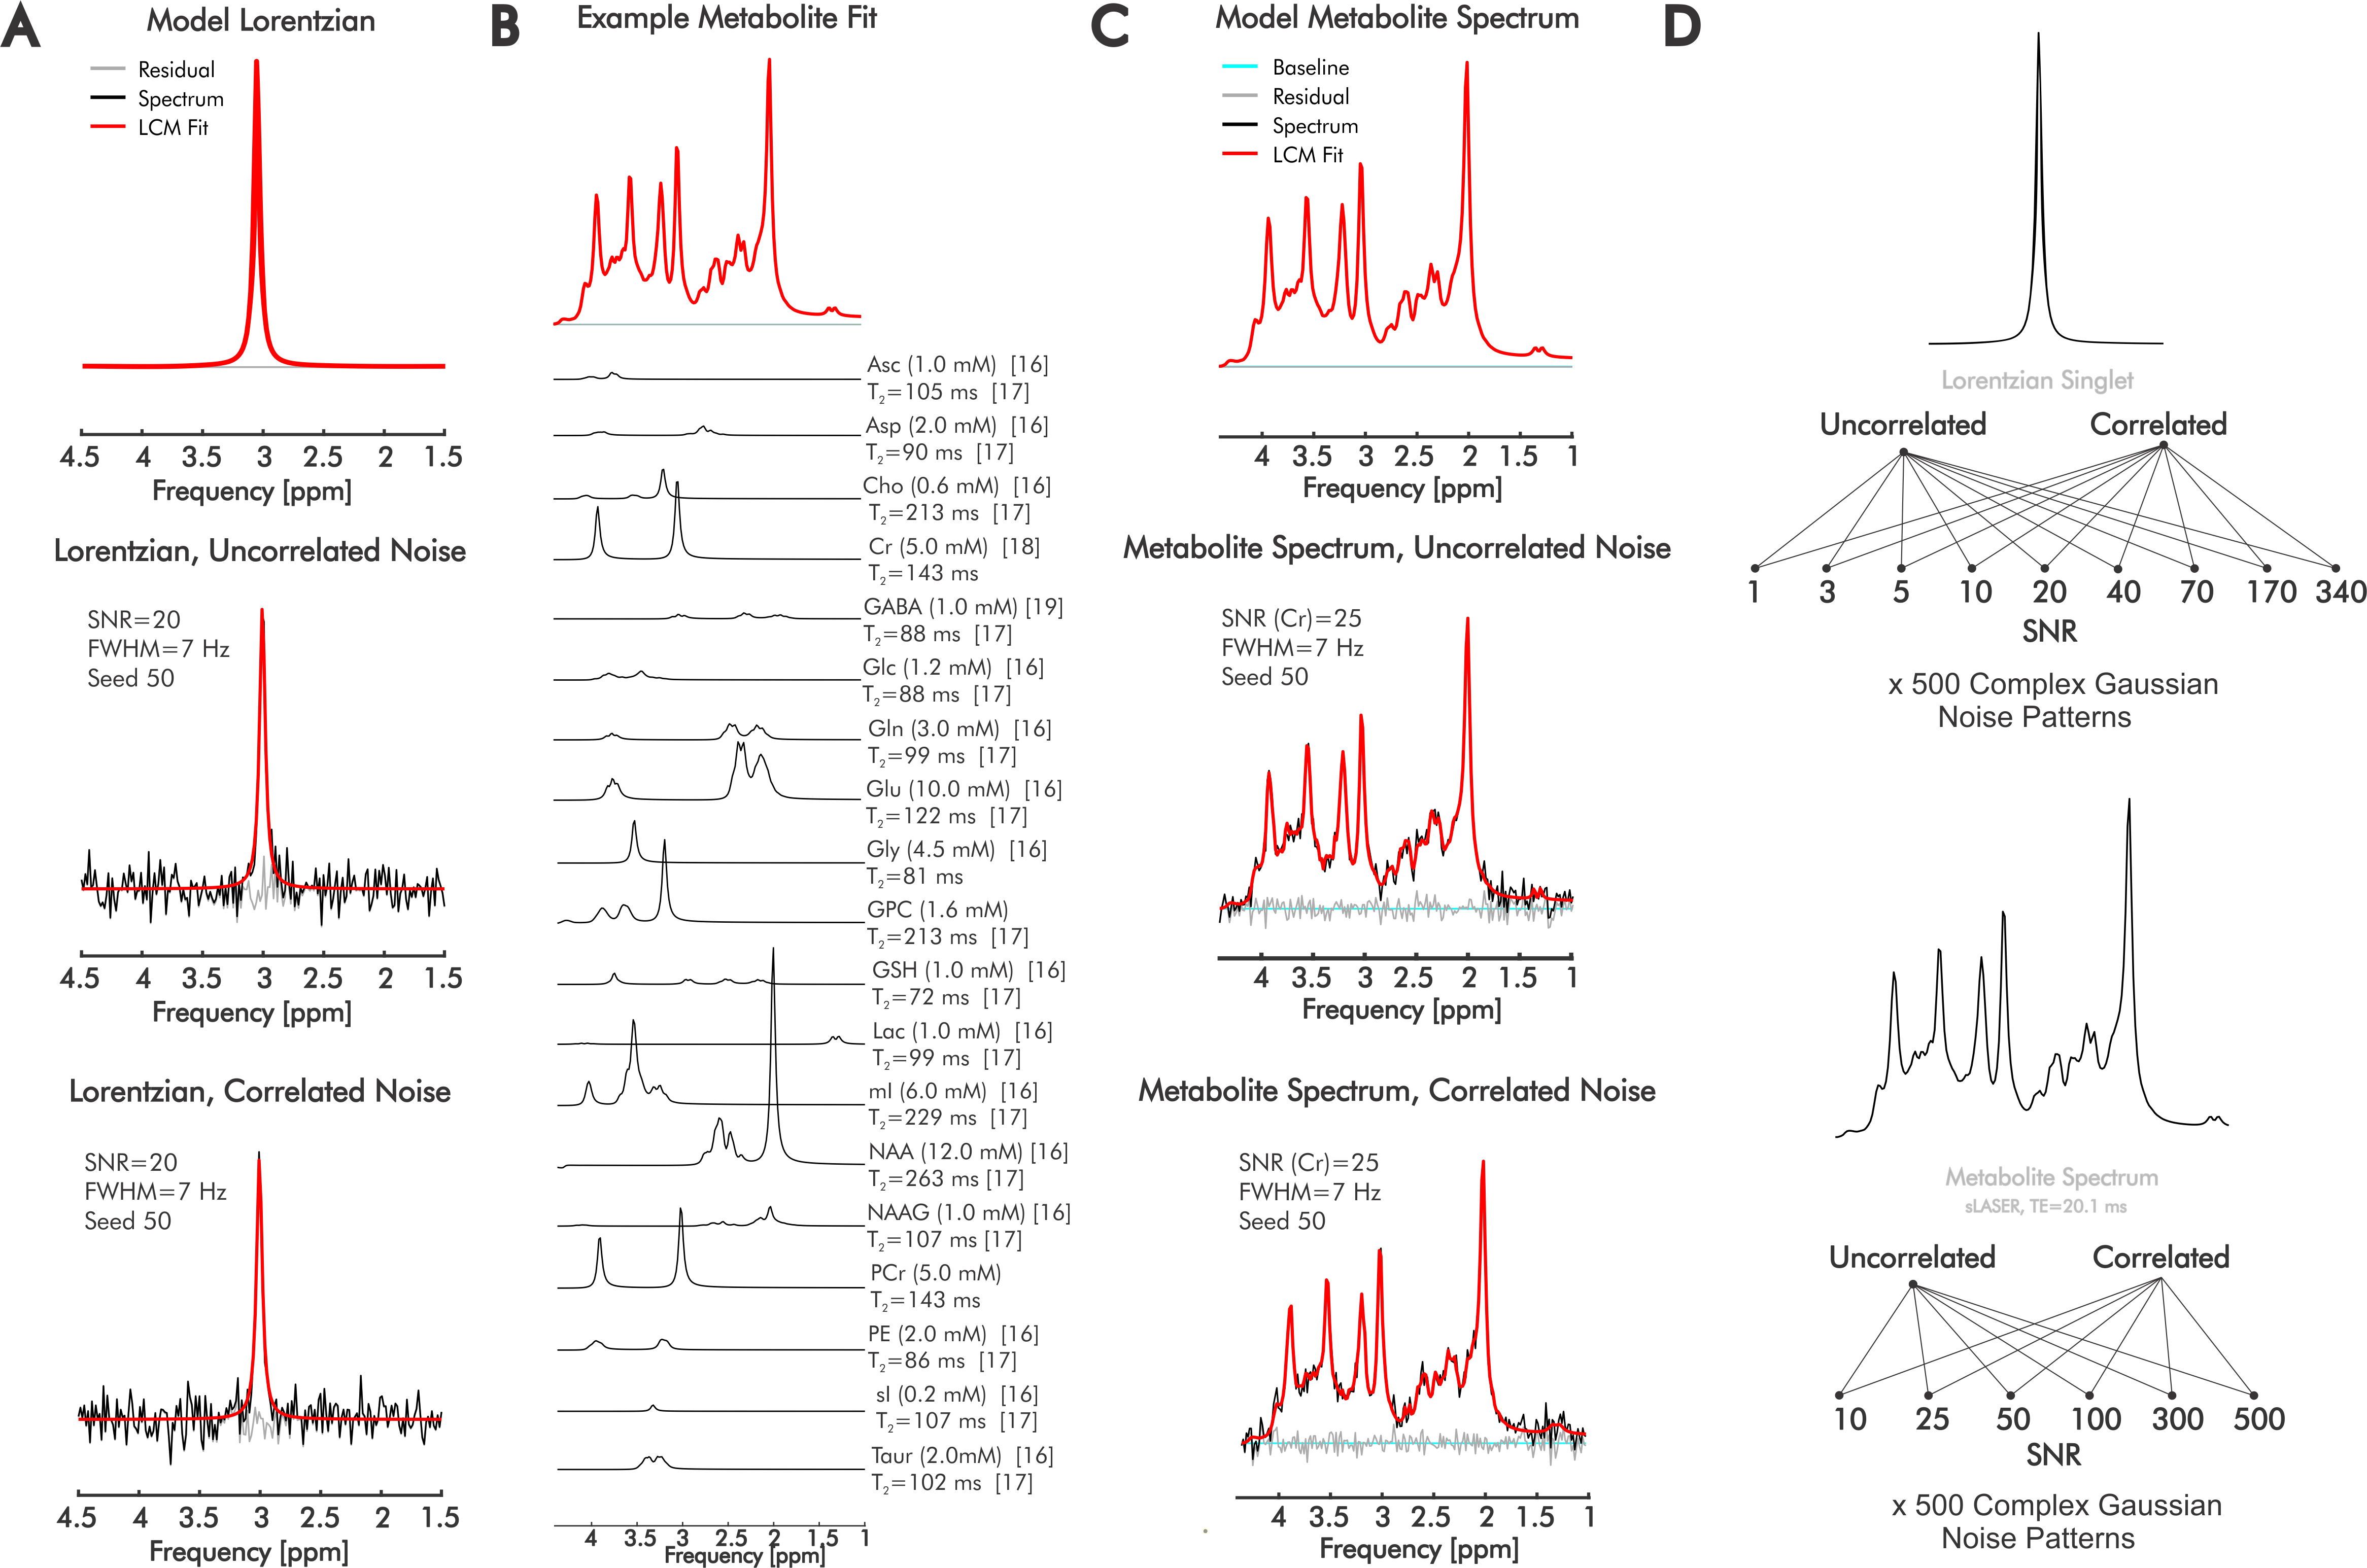
Figure 1. Spectral simulation and error assessment. We analyzed quantification error for complex and real fitting schemes using linear combination modeling for both A) simulated Lorentzian singlets and B,C) simulated 3T sLASER (TE=20.1 ms) metabolite spectra at varying SNRs and noise correlations. Metabolite concentrations and T2 are derived via literature values from sLASER in occipital cortex grey matter when possible (references bracketed). SNR=signal-to-noise ratio; FWHM=Full-width at half-maximum; TE= echo time; ppm=parts-per-million
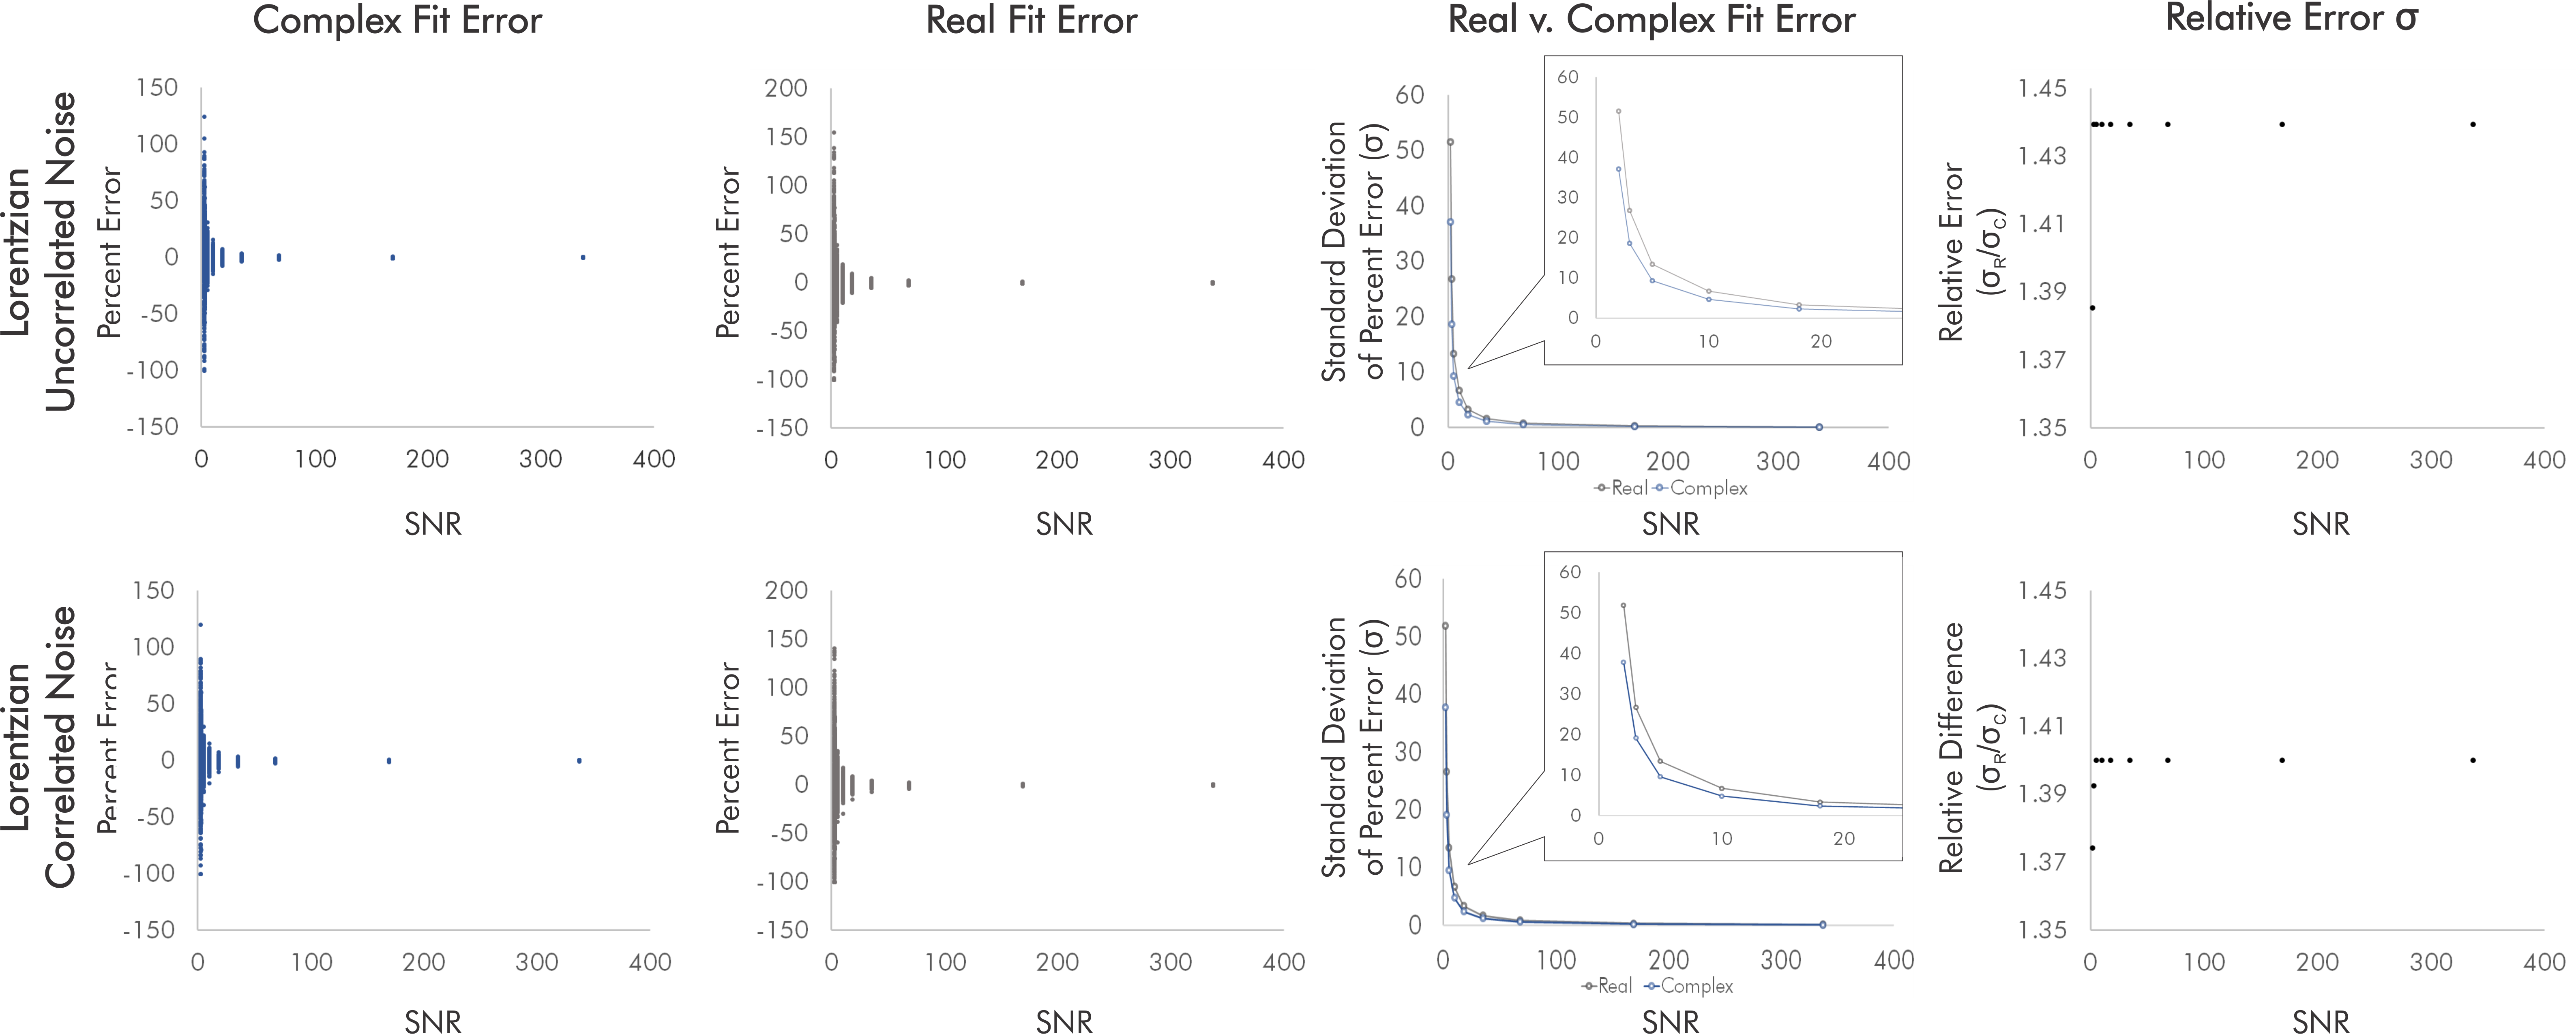
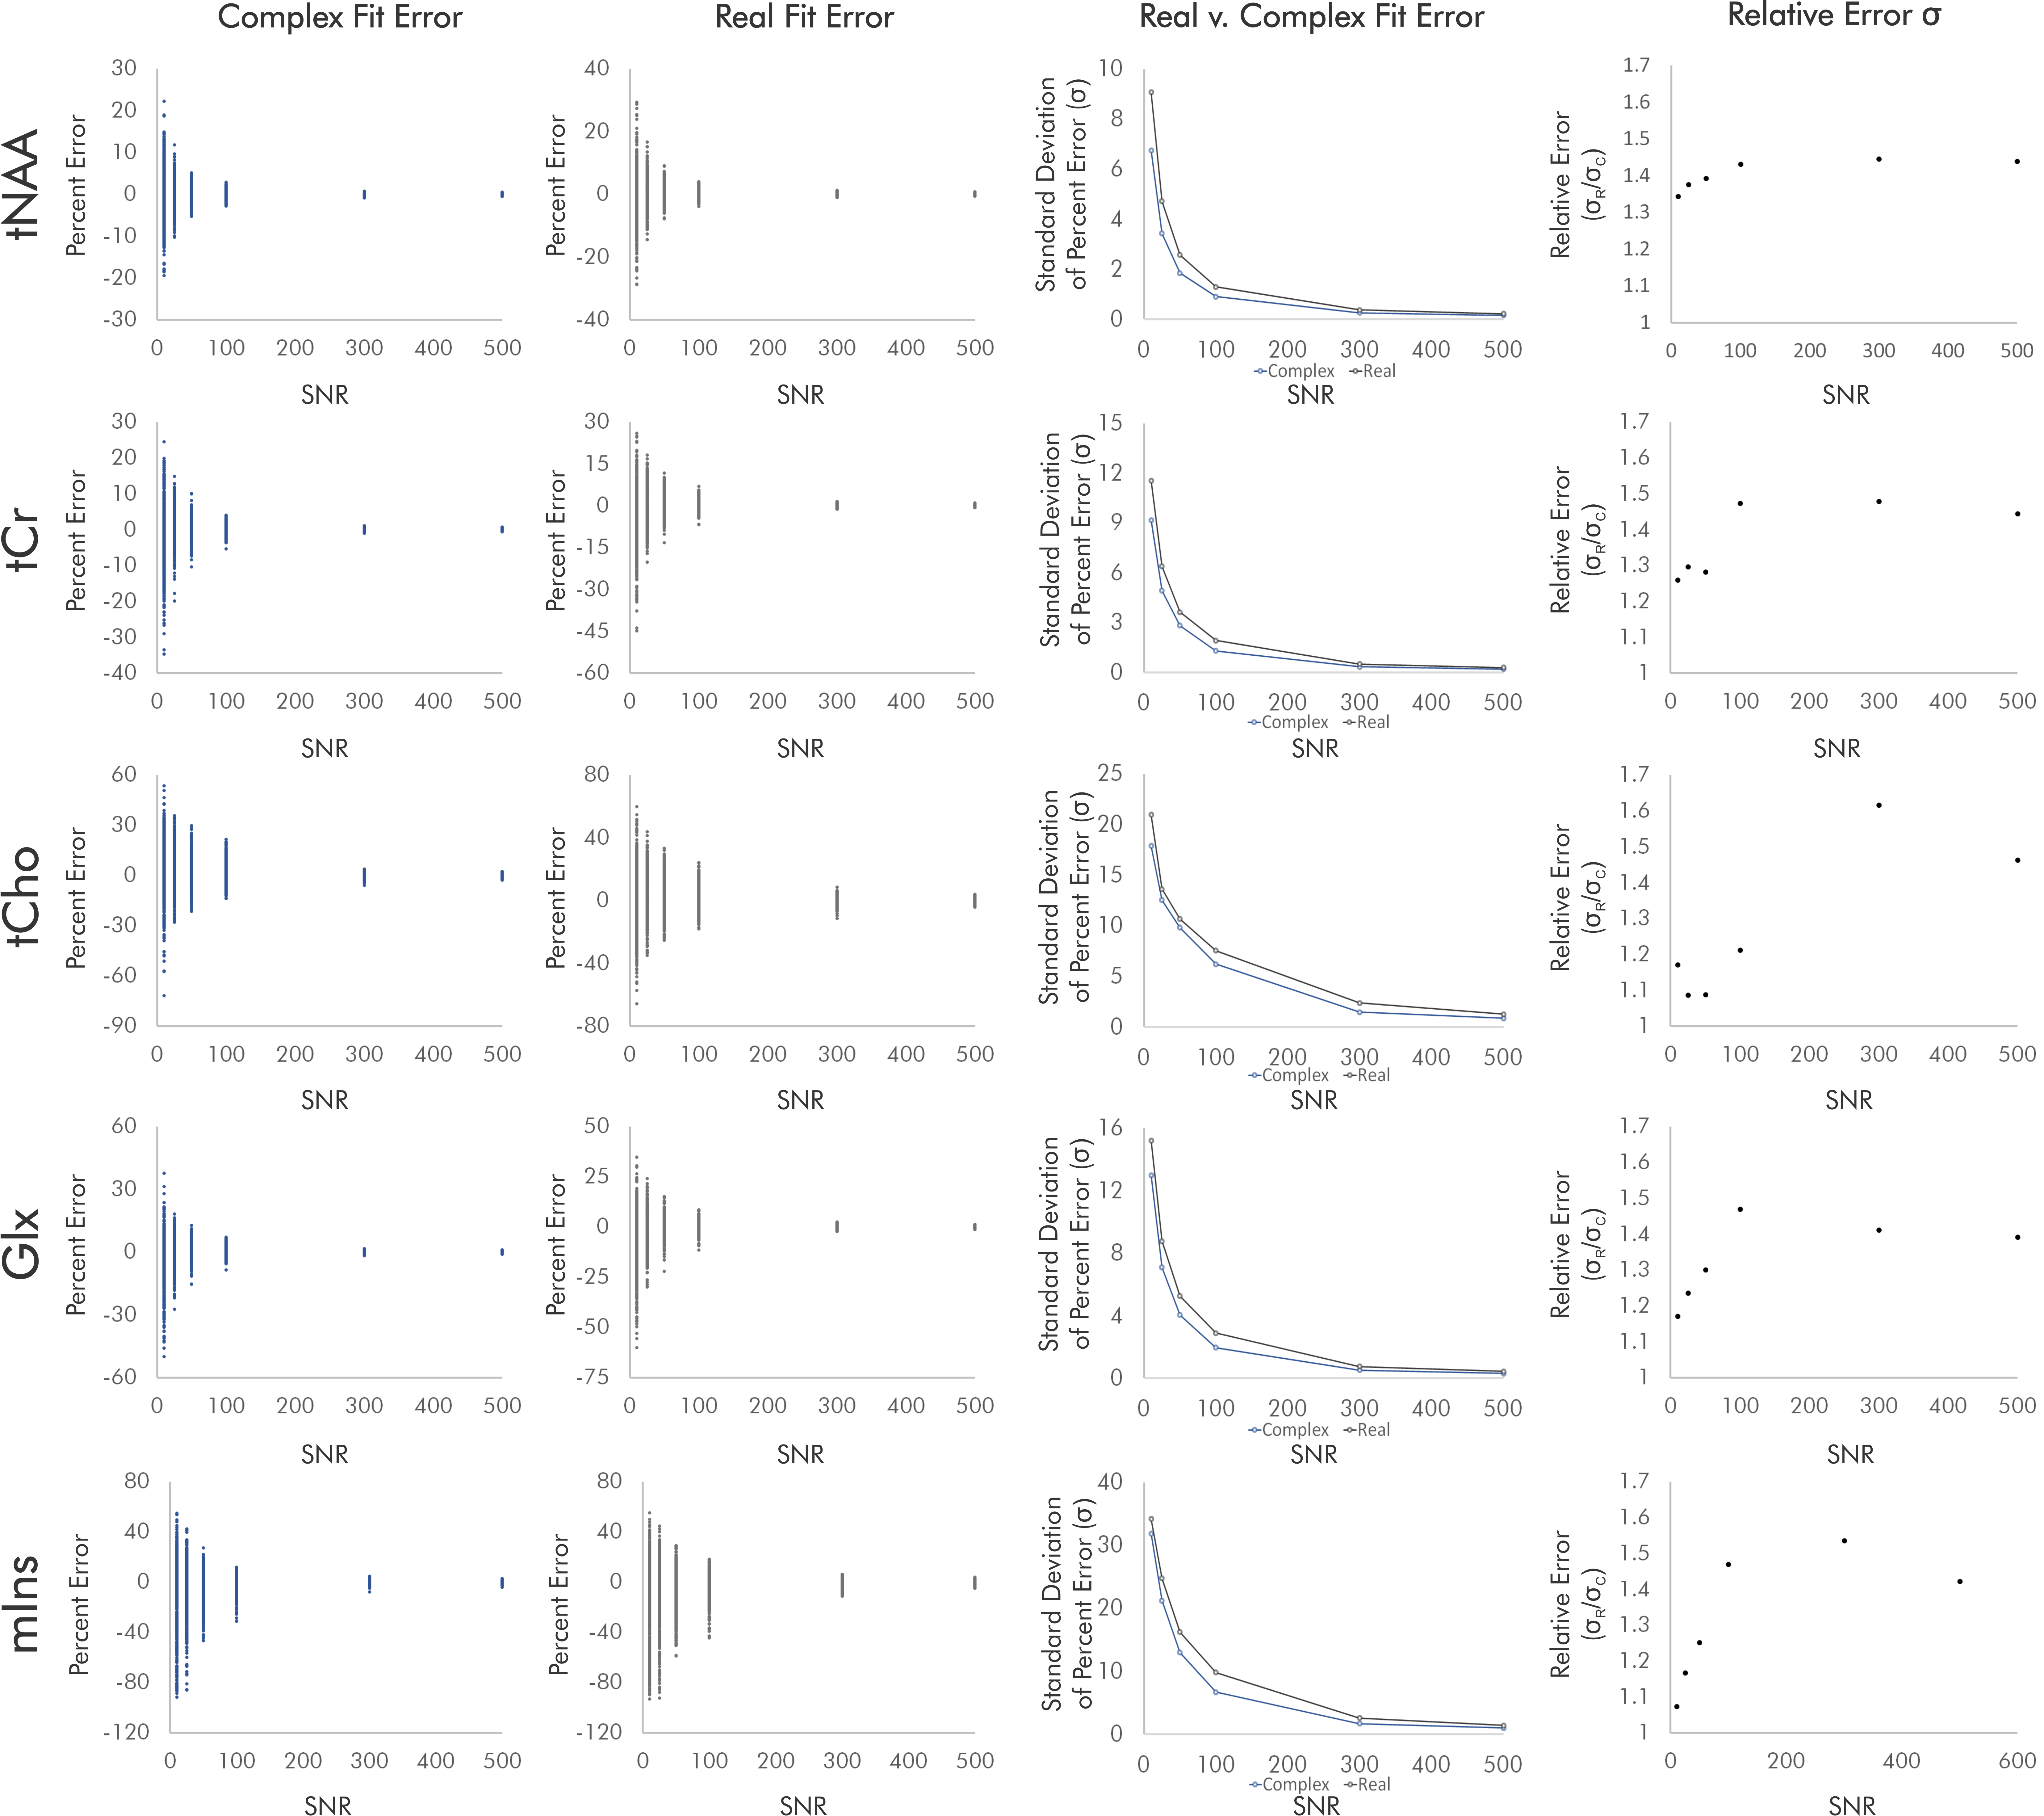
Figure 3. Quantification errors for brain metabolite spectra with uncorrelated noise. The increase in quantification error from real versus complex fitting varied with SNR as precision gains from complex fitting dropped slightly at the lowest SNRs. Although the degree of improvement varies with metabolite and SNR, complex fitting continues to consistently and systematically improve quantification precision independent of these factors.
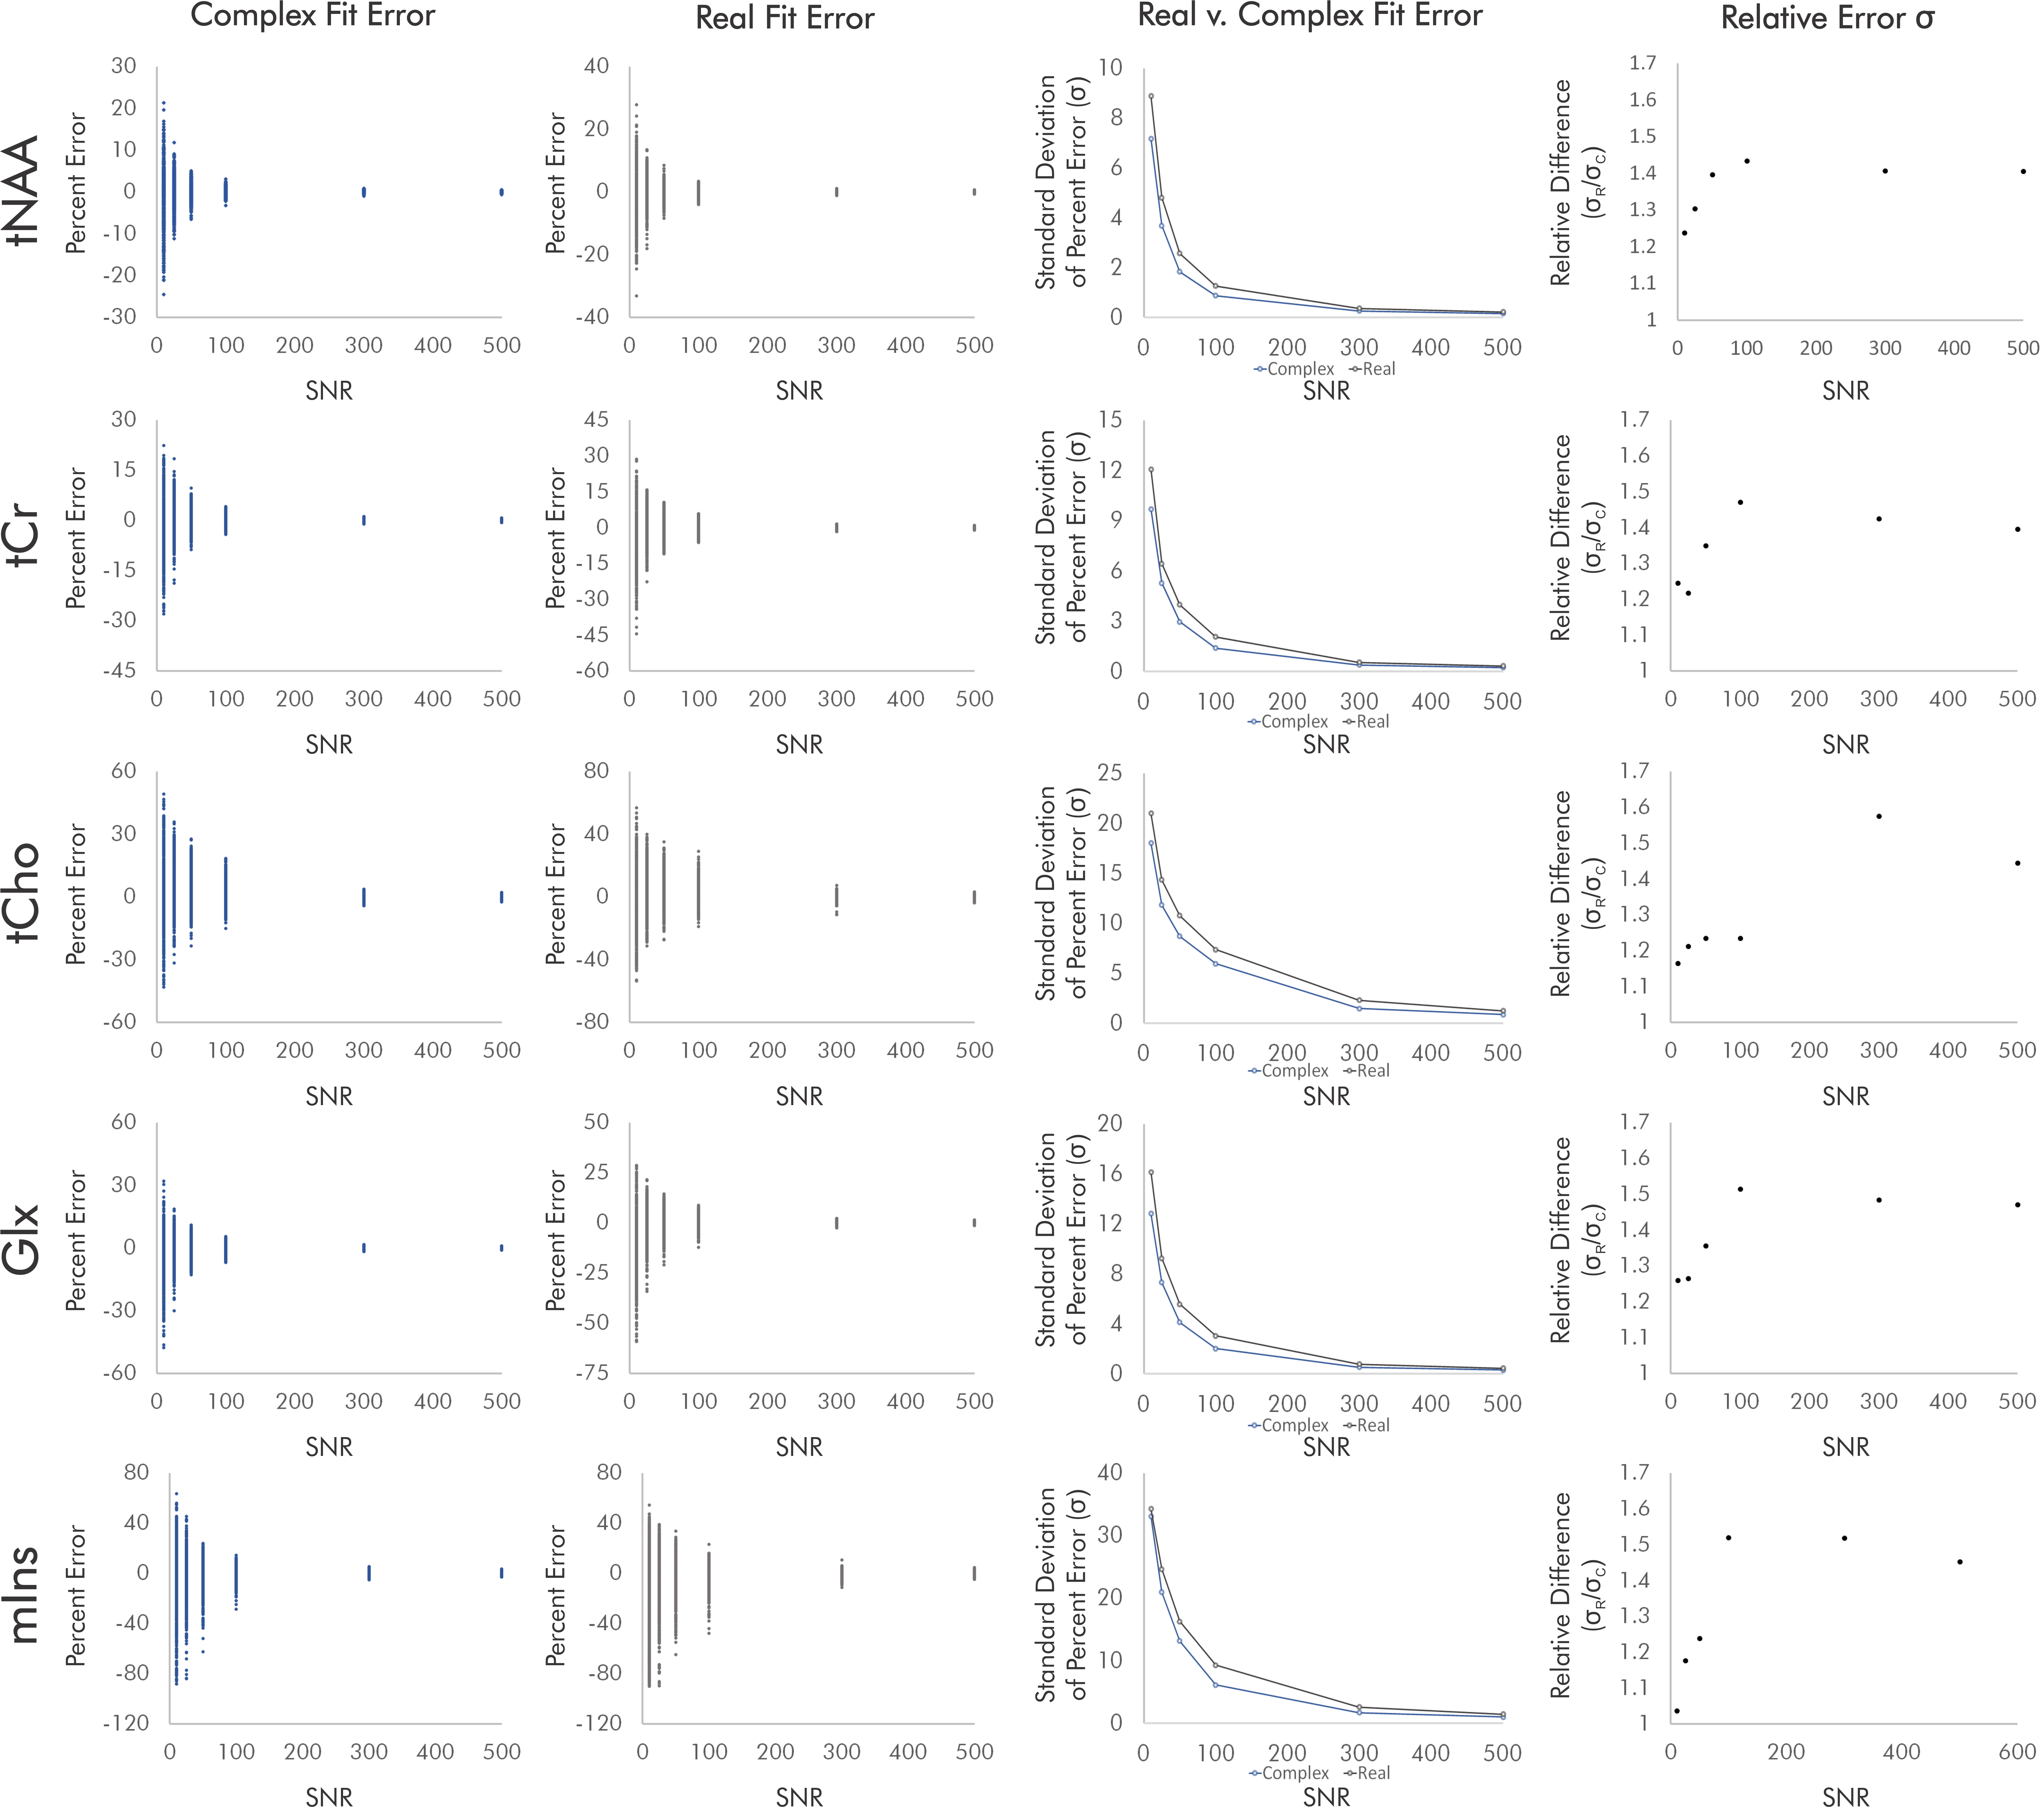
Figure 4. Quantification errors for brain metabolite spectra with correlated noise. As with the uncorrelated noise condition, complex fits systematically improved quantification precision, with precision gains dropping slightly at the lowest-SNR conditions. SNR and noise correlation effects on precision gains were slight and varied by metabolite, potentially as a result of metabolite-specific signal amplitudes and spectral overlap.