0429
Improving myelin water mapping using a new data-driven paradigm for multicomponent analysis of T2 relaxation times1Biomedical Engineering, Tel Aviv University, Tel Aviv, Israel, 2Department of Computer Science and Applied Mathematics, Weizmann Institute of Science, Rehovot, Israel, 3Sagol School of Neuroscience, Tel Aviv University, Tel Aviv, Israel, 4Center for Advanced Imaging Innovation and Research (CAI2R), New-York University Langone Medical Center, New York, NY, United States
Synopsis
The common approach to myelin mapping relies on multi-T2 component (mcT2) analysis, where the signal from a single voxel is separated into its underlying distribution of T2 values. This approach is highly challenging due to the ill posedness of extracting multiple free parameters from a single voxel data. We present a new data-driven paradigm, where the white matter is first analyzed to identify a finite set of multi-T2 distributions, which are then used to locally analyze the signal in each voxel. Application on white matter tissue produced improved myelin quantifications, without a priory fixing the number of sub-voxel compartments.
Introduction
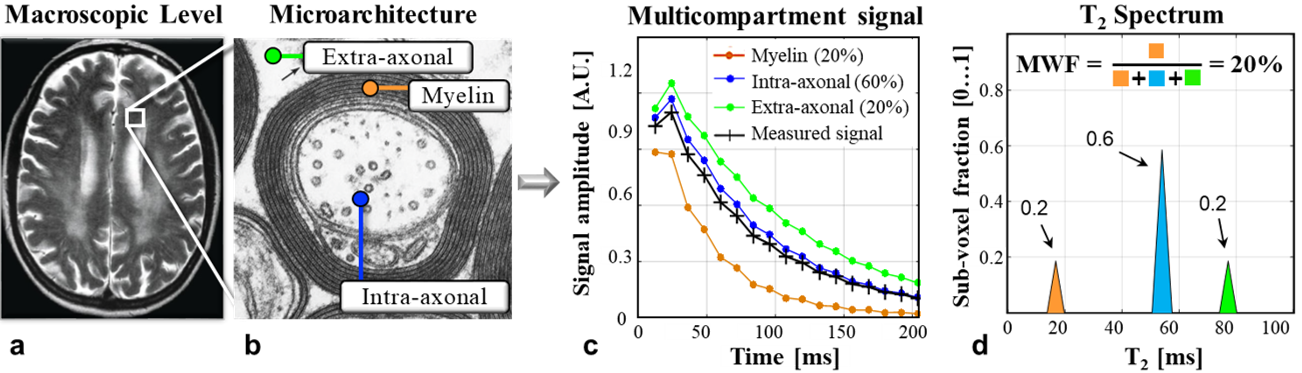
Multicomponent analysis of T2 values (mcT2) allows probing sub-voxel information on microscopic water environments by assessing their relative fraction and T2 relaxation times (T2). Typically, mcT2 is applied to white matter (WM) tissue for estimating the relative fraction of water that reside between the myelin sheaths1. The ensuing myelin water fraction (MWF) correlates with myelin content2 and therefore used as a biomarker for studying neurodegenerative diseases3-6. This analysis is based on separating the multi-echo spin-echo (MESE) signal in each voxel into a distribution of T2 values7. The MWF is then calculated as the relative energy between 10-40 ms, having relatively short T2 compared to intra/extra-cellular water (40-200 ms)2 ($$$\scriptsize\color{blue} {Figure 1}$$$).Conventional mcT2 fitting procedures apply the regularized non-negative least squares (rNNLS) algorithm8 and consider the voxel signal Svoxel as a weighted combination of multiple single-T2 signals:
$$S_{voxel}=\sum_{m=1}^{nT_{2}}w_{m}S_{m}^{T_{2}}$$
where $$$nT_2$$$ is the number of single-T2 signals $$$S_{m}^{T_{2}}$$$ and $$$w_{m}$$$ is the weight of the single-T2 signal. This mcT2 fitting task involves matrix inversion which is ill-conditioned, and highly sensitive to noise and to the choice of regularization weights7,9,-10, resulting in grainy MWF maps indicating zero values in myelinated voxel at clinical signal-to-noise ratios (SNR)11.
Recently, a new data-driven paradigm for mcT2 analysis12 was suggested as a reliable alternative approach13-14. This approach suggests applying a pre-processing step, which first identifies a set of multicomponent combinations of single-T2 signals (i.e. mcT2 motifs) which best describe the WM segment being analyzed, and using these as basis set, describing the signal at each voxel:
$$S_{voxel}=\sum_{m=1}^{L}\omega_{m}S_{m}^{mcT_{2}}$$
where $$$\omega_{m}$$$ is the weight of the mth mcT2 motif $$$S_{m}^{mcT_{2}}$$$.
In this study we demonstrate how the adoption of this data-driven paradigm, prior to applying the conventional rNNLS fitting, improves the quantification of MWF. To that end, we compare between MWF maps that were obtained with and without the data-driven preprocessing step. Validations are shown on a numerical phantom at varying SNR levels, and on human brain data.
Methods
Data-driven identification of mcT2 motifsThe data-driven algorithm was applied on the entire WM, using a mask generated by FreeSurfer15 (eroded by one pixel). The algorithm was initialized with a large dictionary containing over than 3 million simulated mcT2 motifs14, covering the physiological range of WM tissue parameters. All mcT2 motifs were generated from a set of 64 single-T2 values logaritmic-spaced between 1-800 ms and weighted by fractions between 0...1 in jumps of 0.05. The data-driven step identified a set of L=30 mcT2 motifs that were used as basis signal components for the inversion.
MWF quantification was done using an in-house implementation of the conventional rNNLS algorithm7,16 added with second-order Tikhonov regularization weighted by λtik=0.01.
Conventional versus data-driven MWF mapping
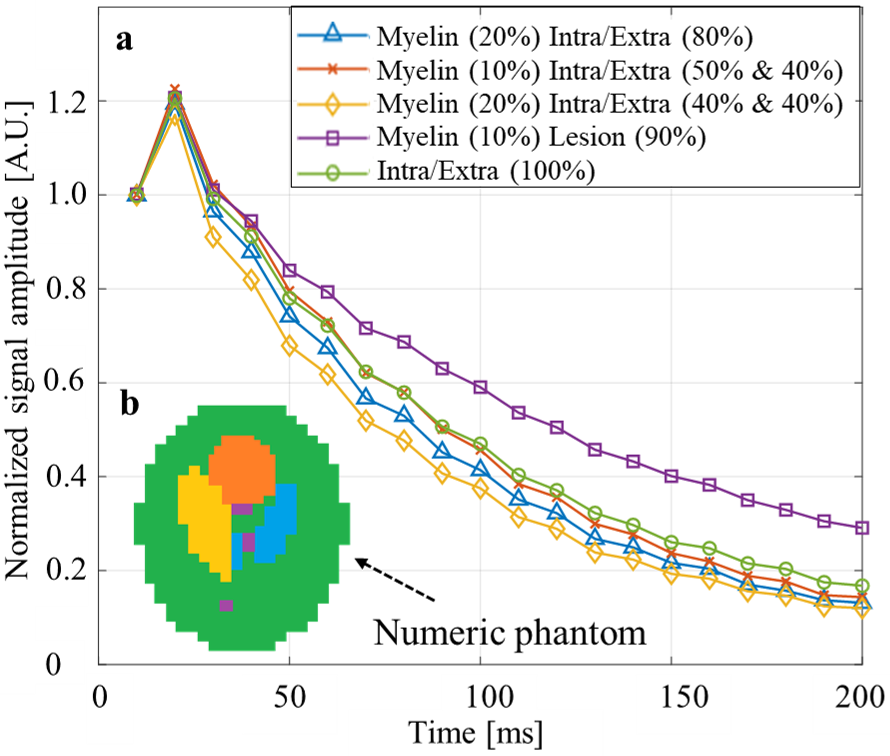
Numerical validations: five mcT2 motifs, modeling different WM microenvironments with 1-3 sub-voxel compartments, were simulated for a range of MWFs 0-20% (T2=10-40 ms) and intra/extra-cellular water fractions of 80-100% (T2=50-80 ms) ($$$\scriptsize\color{blue} {Figure 2}$$$). Conventional rNNLS was applied on the simulated data twice – with and without the data-drive-step. To test the accuracy of both approaches white Gaussian noise was added at varying SNR levels: 60, 40 and 25. The natural variability of T2 values was also modeled by perturbing their values in a range of ±20% from the baseline T2 values. Finally, MWF were quantified per voxel by summing the area under the peak in the short T2 range (10-40 ms)2 and error maps were calculated as the absolute difference between each map and the ground truth MWF map.
In vivo MWF quantification: a volunteer brain scan was performed on a 3 Tesla whole-body MRI scanner (Prisma, Siemens Healthineers) using a 20-channel head coil. Experimental parameters were: FOV=200x210 cm, matrix size=216x180, Naverages=1, TR=3000 ms, TE={10, 20, ..., 200}, slice thickness=3 mm, acquisition-bandwidth=210 Hz/Px, GRAPPA factor=2. Conventional rNNLS was applied on the data twice – with, and without the data-drive-step and MWF maps were produced from both approaches.
Results
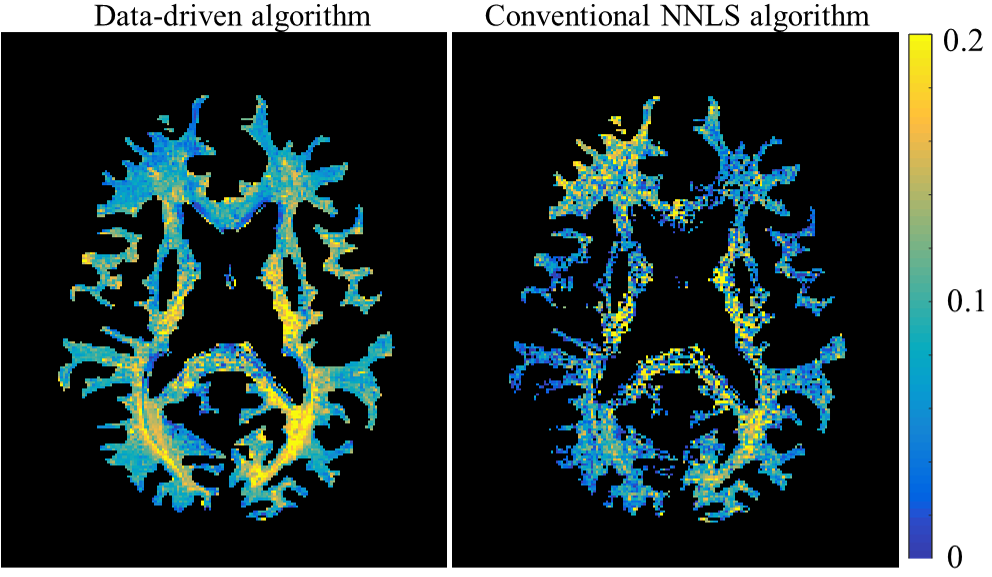
($$$\scriptsize\color{blue} {Figure 3}$$$) presents maps of the MWF and relative error for the numerical simulation at varying SNR levels. At SNR = 60 the data-driven approach showed perfect reconstruction while the conventional approach underestimated the lesioned voxels and the myelin water pool in the three-compartment tissue. At SNR=40 both methods underestimated the two-compartment tissue and misidentified the myelin water pool in one of the three-compartment tissue. At SNR=25 both methods presented incorrect reconstruction.($$$\scriptsize\color{blue} {Figure 4}$$$) compares maps that were obtained with and without the data-driven step for in vivo brain data. Both maps show MWF values which coincide with values reported in the literature (0-25%)17. The data-driven approached produced a smoother MWF pattern compared to the map obtained with conventional approach, which exhibits a significant number of voxels where the fitting process failed to identify any myelin.
Discussion & Conclusions
This study demonstrates the contribution of adopting a data-driven approach for conventional mcT2 analysis. mcT2 analysis involves fitting at least five free parameters to a three-compartment sub-voxel configuration [$$$\scriptsize{T_{2}^{C1}}$$$, $$$\scriptsize{T_{2}^{C2}}$$$, $$$\scriptsize{T_{2}^{C3}}$$$, $$$\scriptsize{f^{C1}}$$$, $$$\scriptsize{f^{C2}}$$$, $$$\scriptsize{f^{C3}=1-f^{C2}-f^{C1}}$$$]. where $$$\scriptsize{T_{2}^{Ci}}$$$ denotes the relative fractions of compartment $$$\scriptsize{Ci}$$$.The statistical power of this key pre-processing stage endows the mcT2 data-driven analysis with additional robustness which stabilizes the rNNLS algorithm and overcomes the ambiguity in the T2-space.Acknowledgements
ISF Grant 2009/17References
1. Mackay A, Whittall K, Adler J, et al. In vivo visualization of myelin water in brain by magnetic resonance. Magn. Reson. Med. 1994;31:673–677.
2. Alonso-Ortiz E, Levesque I, Pike B. MRI-based myelin water imaging: A technical review. Magn. Reson. Med. 2015;73(1):70–81.
3. Zhang J, Kolind, H, Laule C, MacKay A. Comparison of myelin water fraction from multiecho T2 decay curve and steady-state methods. Magn. Reson. Med. 2015;73(1):223–32.
4. McCreary CR. Bjarnason T, Skihar V, et al. Multiexponential T2 and magnetization transfer MRI of demyelination and remyelination in murine spinal cord. Neuroimage. 2009;45:1173–1182.
5. Harald M, Bossoni L, Connor J, et al. Iron, Myelin, and the Brain: Neuroimaging Meets Neurobiology. Trends Neurosci. 2019;42:384–401.
6. Heath F, Hurley S, Johansen-Berg H, Sampaio-Baptista C. Advances in noninvasive myelin imaging. Dev. Neurobiol. 2018;78:136–151.
7. Whittall K, MacKay A. Quantitative interpretation of NMR relaxation data. J. Magn. Reson. 1989;84:134–152.
8. MacKay A, Whittall K, Adler J, et al. In vivo visualization of myelin water in brain by magnetic resonance. Magn. Reson. Med. 1994;31(6):673–677.
9. Graham S, Stanchev P, Bronskill M. Criteria for analysis of multicomponent tissue T2 relaxation data. Magn. Reson. Med. 1996;35(3):370–378.
10. Laule C, Vavasour I, Moore G, et al. Water content and myelin water fraction in multiple sclerosis: A T2 relaxation study. J. Neurol. 2004(3);251:284–293.
11. Raj A, Pandya S, Shen X, et al. Multi-Compartment T2 Relaxometry Using a Spatially Constrained Multi-Gaussian Model. PLoS One 2014;9(6):e98391. doi: 10.1371/journal.pone.0098391
12 Omer N, Stern N, Ben-Eliezer N, et at. A novel multicomponent T analysis for identification of sub-voxel compartments and quantification of myelin water fraction. In Proceedings of the 28th Annual Meeting of ISMRM, Sydney, Australia, 2020. Abstract 6109.
13 Omer N, Stern N, Ben-Eliezer N, et at. Data driven algorithm for multicomponent T2 analysis based on identification of spatially global sub-voxel features. In Proceedings of the 29th Annual Meeting of ISMRM, Virtual Conference, 2021.Abstract 3301.
14 Omer N, Stern N, Ben-Eliezer N, et at. In vivo validation of a data driven algorithm for multicomponent T2 mapping on a mice model of demyelination. In Proceedings of the 29th Annual Meeting of ISMRM, Virtual Conference, 2021.Abstract 4064.
15. Fischl B, Salat D, Busa E, et al. Whole brain segmentation: automated labeling of neuroanatomical structures in the human brain. Neuron. 2002;33(3):341–355.
16. Provencher W. A constrained regularization method for inverting data represented by linear algebraic or integral equations. Comput. Phys. Commun. 1982;27(3):213–227.
17. Deoni S. Quantitative relaxometry of the brain. Top. Magn. Reson. Imaging 2010;21(2) 101–13.
Figures