0423
Towards an ultra-high resolution structural connectivity atlas of the parrot brain using extreme high-field 17.2T diffusion MRI
Ivy Uszynski1, Luisa Ciobanu1, Solène Bardin1, Pierre Estienne2, Kei Yamamoto2, and Cyril Poupon1
1BAOBAB, NeuroSpin, Université Paris-Saclay, CNRS, CEA, Gif-sur-Yvette, France, 2Neuro-PSI, Université Paris-Saclay, CNRS UMR 9197, Saclay, France
1BAOBAB, NeuroSpin, Université Paris-Saclay, CNRS, CEA, Gif-sur-Yvette, France, 2Neuro-PSI, Université Paris-Saclay, CNRS UMR 9197, Saclay, France
Synopsis
The cognitive abilities of parrots are known to be highly developed to the extent of matching those exhibited by crows and primates. However, little is known about the anatomy and structural connectivity of the parrot’s brain. In this work, we propose to use the power of diffusion MRI along with the strong gradients of a unique 17.2T preclinical MRI system to deliver a first white matter atlas of the parrot brain.
Introduction
The cognitive abilities of parrots are known to be highly developed: they involve sophisticated problem solving, mirror use1 and tool making to name a few. The parrots’ higher-order cognitive functions are thought to match those exhibited by crows and primates2. However, little is known about the anatomy and structural connectivity of the parrot’s brain, the existing avian brain atlases being so far focused on other species such as pigeons3, budgerigars4 and quails5. In this work, we propose to use the power of diffusion MRI along with the strong gradients of a unique 17.2T preclinical MRI system to deliver a first white matter atlas of the parrot brain.Materials and methods
Acquisition Protocol – Experiments were performed on a 17.2T horizontal animal MRI system (Bruker BioSpin, Ettlingen, Germany) equipped with strong gradients (1000mT/m-9600T/m/s). A 3D diffusion-weighted Pulsed Gradient Spin Echo echoplanar (EPI) sequence was implemented with the following parameters: 13 shots, TR/TE=250/23.8ms, diffusion gradients characteristics δ/∆=5.0/12.3ms, three diffusion shells including 25/60/90 diffusion directions with b-values of 1500/4500/8000s/mm² and 17 b=0s/mm² reference images, isotropic resolution of 180µm, matrix size=150x150x160, total acquisition time 30h.Animal cohort – The MRI protocol was applied to three ex-vivo adult Pyrrhura molinae parrots. After intracardiac perfusion (4% paraformaldehyde + Gd-DOTA), brains were collected, fixed by immersion and scanned on the 17.2T MRI system.
Pre-processing – Data were denoised with a non-local means algorithm using the Ginkgo toolbox6. The PGSE EPI 3D sequence used with a large number of segments (13) resulted in raw DW images deprived of any visible geometrical distortion.
Template construction – The 17 T2-weighted b=0s/mm² images were averaged and a precise mask of the brain was computed for each individual. Intensity bias was removed using N4 bias field correction7 and all three unbiased images were provided to the antsMultivariateTemplateConstruction2 framework8. The resulting T2-weighted template was then semi-automatically segmented into left hemisphere, right hemisphere and cerebellum.
Post-processing – Orientation distribution function (ODF) maps were computed using the analytical Q-ball model9 (spherical harmonics order 8, regularization factor 0.006). A deterministic regularized streamline tractography10 was performed to infer a dense whole brain connectogram per animal (~1.856.000 connections) using the following parameters: uniform seeding over a predefined domain of propagation computed from the average b=0s/mm² image (8 seeds per voxel), forward step: 45µm, aperture angle: 30°. A lower GFA threshold of 0.03 was used as a stopping criterion for tractography. The processing pipeline is displayed in Fig.1.
Intra-subject fiber clustering – After subdividing the individual tractograms into 4 subsets (inter-hemispheric, right/left hemispheres, cerebellum fibers), and 3 length groups (1-7/7-13/13-19mm, Fig.2), a density mask was computed for each group with a 180µm resolution, allowing to perform a hierarchical clustering of the connectivity matrix established from a random parcellation obtained within each density mask using a K-Means algorithm (minimum cluster size of 300 voxels, average cluster size of 3000 voxels, connectivity matrix threshold of 1%). All fibers intersecting a given cluster by more than 33% of their length were assigned to a target fascicle, yielding an individual set of fascicles for each parrot. For each fascicle, a centroid was defined corresponding to the fiber being closest to all the other fibers populating the fascicle, thus providing a map of centroids for each individual.
Inter-subject fiber clustering – A diffeormorphic transformation based on the Symmetric Normalization (SyN)11 approach provided by ANTs8 was computed to match each individual DW dataset and fascicle map to the template frame described earlier. A second hierarchical density-based HDBSCAN12 step (normalization factor=1, minimum cluster size=1) was then performed at the level of the population to automatically regroup centroids stemming from different parrots into clusters and to only keep the most representative ones (present in 2 or 3 parrots).
Atlasing – The final step consisted in selecting clusters intersecting the WM regions manually delineated in the T2-weighted template to establish a first Pyrrhura molinae parrot brain white matter atlas based on the nomenclature of [Reiner et. al., 2004]13 : anterior commissure (AC), cerebellar fibers, lateral forebrain bundle (LFB), pallial-subpallial lamina (LPS), septopallio-mesencephalic tract (TSM), fronto-arcopallial tract (FA) and occipito-mesencephalic tract (OM).
Results
The dense 1 855 986±169 179 fiber connectomes were disentangled into 25 142±3 690 clusters in the right hemisphere, 27 767±2 816 clusters in the left hemisphere, 7 808±590 clusters in the cerebellum and 3 269±789 inter-hemispheric clusters as a result of the intra-subject fiber clustering step. The inter-subject fiber clustering step emphasized 4 989, 5 660, 1 684 and 494 representative white matter clusters respectively for the right, left hemispheres, cerebellum and inter-hemispheric region. Figures 3 and 4 represent the 4 lateralized bundles, the anterior commissure and the cerebellar fibers in 3D rendering.Conclusion & Discussion
This study establishes the foundations of a structural connectivity atlas of the parrot brain in which 10 white matter bundles were characterized based on high-resolution high-field diffusion MRI data. Future work will focus on subdividing the FA and OM tracts. The size of the cohort will be increased in order to gain robustness and achieve a higher degree of precision. As such, the number of white matter bundles characterized by the atlas will be extended with delineation of the quintofrontal, thalamopallial, dorsal arcopallial and optic tracts.Acknowledgements
References
- Pepperberg, I. M., Garcia, S. E., Jackson, E. C., & Marconi, S. (1995). Mirror use by African grey parrots (Psittacus erithacus). Journal of Comparative Psychology, 109(2), 182.
- Güntürkün O, Bugnyar T. Cognition without Cortex. Trends Cogn Sci. 2016 Apr;20(4):291-303. doi: 10.1016/j.tics.2016.02.001. Epub 2016 Mar 2. PMID: 26944218.
- Karten, H. J., & Hodos, W. (1967). A stereotaxic atlas of the brain of the pigeon: (Columbia livia) by Harvey J. Karten and William Hodos. Baltimore: Johns Hopkins Press.
- http://www.brauthlab.umd.edu/atlas.htm
- Yebga Hot R, Siwiaszczyk M, Beaujoin J, Barrière D, Uszynski I, Love S, et al. A novel 11.7T ultra-high field dMRI connectivity atlas of the Japanese quai. Abstract in ISMRM 2019 (Montreal, Canada). 2019.
- https://framagit.org/cpoupon/gkg
- Tustison NJ, Avants BB, Cook PA, Zheng Y, Egan A, Yushkevich PA, Gee JC. N4ITK: improved N3 bias correction. IEEE Trans Med Imaging. 2010 Jun;29(6):1310-20. doi: 10.1109/TMI.2010.2046908. Epub 2010 Apr 8. PMID: 20378467; PMCID: PMC3071855.
- Avants BB, Tustison NJ, Song G, Cook PA, Klein A, Gee JC. A reproducible evaluation of ANTs similarity metric performance in brain image registration. Neuroimage. 2011 Feb 1;54(3):2033-44. doi: 10.1016/j.neuroimage.2010.09.025. Epub 2010 Sep 17. PMID: 20851191; PMCID: PMC3065962.
- Descoteaux M, Angelino E, Fitzgibbons S, Deriche R. Regularized, fast, and robust analytical Q-ball imaging. Magn Reson Med. 2007 Sep;58(3):497-510. doi: 10.1002/mrm.21277. PMID: 17763358.
- Perrin M, Poupon C, Cointepas Y, Rieul B, Golestani N, Pallier C, Rivière D, Constantinesco A, Le Bihan D, Mangin JF. Fiber tracking in q-ball fields using regularized particle trajectories. Inf Process Med Imaging. 2005;19:52-63. doi: 10.1007/11505730_5. PMID: 17354684.
- Avants BB, Epstein CL, Grossman M, Gee JC. Symmetric diffeomorphic image registration with cross-correlation: evaluating automated labeling of elderly and neurodegenerative brain. Med Image Anal. 2008 Feb;12(1):26-41. doi: 10.1016/j.media.2007.06.004. Epub 2007 Jun 23. PMID: 17659998; PMCID: PMC2276735.
- Martin Ester, Hans-Peter Kriegel, Jörg Sander, and Xiaowei Xu. 1996. A density-based algorithm for discovering clusters in large spatial databases with noise. In Proceedings of the Second International Conference on Knowledge Discovery and Data Mining (KDD'96). AAAI Press, 226–231.
- Reiner A, Perkel DJ, Bruce LL, Butler AB, Csillag A, Kuenzel W, Medina L, Paxinos G, Shimizu T, Striedter G, Wild M, Ball GF, Durand S, Güntürkün O, Lee DW, Mello CV, Powers A, White SA, Hough G, Kubikova L, Smulders TV, Wada K, Dugas-Ford J, Husband S, Yamamoto K, Yu J, Siang C, Jarvis ED; Avian Brain Nomenclature Forum. Revised nomenclature for avian telencephalon and some related brainstem nuclei. J Comp Neurol. 2004 May 31;473(3):377-414. doi: 10.1002/cne.20118. Erratum in: J Comp Neurol. 2004 Jul 19;475(2):288. Gütürkün, Onur [corrected to Güntürkün, Onur]. PMID: 15116397; PMCID: PMC2518311.
Figures
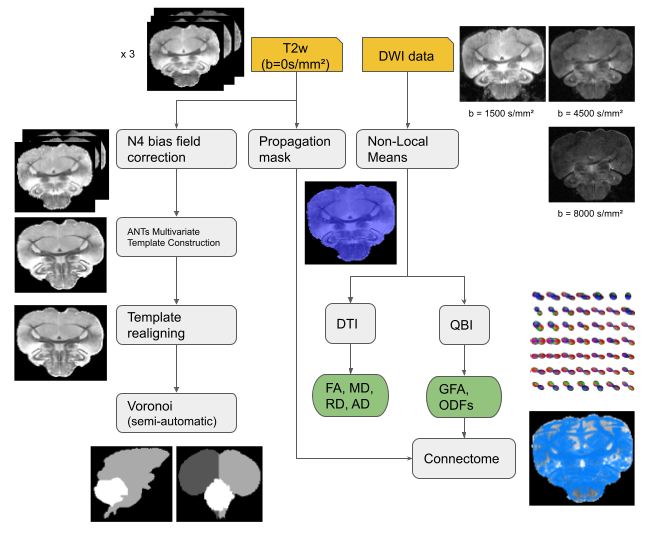
Fig.1 : The processing pipeline, from raw diffusion MRI data to template creation and tractography.
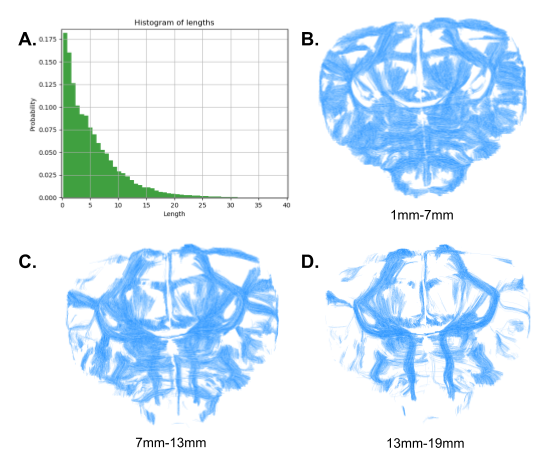
Fig.2 : Histogram of the fiber lengths across the three parrots (A). Subdivision of a given parrot’s tractogram into three length ranges 1mm-7mm (B), 7mm-13mm (C), 13mm-19mm (D).
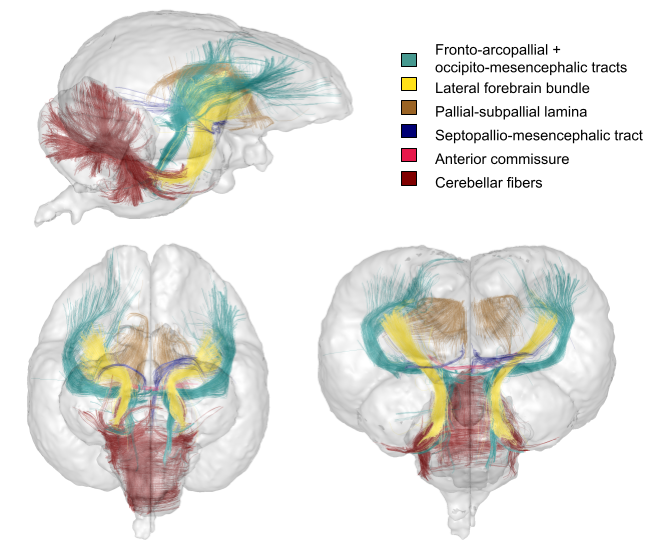
Fig.3 : The Pyrrhura molinae parrot brain white matter atlas including 4 lateralized bundles, 1 inter-hemispheric bundle and 1 cerebellum bundle, sagittal, axial and coronal 3D rendering (the mesh represents the template).
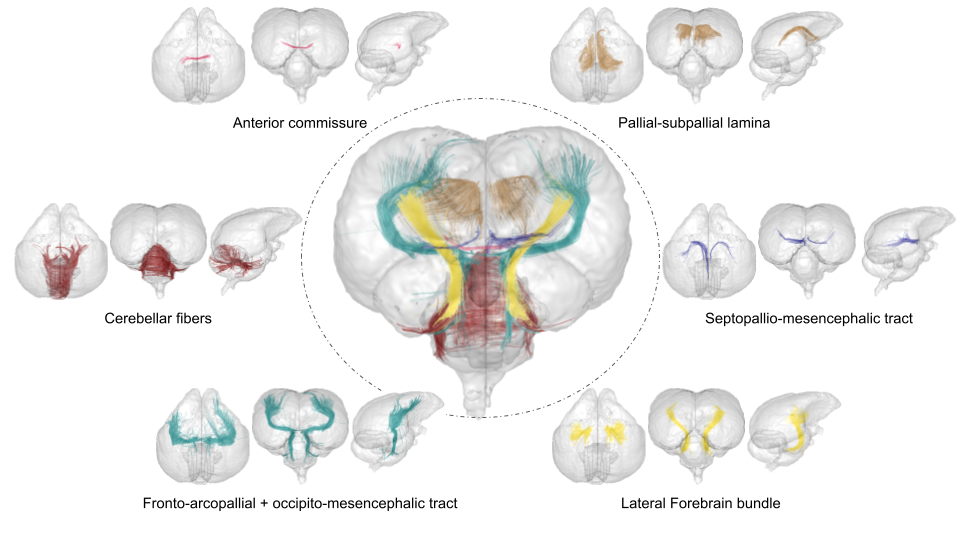
Fig.4: Separated axial, coronal and sagittal 3D rendering for all six bundles of the Pyrrhura molinae parrot brain connectivity atlas.
DOI: https://doi.org/10.58530/2022/0423