0421
Differential information of perfusion and diffusion MRI following traumatic spinal cord injury in the rat.1Biophysics, Medical College of Wisconsin, Milwaukee, WI, United States, 2Neurosurgery, Medical College of Wisconsin, Milwaukee, WI, United States
Synopsis
Spinal cord tissue perfusion plays a central role in the acute care of spinal cord injury (SCI). We previously optimized pseudo-continuous arterial spin labeling (pCASL) MRI for the rat spinal cord. This work represents the first longitudinal study combining pCASL and filtered diffusion weighted MRI to examine the relationship between spinal cord blood flow and filtered axial diffusivity following a rat model of SCI. This work reveals unique and differing spatiotemporal dynamics between the two contrasts.
Introduction
Spinal cord tissue perfusion plays a central role in the acute care of spinal cord injury (SCI) and optimizing perfusion to the cord is thought to improve neurological outcome1 by minimizing the progressive injury that occurs in traumatic injury. However, direct monitoring of spinal cord perfusion remains limited by the lack of a noninvasive biomarker. Building upon recent work2 that optimized pseudo-continuous arterial spin labeling (pCASL) for reliable imaging of the rodent spinal cord, this project combined pCASL with filtered-diffusion weighted MRI to compare and contrast the status of the microstructure and hemodynamics, respectively, of the acutely injured spinal cord.Methods
Animals. Thirty, adult Sprague-Dawley rats received a bilateral contusion injury at cervical level 5 (C5) of varied severity with equal numbers of male and female rats. Nine rats received a sham surgery. MRI was completed 4 hours, 48 hours, and 12 weeks after injury.Acquisition. MRI was performed on a 9.4T Bruker Biospec (Paravision 6.0.1) and positioned in a head holder inside a 38 diameter Litz coil (Doty Scientific, Inc). The protocol included T1, T2, and T2* weighted imaging and custom pCASL and DWI sequences. Both pCASL2 and DWI3 protocols used our previously established spinal cord optimized MRI methods with identical fast spin-echo imaging readouts (a single slice with thickness=2-mm; in-plane resolution=0.203-mm) for minimal artifacts and to permit direct voxel-by-voxel comparisons. The pCASL labeling module used a 400-µs Hanning pulse, 1-ms pulse repeat interval, 5-µT average B1 amplitude, 45/5-mT/m Gmax/Gmean, and a labeling duration of 1100-ms. Additional optimization included positioning of the labeling plane at vertebral level C7, a background suppression inversion pulse to null CSF signal and four post-label delay times (100–400-ms) to minimize transit effects. T1 and inversion efficiency maps were acquired for each animal for accurate quantification of spinal cord blood flow (SCBF). DWI included a high-strength (b=2000 s/mm2) diffusion gradient perpendicular to the cord (filter) and 25 diffusion vectors (b=800 s/mm2) orthogonal to the first with second-order motion compensation to reduce motion artifacts. Axial images were collected using multi-slice EPI with 8 and 12 slices for pCASL and DWI respectively, slice thickness=1.25-mm; slice gap=0.250-mm; and in-plane resolution=0.229-mm. Multi-echo T2 spin echo and T2* gradient echo sequences were collected for quantitative analysis. At 12-weeks, T2 images were collected as a measurement of terminal tissue fate.
Image Processing. MRI was processed using custom MATLAB routines and freely available software. For pCASL and DWI, maps of spinal cord blood flow (SCBF) and filtered axial diffusivity (fADC||) were derived as the primary metrics for analysis. SCBF was corrected for inversion efficiency and T1. Quantitative T1 and T2 maps were generated through monoexponential fitting. Quantitative images were spatially registered to an in-house rat spinal cord template using the Spinal Cord Toolbox4. Binary lesion masks were created to separate voxels with normal T2 and those with high values indicating regions of dead tissue or cavitation.
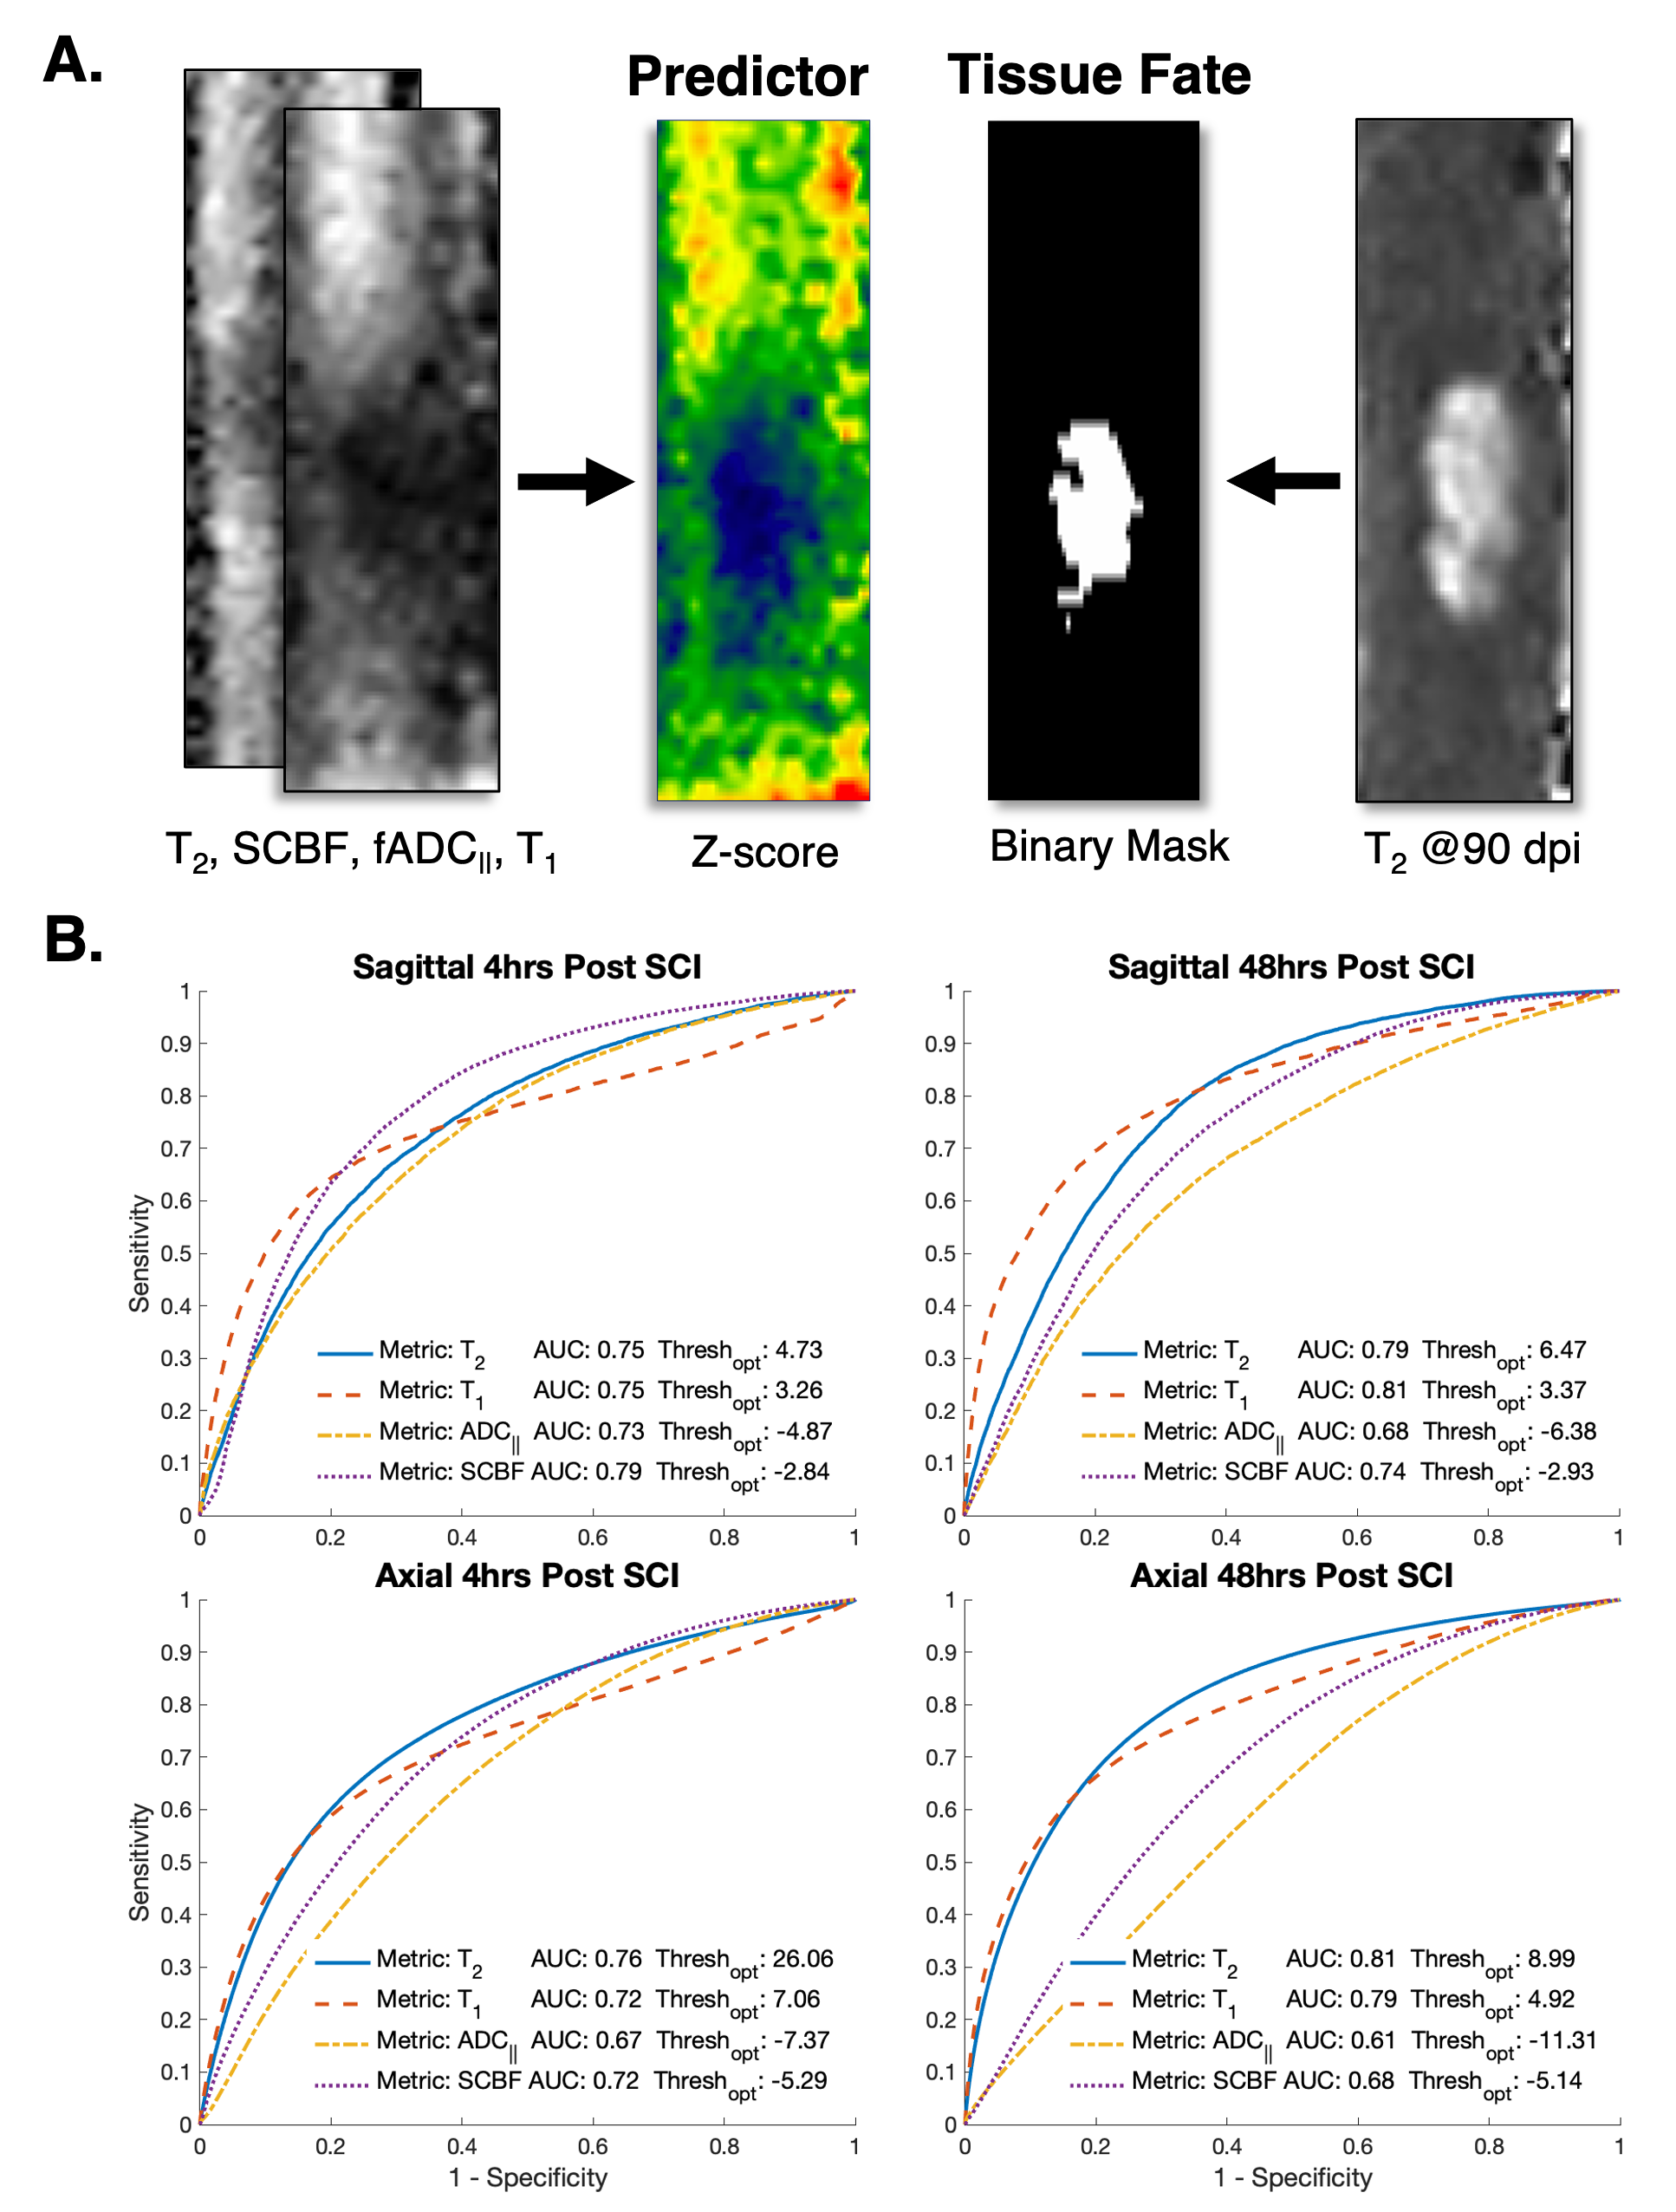
Analysis. Voxelwise comparisons between sham and SCI rats were evaluated with a two-sample unpaired T-test with impact height as a within-group covariate using FSL randomize5. A receiver operating characteristic (ROC) curve was also performed to characterize the ability of acute MRI metrics to predict terminal tissue fate. Acute images from each contrast were first transformed into z-score images using the mean and standard deviation of the sham group. All voxels within the spinal cord across all injured animals were used to generate the ROC curve and derive area under the curve (AUC).
Results
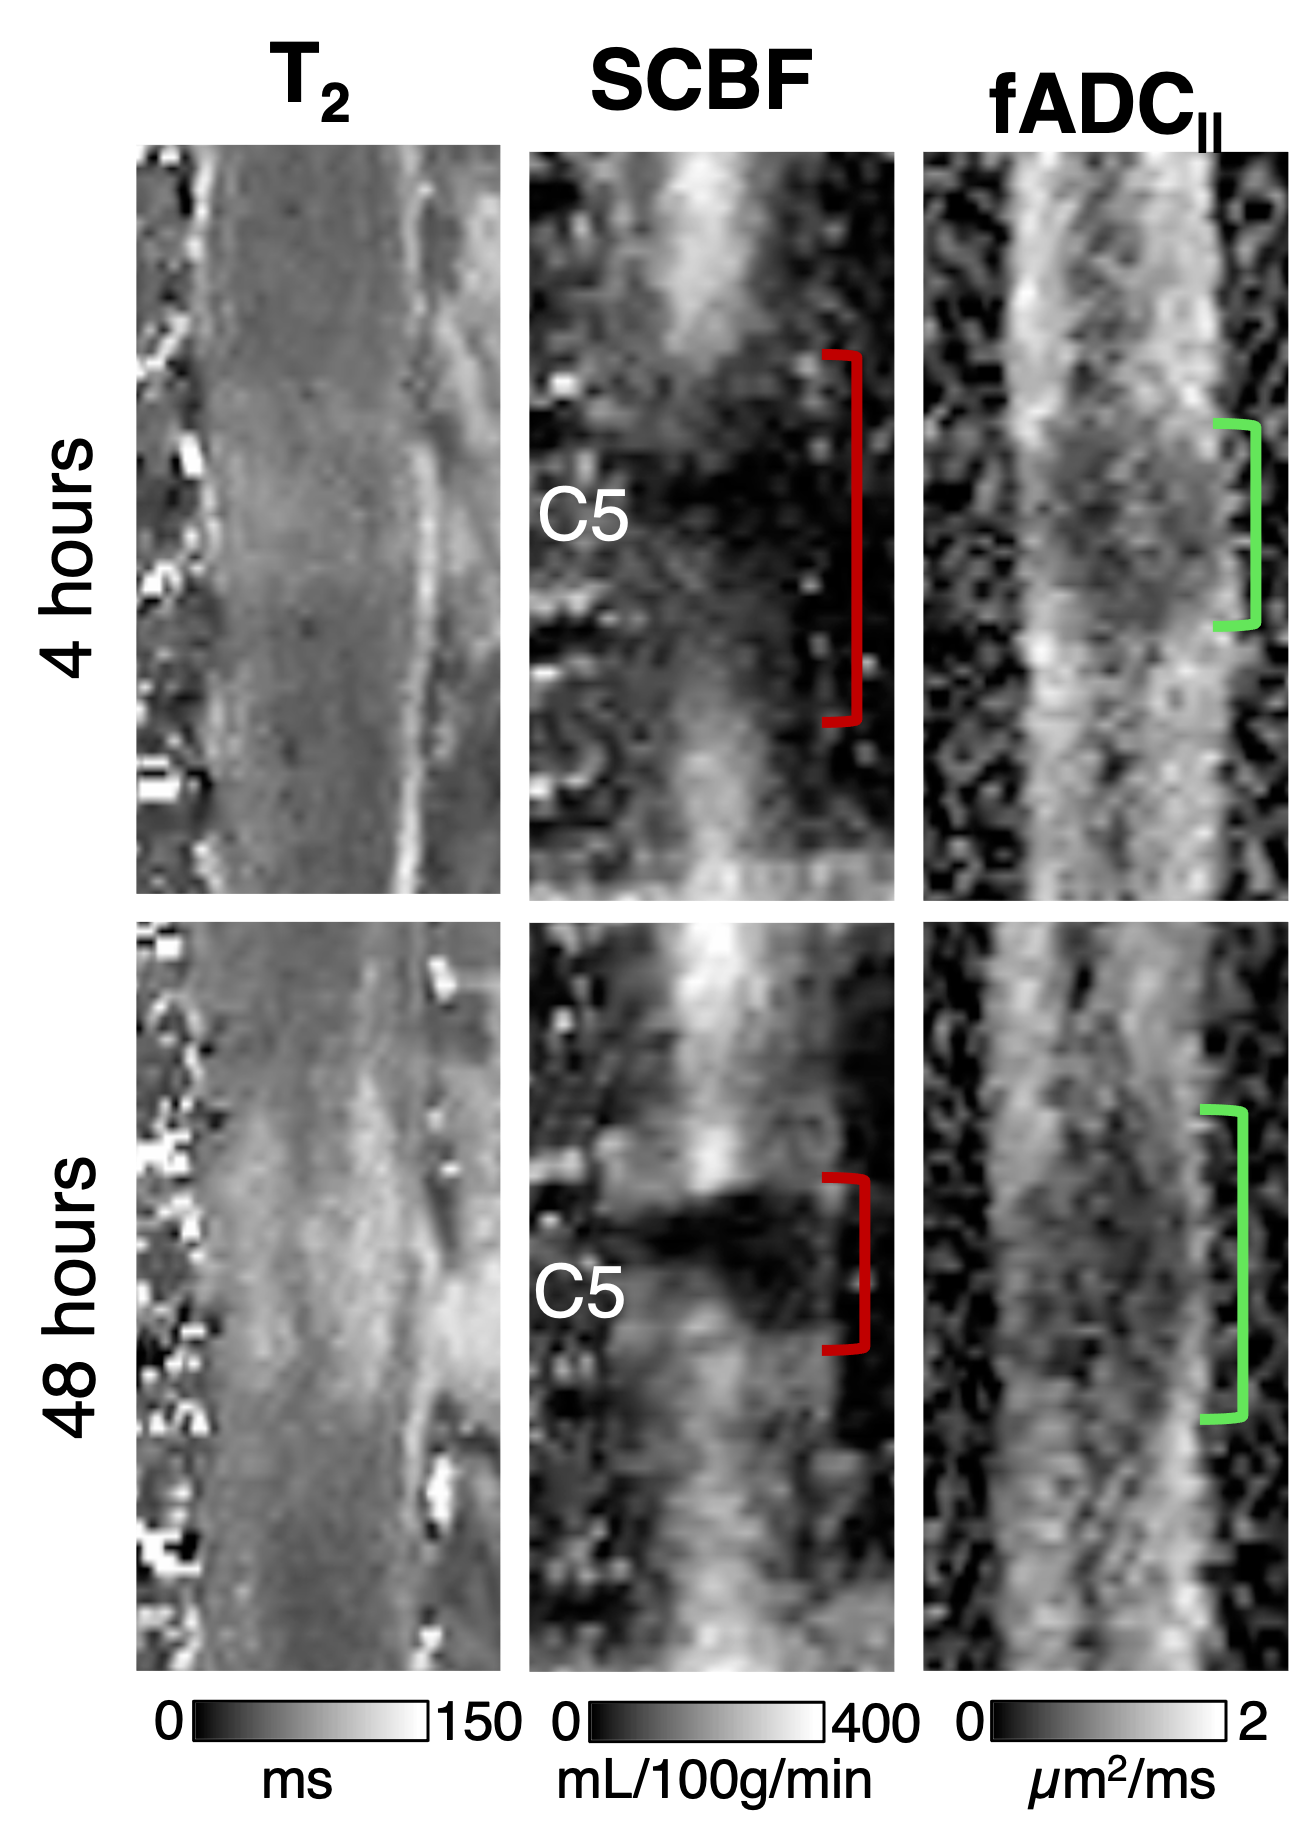
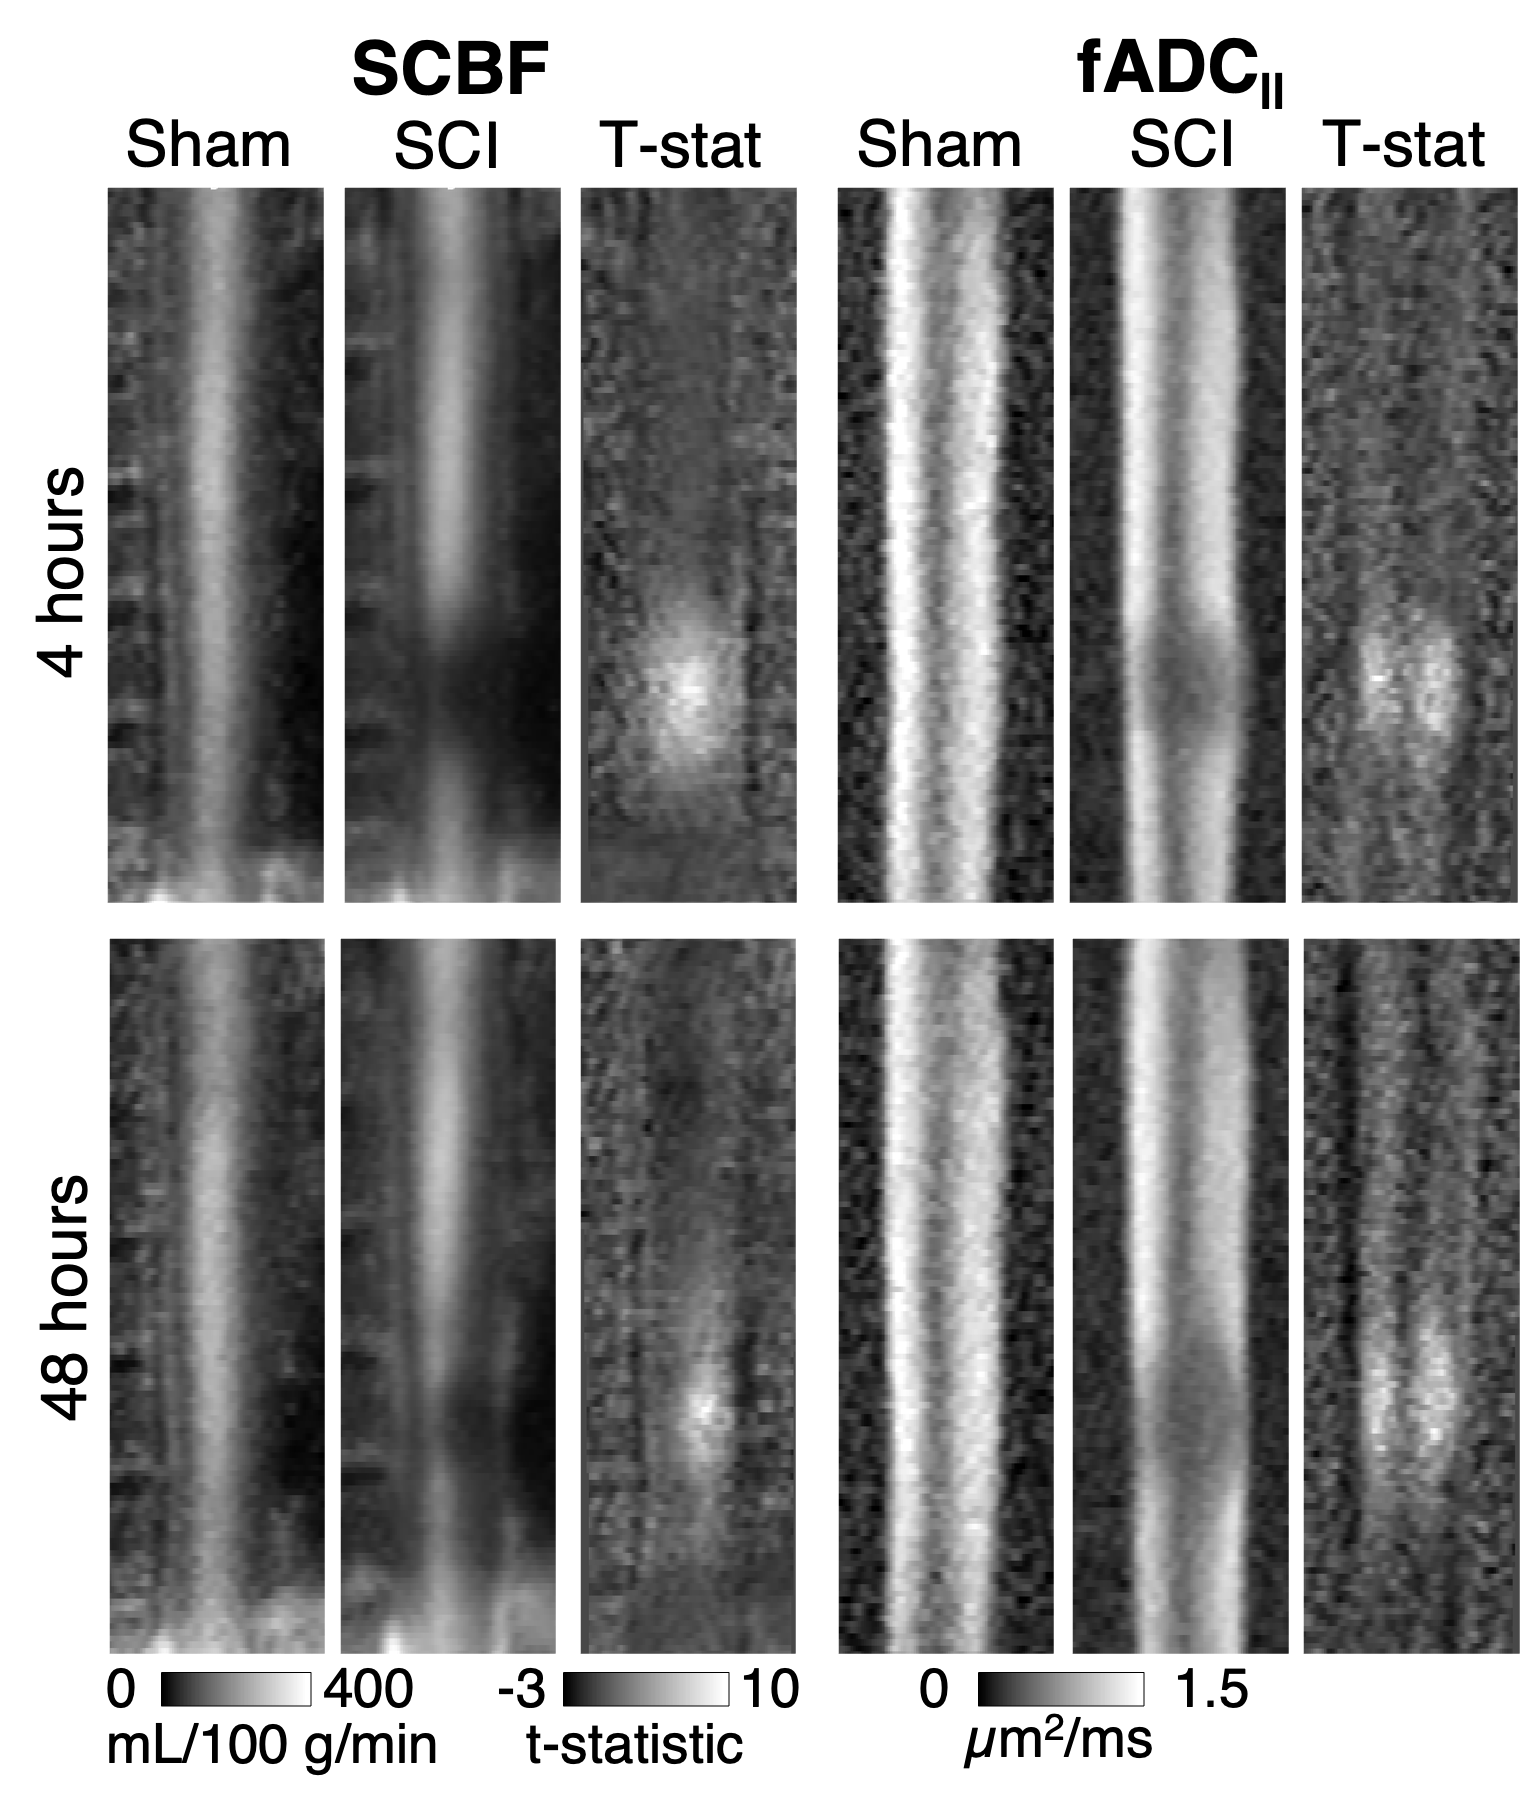
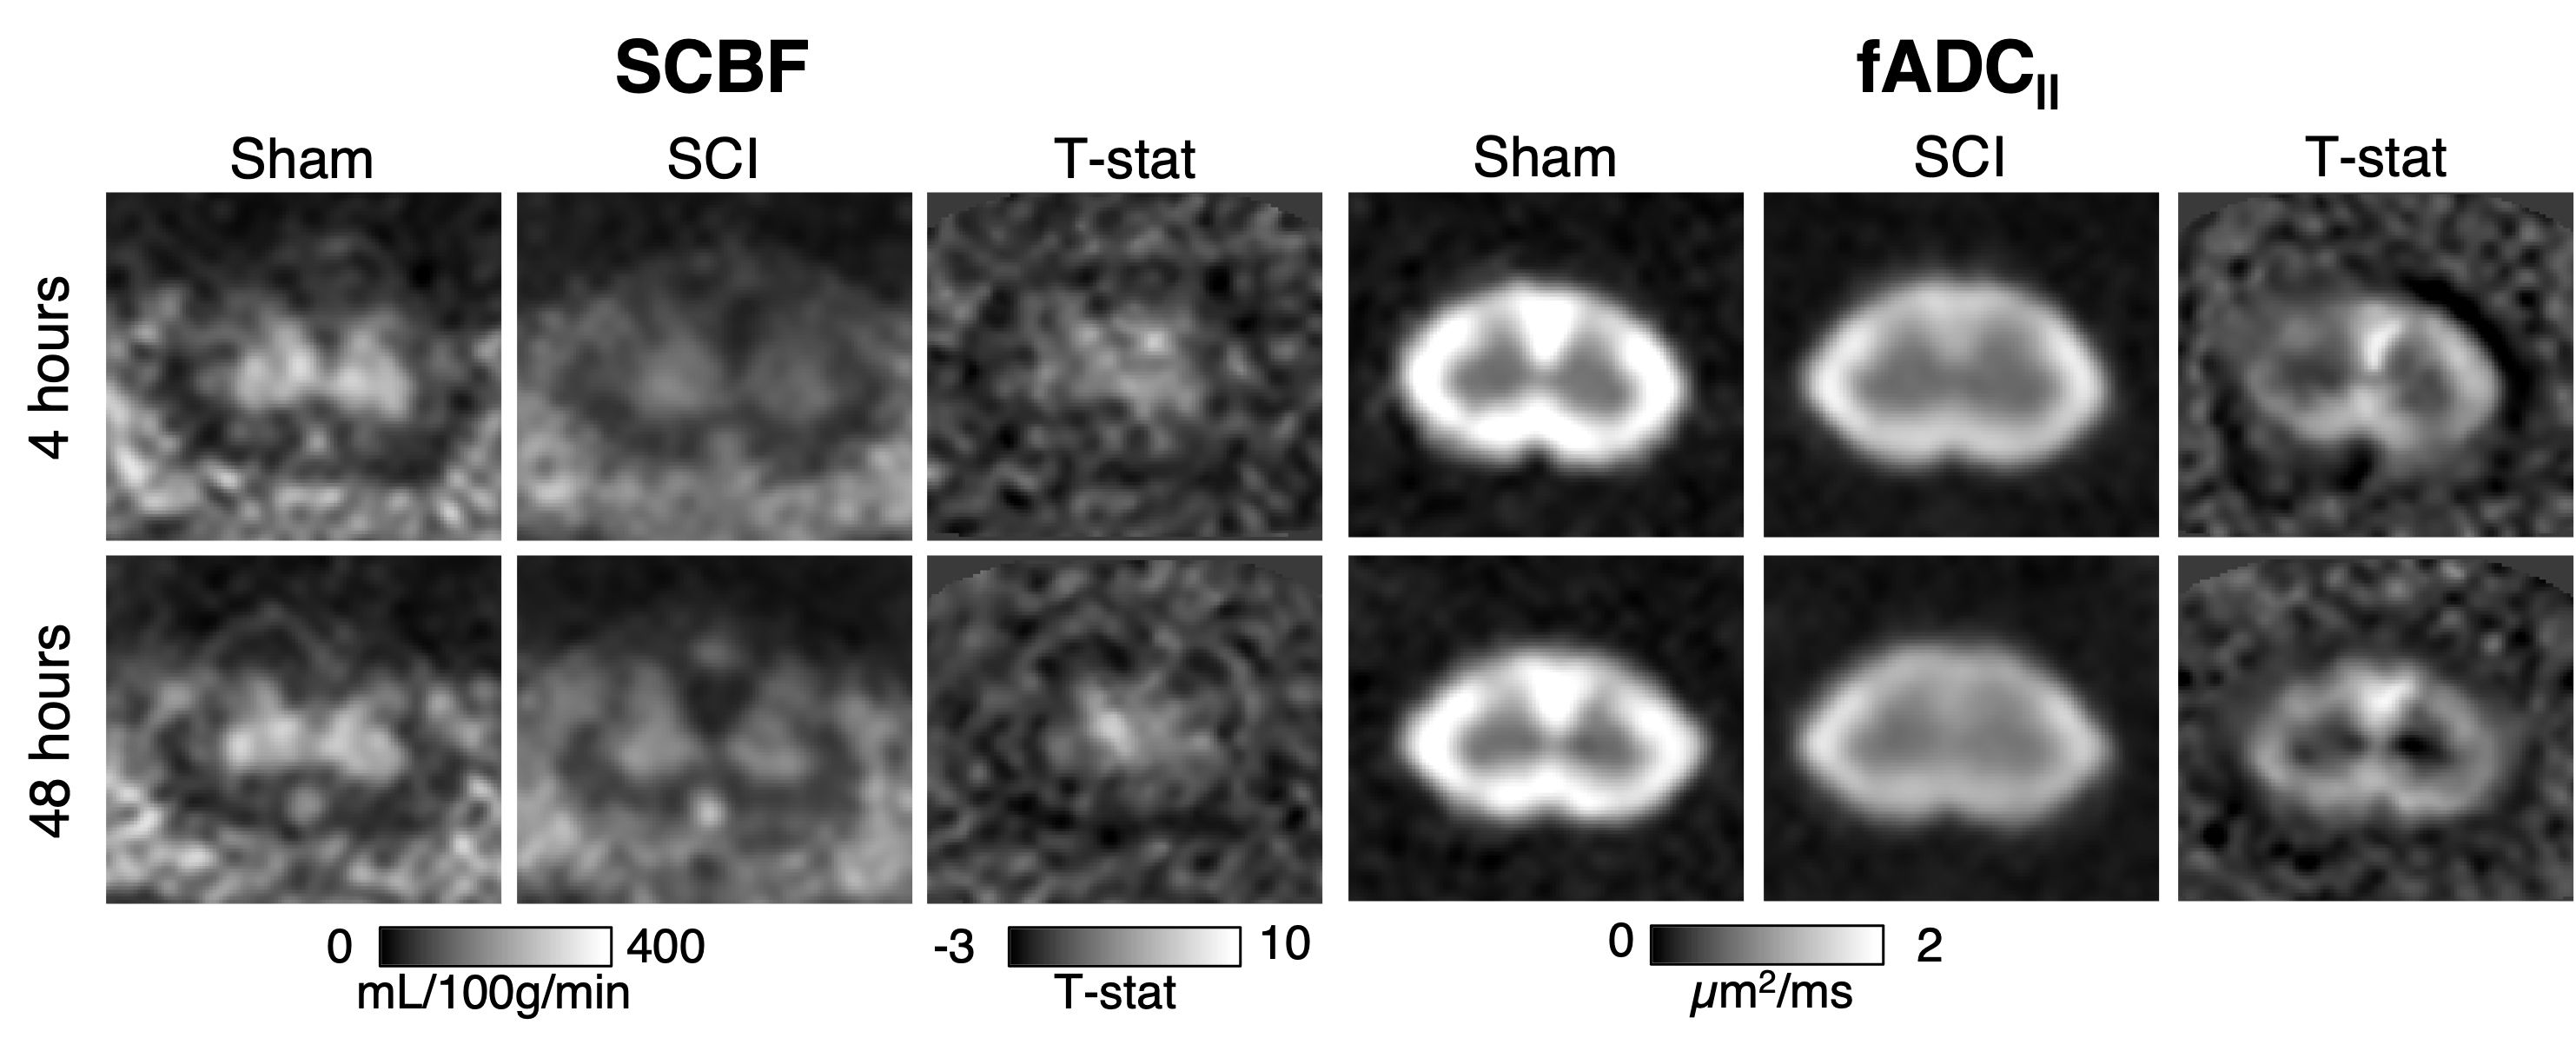
Qualitative inspection of individual animals revealed areas of reduced SCBF at the 4-hour time-point on sagittal imaging, which appeared larger compared with areas of reduced fADC||. At 48 hours, the diffusion lesions appeared to subtly expand in size, whereas the size the perfusion abnormalities clearly decreased (Figure 1). Sagittal group-wise statistical comparisons revealed similar findings as the individual results. Perfusion abnormalities were more pronounced at 4 hours but reduced is extent. The diffusion abnormalities appeared similar in size to the perfusion changes at 4 hours but were more pronounced at 48 hours after injury (Figure 2). As expected, imaging in the axial plane clearly demonstrated specificity of SCBF and fADC|| to grey and white matter, respectively (Figure 3). The ROC curve revealed that SCBF was the highest preforming metric to predict final tissue fate at 4 hours post injury for the sagittal acquisitions. At 48 hours, T1 and T2 outperformed SCBF or fADC|| in predicting tissue fate.Discussion
Differential spatial and temporal patterns were observed with perfusion and diffusion contrast in acute SCI. The results indicate that perfusion changes were most pronounced acutely after SCI and experience prominent recovery in this rat model by 48 hours post injury. As evidenced by the larger spatial extent of group changes and its accuracy in predicting final tissue fate compared to other contrasts, the results generally highlight the importance of perfusion early after SCI.Conclusion
This is the first study directly comparing pCASL and DWI following traumatic SCI in the rat and reveals unique and differing spatiotemporal dynamics. Future analysis will continue to interrogate the value of these advanced MRI contrast in predicting functional outcomes and their ability to guide and monitor interventions in this model.Acknowledgements
This work was supported by the Office of the Assistant Secretary of Defense for Health Affairs through the Spinal Cord Injury Research Program (W81XWH-19-SCIRP-IIRA) and by the National Institutes of Neurological Disorders and Stroke (NS109090).References
1. Evaniew N, Jalali Mazlouman S, Belley-Côté EP, Jacobs B, Kwon BK. Interventions to optimize spinal cord perfusion in patients with acute traumatic spinal cord injuries: A systematic review. Journal of Neurotrauma. 2020;13:1–13. doi:10.1089/neu.2019.68442.
2. Meyer BP, Hirschler L, Lee S, Kurpad SN, Warnking JM, Barbier EL, Budde MD. Optimized cervical spinal cord perfusion MRI after traumatic injury in the rat. Journal of Cerebral Blood Flow and Metabolism. 2021. doi:10.1177/0271678X209823963.
3. Lee SY, Meyer BP, Kurpad SN, Budde MD. Diffusion-prepared fast spin echo for artifact-free spinal cord imaging. Magnetic Resonance in Medicine. 2021;86(2):984–994. doi:10.1002/mrm.287514.
4. De Leener B, Levy S, Dupont SM, Fonov VS, Stikov N, Louis Collins D, Callot V, Cohen-Adad J. SCT: Spinal Cord Toolbox, an open-source software for processing spinal cord MRI data. NeuroImage. 2017;145(Pt A):24–43. doi:10.1016/j.neuroimage.2016.10.0095.
5. Winkler AM, Ridgway GR, Webster MA, Smith SM, Nichols TE. Permutation inference for the general linear model. NeuroImage. 2014;92:381–397. doi:https://doi.org/10.1016/j.neuroimage.2014.01.060
Figures