0420
Impairments in cerebral blood flow and cerebrovascular reactivity in the APP23 mouse model of cerebral amyloidosis1Massachusetts General Hospital, BOSTON, MA, United States, 2Leiden University Medical Center, Leiden, Netherlands, 3Grenoble Institut des Neurosciences, Grenoble, France, 4Athinoula A. Martinos Center for Biomedical Imaging, Boston, MA, United States
Synopsis
Patients with cerebral amyloid angiopathy (CAA) have accumulations of amyloid-beta in the cerebral vasculature, which ultimately lead to stroke and dementia. MRI markers of CAA include microbleeds and reduced cerebrovascular reactivity (CVR). The APP23 mouse model with vascular amyloid-beta accumulation is known to have microbleeds and reduced cerebral blood flow (CBF). Here, using pseudo-Continuous Arterial Spin Labeling (pCASL)-MRI with a 10 % CO2 stimulation, we show that besides lower CBF, APP23 mice also have reduced CVR. Furthermore, in our data, a higher microbleed count was associated with lower CBF, but not with CVR.
Introduction
Cerebral amyloid angiopathy (CAA) is a neurovascular disease leading to hemorrhagic stroke and dementia. Like Alzheimer’s disease (AD), CAA is pathologically characterized by amyloid-beta accumulation in the brain. However, while parenchymal amyloid-beta plaques are one of the classic hallmarks in AD, in CAA amyloid-beta deposits in the vasculature, predominantly in the walls of smaller arteries and arterioles.1 CAA can cause microbleeds,2 as well as impairments in cerebrovascular reactivity (CVR).3 Several transgenic mouse models exist that accumulate amyloid-beta in different locations in the brain. The APP23 model is a model with robust vascular amyloid-beta accumulation and interestingly also develops microbleeds and reduced cerebral blood flow (CBF).4 It is unclear whether APP23 mice also have concomitant decreases in CVR, and how these vascular impairments may compare spatiotemporally to the development of microbleeds. Here, we therefore assessed both CBF and CVR in two age groups of APP23 mice using pseudo-Continuous Arterial Spin Labeling (pCASL)-MRI combined with a 10 % CO2 stimulus, as well as a multi-gradient echo (MGE) sequence to quantify microbleeds.Methods
Animals - APP23 mice and age-matched wild type (WT) controls were scanned at the ages of 18 months (n=4 APP23 [3 females]; n=5 WT [2 females]) and 24 months (n=6 APP23 [4 females]; n=9 WT [3 females]). Anesthesia consisted of low isoflurane (2 % induction, 1.1 % maintenance) in oxygen-enriched air (30 % oxygen) and temperature was maintained at 36.5 C.Imaging - A 9.4 T MRI scanner with Bruker Paravision 6 software was used with a head phased array receive coil and whole-body volume transmit coil. After acquisition of anatomical T2-weighted RARE scans for planning, the pCASL label and control phases were optimized with pre-scans.5 Thereafter, a 15‑minute pCASL scan was acquired (TR/TE = 3500/28 ms), with administration of 10 % CO2 from minute 5 to 10. The pCASL labeling duration of 2950 ms was followed by a 300 ms post-labeling delay. Imaging read-out was performed with a 5-slice spin-echo sequence with a resolution of 0.25x0.25x1.0 mm3 and a 0.5 mm slice gap. An additional inversion recovery sequence with the same EPI read-out parameters as the pCASL was acquired to estimate tissue T1 and M0, and a pCASL flow-compensated FLASH was acquired at the level of the carotids to determine labeling efficiency. The MGE sequence consisted of 6 echos (3.5 - 21 msec, with 3.5 ms intervals), a resolution of 0.175x0.175x0.35 mm3 and 25 consecutive slices.
Processing - EPIs from individual scans were aligned, and CBF was calculated using the ASL label and control difference signal and Buxton’s perfusion model,6 using MATLAB-based open-source software.7 Regions of interest (ROIs) were drawn by hand either on the full mid-brain or the somatosensory cortex to extract regional CBF. CVR time-profiles were derived by normalizing the CBF curve to the average CBF between minute 1-5. Mouse individual CBF and CVR values were defined respectively as the average CBF between minute 1-5, and the percentage CBF increase in minute 6-10 over minute 1-5. MGE scans were scored by 1 observer to determine the number of microbleeds. Mann-Whitney U tests were performed to compare CBF and CVR between the two genotypes and Spearman's rank-order correlations were performed to determine if there is a correlation between microbleed count and CBF/CVR in APP23 mice.
Results
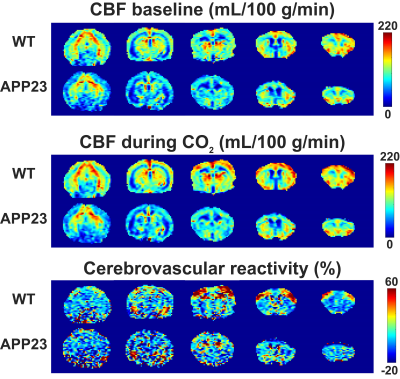
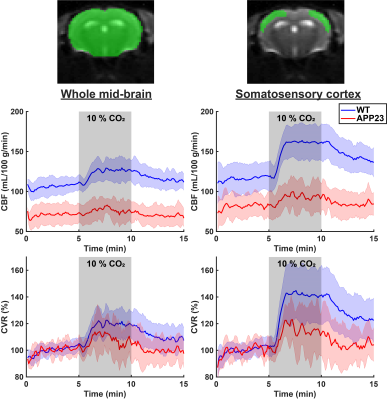
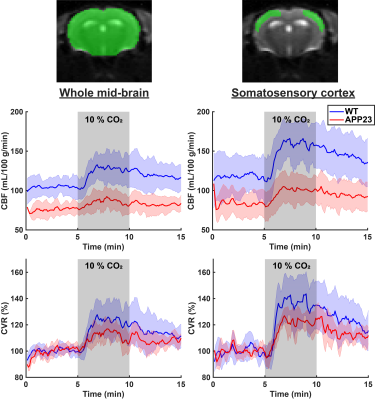
Figure 1 displays CBF and CVR maps for 1 representative WT and 1 representative APP23 mouse from the 24 months cohort. CBF appears lower in the full APP23 mouse brain, while CVR appears lower in the APP23 cortex. These observations are also reflected in the absolute and baseline-corrected CBF time-profiles (mean ± standard deviation) for the 24 months old group (figure 2) and the 18 months group (figure 3), but are less profound for the 18 months group. Indeed, cortical CBF and CVR are significantly different for the 24 months group, but not the 18 months group (figure 4). A median of 9 microbleeds were found in the 24 months APP23 group, which significantly correlated with CBF but not CVR (figure 5).Discussion
In this work, we confirm previously reported reductions in CBF and occurrence of microbleeds in the APP23 mouse model.4 We furthermore show reductions in CVR to hypercapnia, which is striking given the already lower CBF in the APP23 group. The CBF and CVR were only significantly decreased in the 24 months group, not the 18 months group, but this is likely related to the small group size. A significant correlation was found between microbleed count and CBF in the 24 months group, but the small group size warrants caution. Future steps include increasing power by adding additional animals (including balancing the male/female ratio in both groups) and regionally analyzing the effect of microbleeds on vascular function. The non-invasive aspect of this study, combined with the clinically-relevant symptoms in the APP23 mouse model, make this an ideal set-up to test the effect of potential new treatments on vascular function in the context of CAA.Acknowledgements
This study was supported by the following grants:
- NIH Grant RF1 NS110054
- NIH Grant R00 AG059893
- Alzheimer’s Association 2019-AARG-641299
References
1. Greenberg, S. M. et al. Cerebral amyloid angiopathy and Alzheimer disease — one peptide, two pathways. Nature Reviews Neurology vol. 16 30–42 (2020).
2. van den Boom, R. et al. Microbleeds in hereditary cerebral hemorrhage with amyloidosis-Dutch type. Neurology 64, 1288–9 (2005).
3. van Opstal, A. M. et al. Cerebrovascular function in presymptomatic and symptomatic individuals with hereditary cerebral amyloid angiopathy: a case-control study. Lancet Neurol. 16, 115–122 (2017).
4. Maier, F. C. et al. Longitudinal PET-MRI reveals β-amyloid deposition and rCBF dynamics and connects vascular amyloidosis to quantitative loss of perfusion. Nat. Med. 20, 1485–1492 (2014).
5. Hirschler, L. et al. Interpulse phase corrections for unbalanced pseudo-continuous arterial spin labeling at high magnetic field. Magn. Reson. Med. 79, 1314–1324 (2018).
6. Buxton, R. B. et al. A general kinetic model for quantitative perfusion imaging with arterial spin labeling. Magn. Reson. Med. 40, 383–96 (1998).
7. Brossard, C. et al. MP3: Medical Software for Processing Multi-Parametric Images Pipelines. Front. Neuroinform. 14, 16 (2020).
Figures

Representative cerebral blood flow (CBF) and cerebrovascular reactivity maps for 1 representative wild type (WT) and 1 representative APP23 mouse, both 24 months old. From left to right, coronal slices are shown in the posterior to anterior orientation.

Cerebral blood flow (CBF) and cerebrovascular reactivity (CVR) time profiles (mean ± standard deviation) for wild type (WT) and APP23 mice in the 24 months cohort. In the left graphs, the profiles are shown for the whole mid-brain (middle slice), as indicated in the raw, representative EPI on the top left, with the region of interest shown in green. In the right graphs, the profiles are shown for the somatosensory cortex, as illustrated on the top right.

Cerebral blood flow (CBF) and cerebrovascular reactivity (CVR) time profiles (mean ± standard deviation) for wild type (WT) and APP23 mice in the 18 months cohort. In the left graphs, the profiles are shown for the whole mid-brain (middle slice), as indicated in the raw, representative EPI on the top left, with the region of interest shown in green. In the right graphs, the profiles are shown for the somatosensory cortex, as illustrated on the top right.

Figure 4: Comparisons between wild type (WT) and APP23 cerebral blood flow (CBF) and cerebrovascular reactivity (CVR) values, individually averaged per mouse for the somatosensory cortex. Male mice are indicated with triangles, female mice with circles.

Figure 5: Microbleed counts in 24 months old APP23 mice. On the left, a mid-brain slice is shown with 5 visible microbleeds indicated with yellow arrows. In the middle and right graph respectively, whole mid-brain cerebral blood flow (CBF) and cerebrovascular reactivity (CVR) are correlated with the whole-brain microbleed count.