0419
Impaired brain perfusion and cerebrovascular reactivity in the zQ175 mouse model of Huntington’s Disease, a longitudinal pCASL-MRI study1Bio-Imaging Lab, University of Antwerp, Antwerp, Belgium, 2µNEURO Research Centre of Excellence, University of Antwerp, Antwerp, Belgium, 3C.J. Gorter Center for High Field MRI, Leiden University Medical Center, Leiden, Netherlands, 4CHDI Management/CHDI Foundation, Princeton, NJ, United States
Synopsis
Abnormal cerebral vasculature and consequent diminished cerebrovascular function have been shown to play a role in Huntington’s Disease (HD). However, how these impairments reflect on cerebral blood flow (CBF) dynamics and vascular reactivity (CVR) have been poorly understood. Towards this, we performed a longitudinal study measuring CBF and CVR, using pCASL, in the zQ175 KI Huntington’s disease (HD) mouse model at pre-manifest (3/4.5 months), disease onset (6 months) and manifest (9 months) stage. Our results demonstrate decreased CBF under CO2 challenge at disease onset and decreased CVR in manifest HD stage in the zQ175 KI mice compared to age-matched controls.
Introduction
Huntington’s Disease (HD) is an autosomal, dominantly inherited neurodegenerative (ND) disease with an abnormal expansion of the CAG (cytosine-adenine-guanine) repeat in the huntingtin gene. Despite the known genetic background, HD pathomechanisms are still not fully understood, limiting the possibility of a successful therapy thus far. Brain perfusion, cerebrovascular functional and anatomical integrity have been shown to be compromised in ND diseases, such as HD. More specifically, in manifest HD patients, hypoperfusion is markedly reduced in cortical and basal ganglia brain regions1, whereas recent, preliminary findings in pre-symptomatic HD have shown cerebrovascular reactivity (CVR) alterations in subcortical white matter areas2. This raises the potential of using vascular-based changes as a biomarker which can allow for probing new therapeutic strategies. In order to better characterize perfusion dynamics at different stages of HD and explore the potential of a cerebrovascular biomarker, we used the zQ175 KI heterozygous (HET) model which mimics the human HD progression the closest3, with motor deficits starting at 6 months, marked as disease symptom onset4. Hence, in our study, we sought to investigate cerebral blood flow (CBF) and CVR changes in the zQ175 HET HD mouse model using pseudo-Continuous Arterial Spin Labelling (pCASL) MRI.Methods
Longitudinal pCASL MRI was performed on a 7T Bruker scanner on two different cohorts of wild-type (WT, n=10) and HET (n=10) zQ175 KI HET mice in different conditions, at 2 separate scan moments: (1) measuring plain perfusion under baseline (66% N2 and 33% O2) at 3, 6 and 9 months, (2) assessing CVR (%ΔCBF between baseline and CO2 challenge) via measuring perfusion under baseline (100% O2) and CO2 challenge (90% O2 10% CO2) at 4.5, 6 and 9 months of age. Mice were anesthetized with a combination of 0.4% isoflurane and medetomidine (0.05mg/kg s.c. bolus; 0.01mg/kg/h s.c. infusion). The physiological parameters were monitored and kept stable throughout the scan procedure. pCASL scans were acquired 40 min post bolus for 7 minutes during baseline (both conditions), 7 minutes under CO2 challenge and 3.5 minutes under recovery (Fig. 1, A). Preceding the pCASL acquisition, a time-of-flight angiogram was acquired to define the labelling position, a labelling efficiency map as well as a pCASL scan in order to determine the optimal phase steps for the labelled and control RF pulse. The pCASL sequence5 is a spin echo (SE) EPI with labelling time of 3000ms, post label delay (PLD) of 200ms, TR/TE 3450/19.5ms. 120/120/60 label and control images are acquired (60/60/30 CBF measures) in baseline/challenge/recovery, for 5 coronal slices with a spatial resolution of 0.26 x 0.39 x 0.8 mm³. Absolute CBF was quantified using a T1 map (estimated from an extra slice-selective Inversion Recovery acquisition) and calculated using the single compartment model6. Realignment, co-registration to a T1 weighted image, spatial normalization and in-plane smoothing of the label/control images was performed using SPM12 software. A study-based template was created in ANTs. ROI- based analysis (RBA) was performed using pre-defined regions of interest (ROI) from which mean CBF values per subject were extracted. Two-sample T-tests on the distributions of CBF and CVR data of WT and HET mice were performed with FDR correction (p<0.05) in GraphPad Prism 9.2. Explorative voxel-based analysis (VBA) to reveal - at each age - local differences in CBF and CVR between WT and HET mice was performed in SPM12 using two-sample t-tests with p<0.01, uncorrected.Results
At disease symptom onset (6 months), RBA demonstrates a significant lower perfusion in HET mice during 100% O2 baseline condition in the piriform cortex, and - more robust - significant lower CBF during CO2 challenge across multiple brain regions (Fig.2.A) with no significant CVR changes present. This is in line with the VBA maps that display lower CBF in the same regions and conditions (Fig.2.B). At a manifest disease stage (9 months), the dynamic profiles of brain averaged CBF from baseline to CO2 challenge demonstrate a smaller increase in CBF in HET compared to WT mice (Fig.1.B), which is in accordance with the RBA where the retrosplenial cortex has lower CBF under CO2 challenge (Fig.3.A). An overall lower CVR is present in HET across different brain areas (Fig.3.A), while no CBF changes were detected in 100% O2 baseline conditions. The VBA maps display differences in the same line as the RBA with an overall lower CBF and %ΔCBF in HET (Fig.3.B). Even though perfusion measurements under normoxic condition did not show any statistically significant difference between both groups at any age, at 9 months, both RBA and VBA analysis showed a trend in higher CBF in several brain regions (Fig.4.A, B).Discussion and Conclusion
Our main findings demonstrate that, in zQ175 HET mice, at disease symptom onset, there is lower perfusion under CO2 challenge and impaired CVR at a manifest stage. The compromised vascular response indicates aberrations at the level of the neurovascular unit, potentially as a consequence of mutant huntingtin (mHTT) depositions within blood vessels7 and different cell types, such as smooth muscle cells, astrocytes8 or pericytes. This study highlights the relevance of assessing CBF and CVR alterations as a prospective biomarker which can be used for evaluating efficacy of future therapies that aim at lowering mHTT or targeting different vascular components.Acknowledgements
No acknowledgement found.References
1. Chen JJ, Salat DH, Rosas HD. Complex relationships between cerebral blood flow and brain atrophy in early Huntington's disease. Neuroimage. 2012;59(2):1043-1051. doi:10.1016/j.neuroimage.2011.08.112
2. Chan ST, Mercaldo ND, Kwong KK, Hersch SM, Rosas HD. Impaired Cerebrovascular Reactivity in Huntington's Disease. Front Physiol. 2021 Jul 21;12:663898
3. Menalled L., Kudwa AE, Miller S, et al. Comprehensive behavioral and molecular characterization of a new knock-in mouse model of Huntington's disease: zQ175. PLoS One. 2012; 7(12): e49838.
4. Heikkinen T, Bragge T, Bhattarai N, Parkkari T, Puoliväli J, Kontkanen O, Sweeney P, Park LC, Munoz-Sanjuan I. Rapid and robust patterns of spontaneous locomotor deficits in mouse models of Huntington's disease. PLoS One. 2020 Dec 28;15(12):e0243052.
5. Hirschler L, Debacker CS, Voiron J, et al. Interpulse phase corrections for unbalanced pseudo-continuous arterial spin labeling at high magnetic field. Magn Reson Med. 2018;79(3):1314-1324
6. Buxton, R. B. Quantifying CBF with arterial spin labeling. J Magn Reson Imaging. 2005; 22, 723-726
7. Drouin-Ouellet J, Sawiak SJ, Cisbani G, Lagacé M, Kuan WL, Saint-Pierre M, Dury RJ, Alata W, St-Amour I, Mason SL, Calon F, Lacroix S, Gowland PA, Francis ST, Barker RA, Cicchetti F. Cerebrovascular and blood-brain barrier impairments in Huntington's disease: Potential implications for its pathophysiology. Ann Neurol. 2015 Aug;78(2):160-77.
8. Hsiao HY, Chen YC, Huang CH, Chen CC, Hsu YH, Chen HM, Chiu FL, Kuo HC, Chang C, Chern Y. Aberrant astrocytes impair vascular reactivity in Huntington disease. Ann Neurol. 2015 Aug;78(2):178-92.
Figures
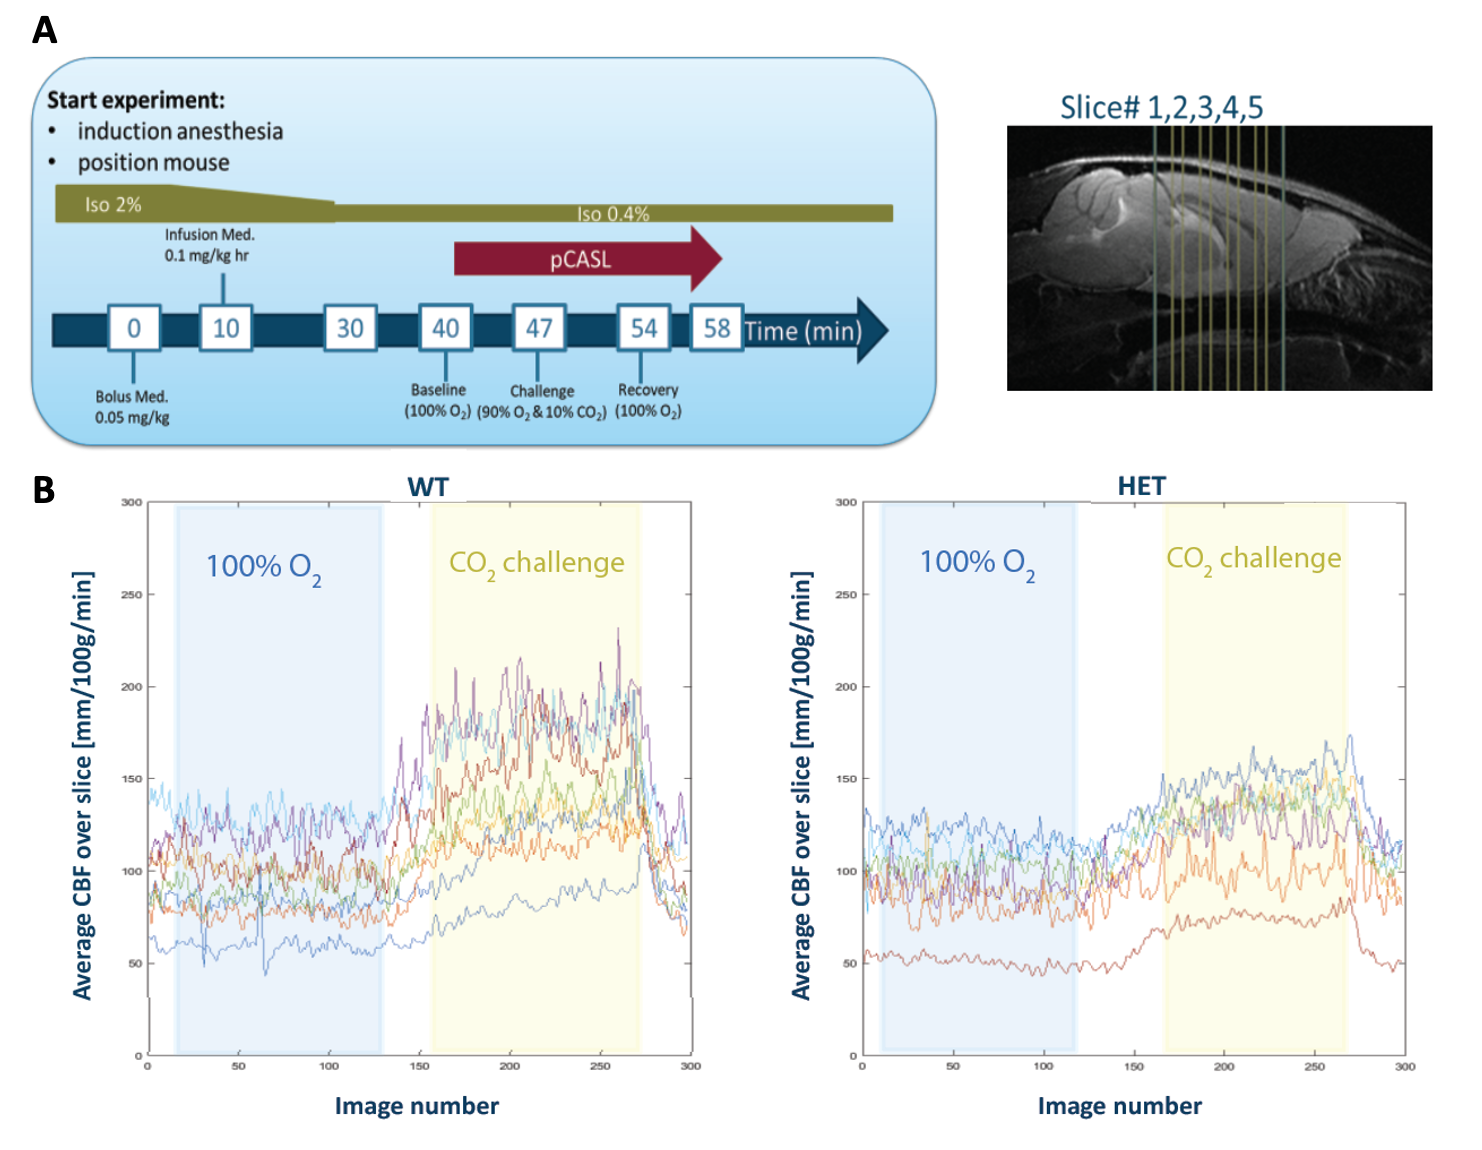
Fig.1: (A) Acquisition scheme for pCASL with CO2 challenge (left) and the anatomical position of the 5 coronal slices (right); (B) Example of the average CBF across time during baseline (blue insert) and CO2 challenge (yellow insert) conditions for both WT and HET mice.
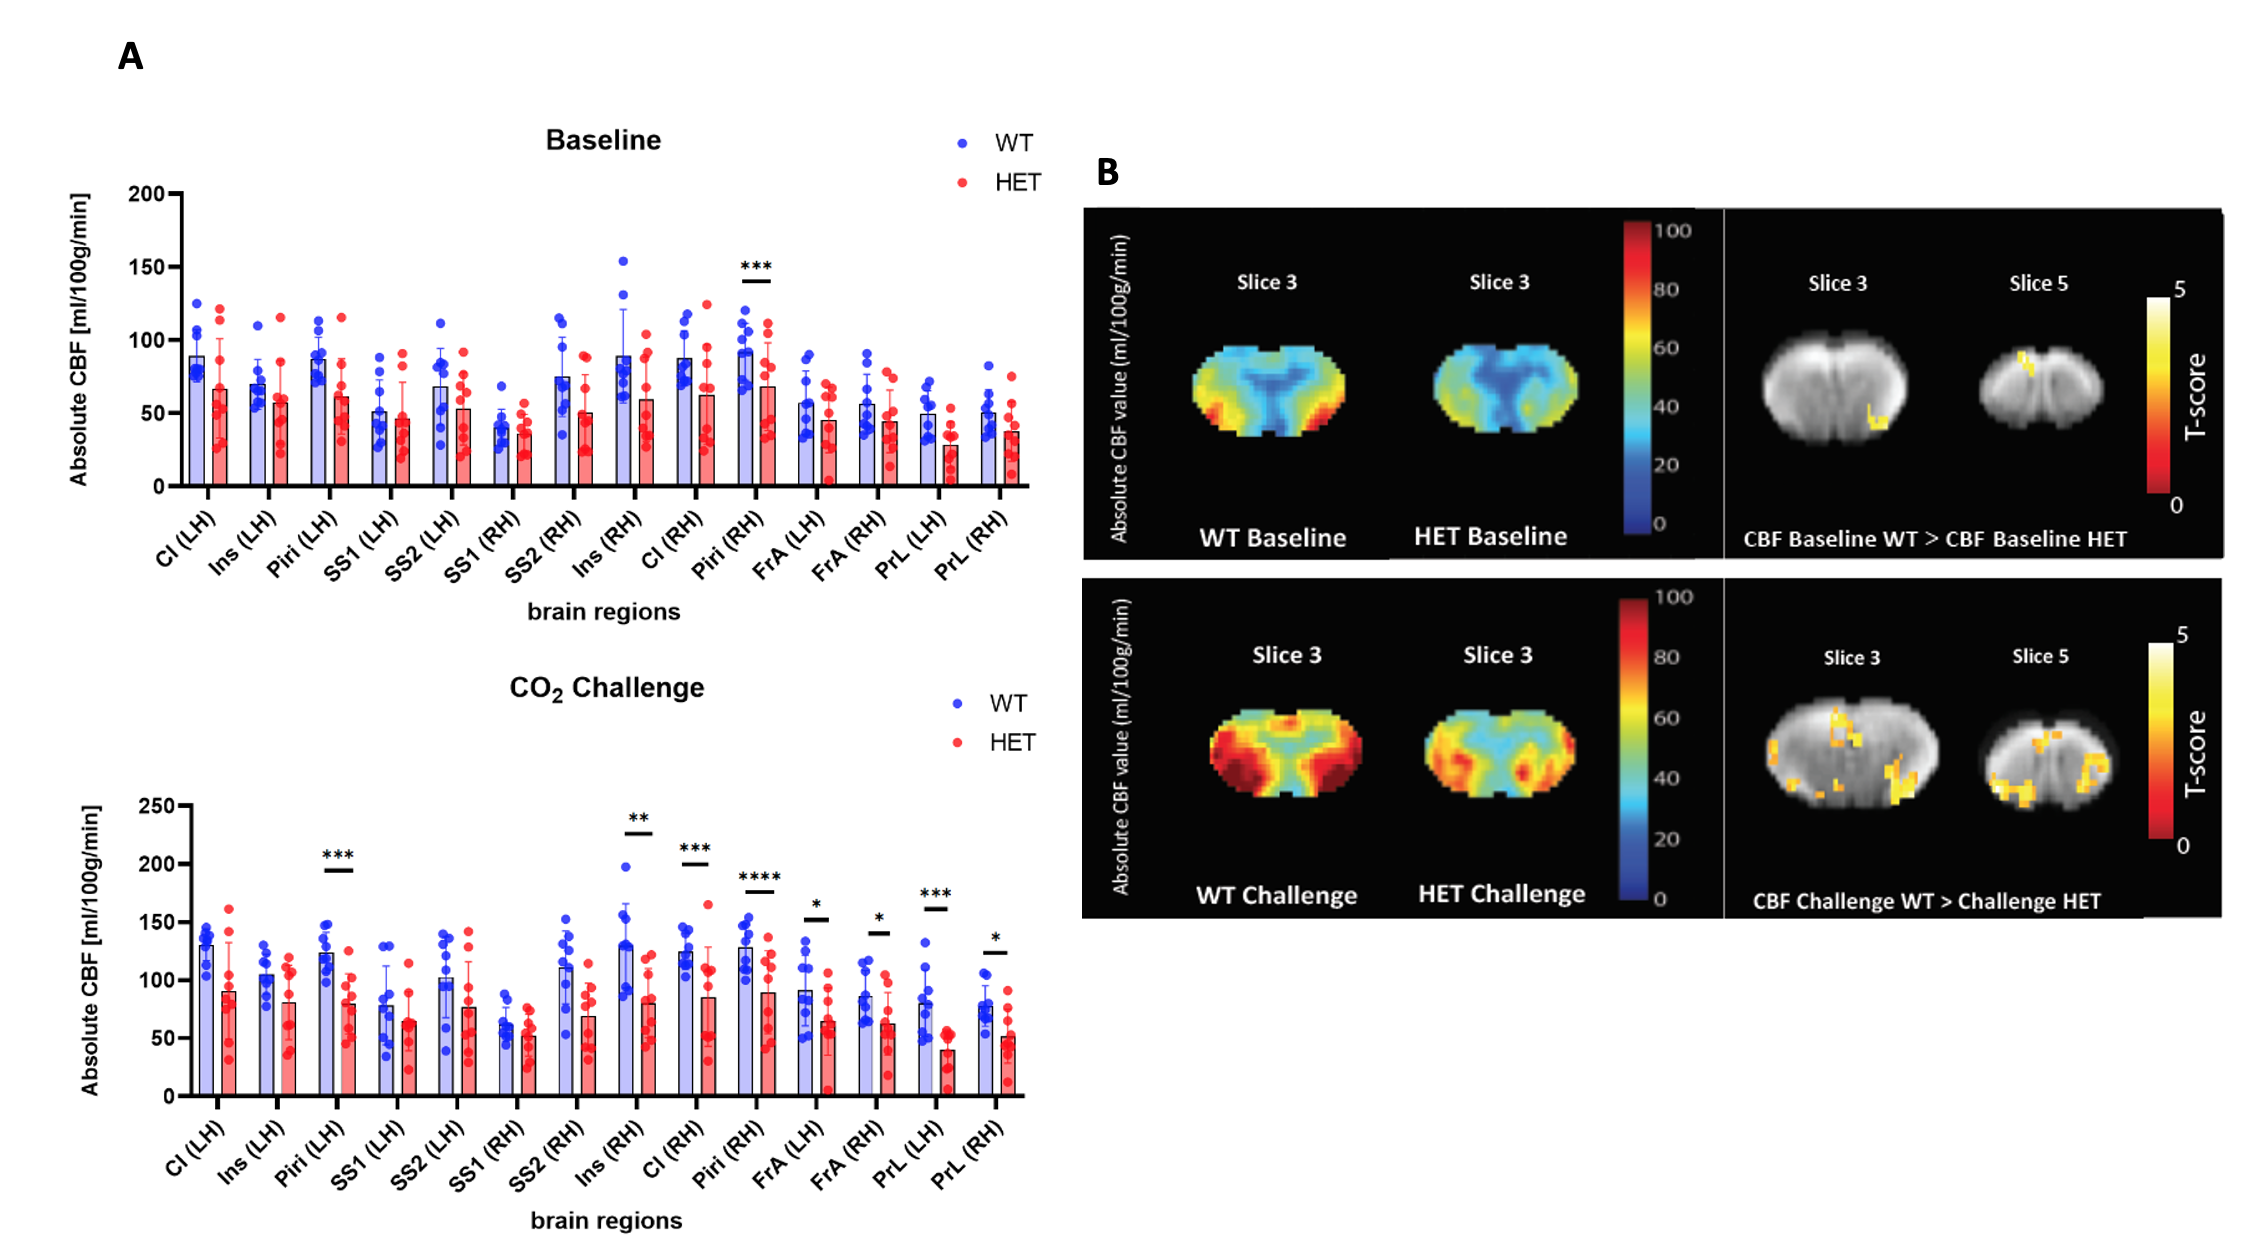
Fig.2: (A) ROI-based analysis at 6 months of age demonstrates under 100% O2 baseline, significant lower CBF in Piriform Cortex (Piri) in HET compared to WT mice, while under CO2 challenge multiple regions show significant lower CBF in HET; (B) Mean CBF maps for both WT and HET under 100% O2 baseline and CO2 challenge and VBA statistical maps demonstrating decreased CBF in the same ROIs as (A) in HET in both conditions; Two-sample T-test for RBA with p<0.05 (FDR corrected) and VBA statistical maps with p<0.01 (uncorrected)
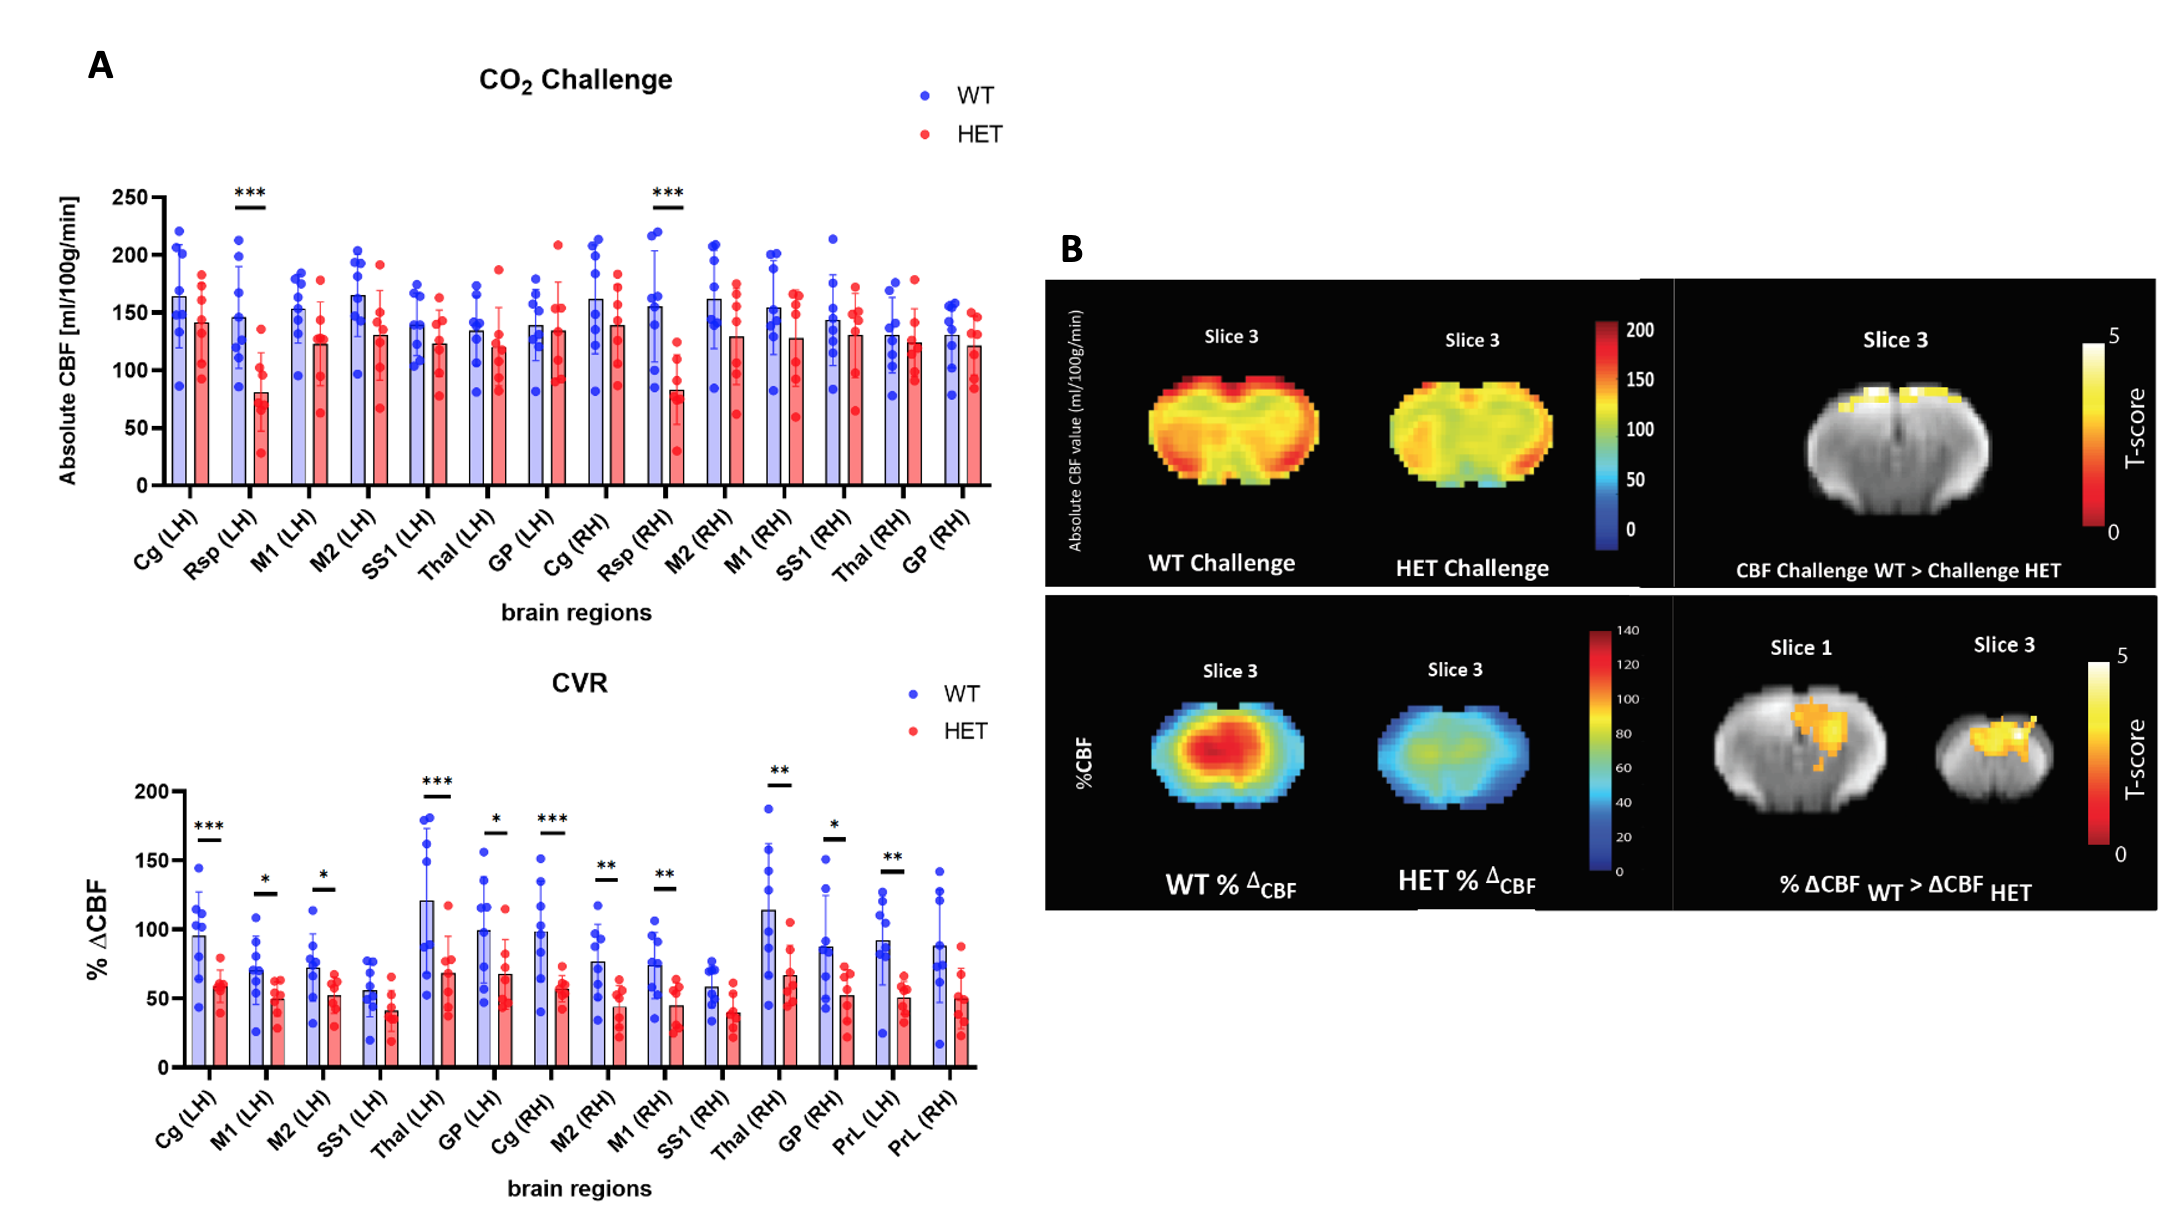
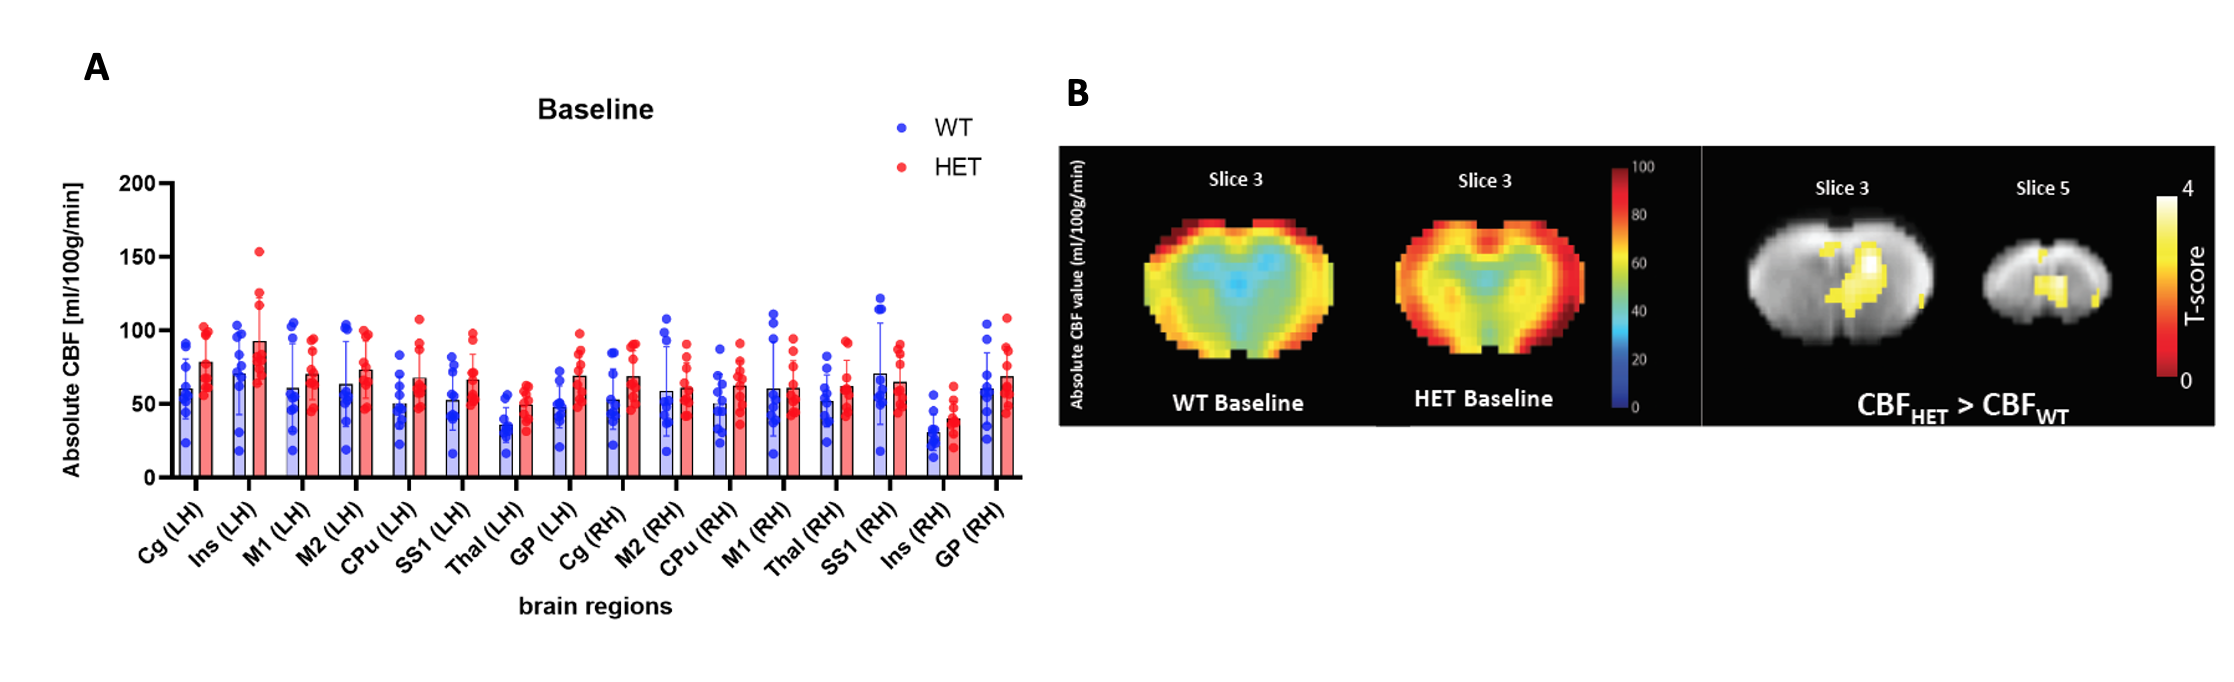
Fig.4: (A) ROI-based analysis of perfusion under normoxic condition at 9 months of age shows only a trend of higher CBF in HET in several regions compared to WT mice; (B) Mean CBF maps for both WT and HET and VBA statistical map demonstrating higher CBF in HET compared to WT mice; Two-sample T-test for RBA with p<0.05 (FDR corrected) and VBA statistical maps with p<0.01 (uncorrected)