0418
Whole brain mapping of transcranial electrical stimulation-induced effects by BOLD-fMRI in rats1Neuroscience Institute, NYU Langone Health, New York, NY, United States, 2Department of Radiology, NYU School of Medicine, New York, NY, United States
Synopsis
Transcranial Electrical Stimulation (TES) is a noninvasive method that can modulate neuronal activity. Despite 20 years of intensive research, the basic mechanisms, and the extent of TES influence on brain functions is still not well understood. To gain a better understanding of the TES effects, we combined neurostimulation with BOLD-fMRI in rats. We have designed an MR-compatible TES setup, including a deuterium-based stimulation electrode system. Our results revealed BOLD responses to TES and altered cortical and cortico-subcortical network responses induced by a variety of stimulation patterns and intensities.
Introduction
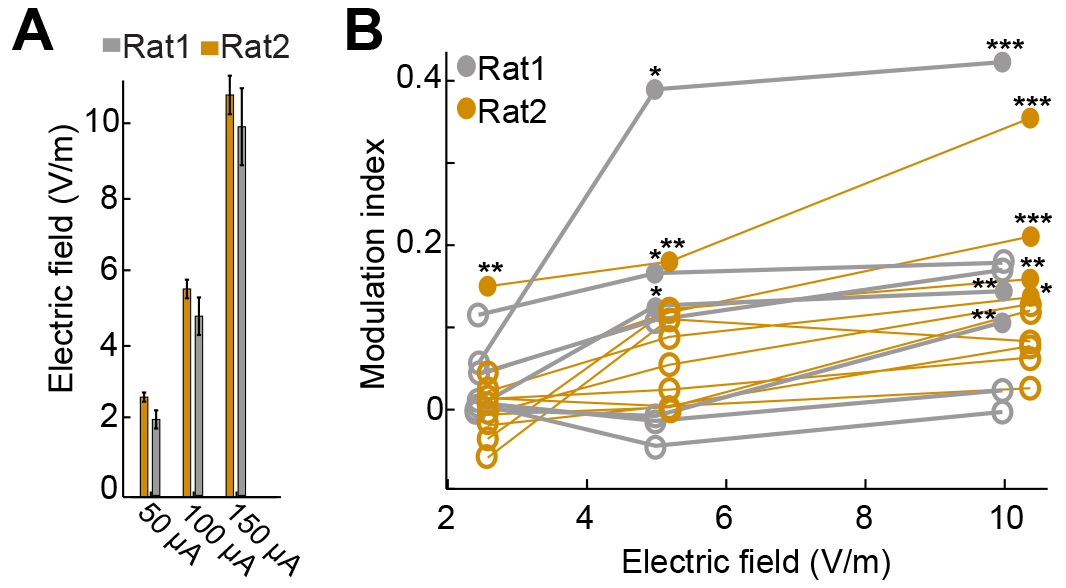
Non-invasive brain stimulation techniques provide an unprecedented opportunity to probe and modify brain circuits in health and disease. These methods have contributed numerous insights into brain function and are now widely used in clinical settings, including rehabilitation and treatment of mental disorders1. Transcranial Electrical Stimulation (TES) has gained popularity because of its convenience (the required equipment is portable) and potential as a chronic therapy2. The efficacy of TES depends on stimulation intensity, duration, polarity, and electrode montage3. TES-induced electric fields are believed to be stronger closest to the stimulation electrode4. However, modeling studies suggest that unpredicted areas such as the brainstem can also be stimulated, due to the current shunting effects of the cerebrospinal fluid4. In vitro studies have shown a linear relationship between applied field and physiological response5. However, this dose-response relationship is more complex in vivo6 (Fig. 1), and perhaps even more so in humans due to cortical folding and different scalp and skull thickness4. Integration of TES with magnetic resonance imaging (MRI) techniques provides a tool to directly perturb neuronal functions while monitoring brain activities7,8. It enables researchers to study how TES modulates targeted brain regions, and how modulation occurs through anatomical and functional connectivity9. Varying stimulation pattern and intensity can provide critical insight for dose-response. The goal of our study is to quantify TES-affected brain regions using blood oxygenation level dependent (BOLD) resting state functional MRI (fMRI) in anesthetized rats and compare the effective intensities of stimulation on functional connectivity of different brain areas.Methods
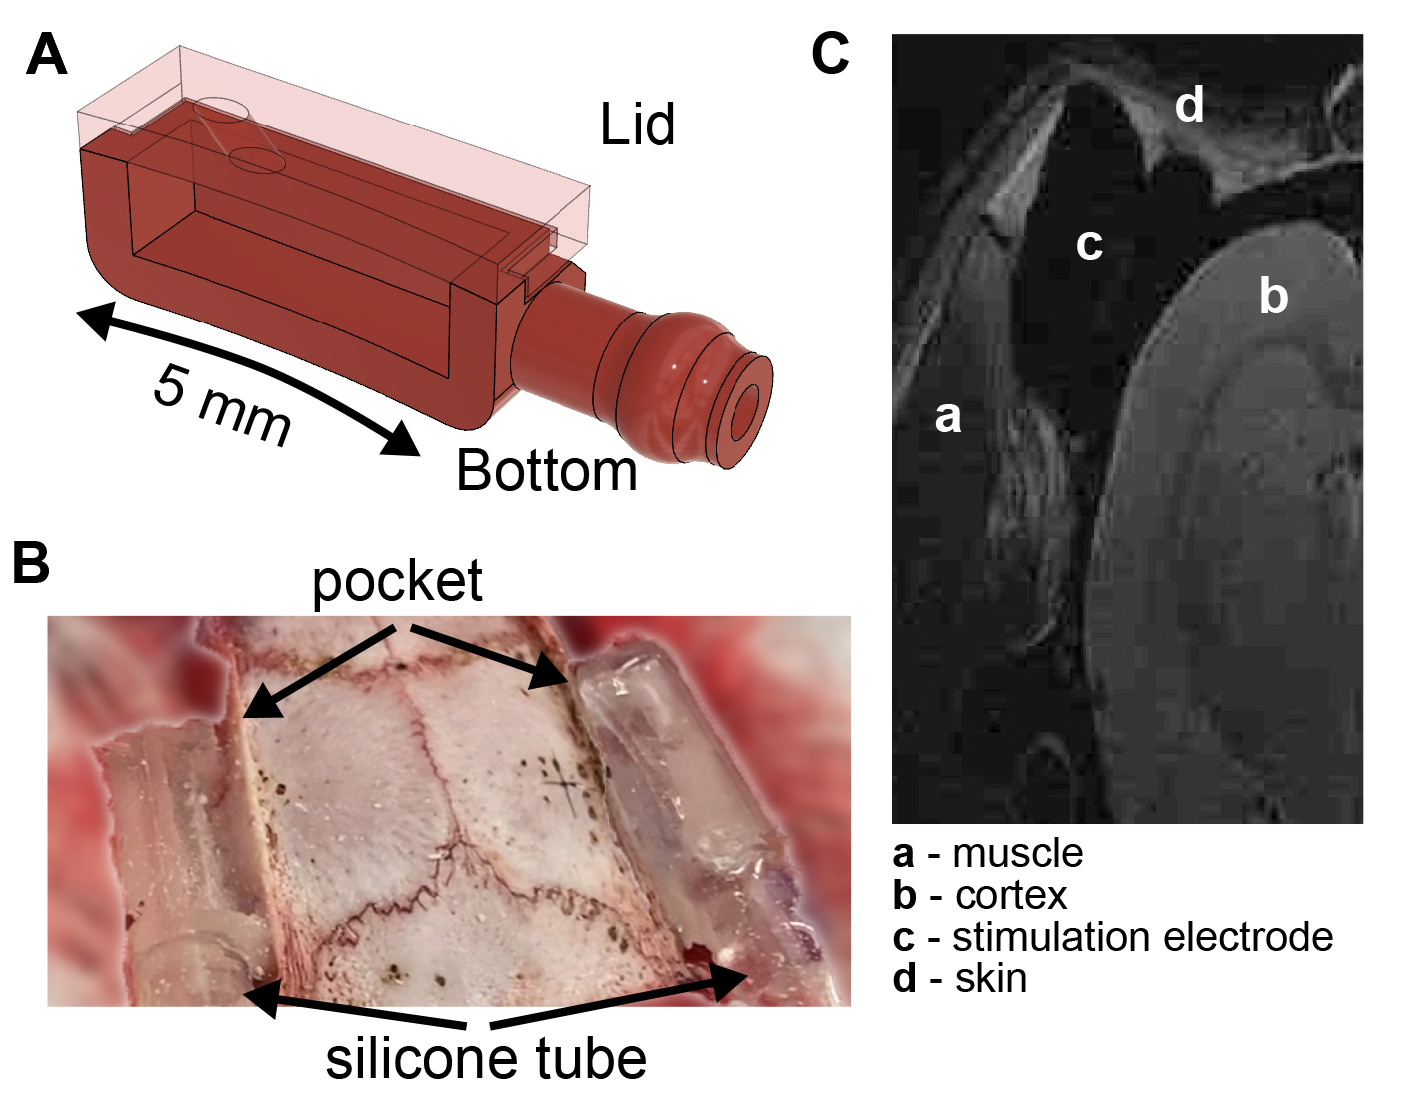
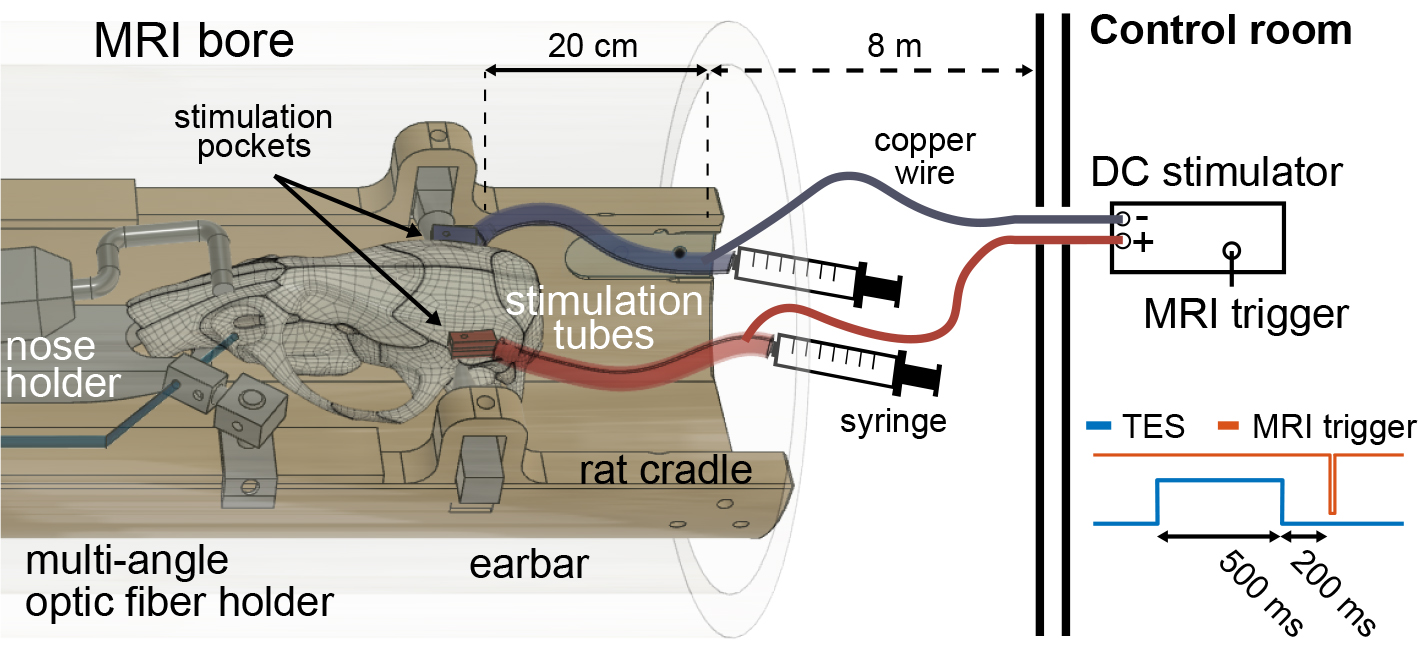
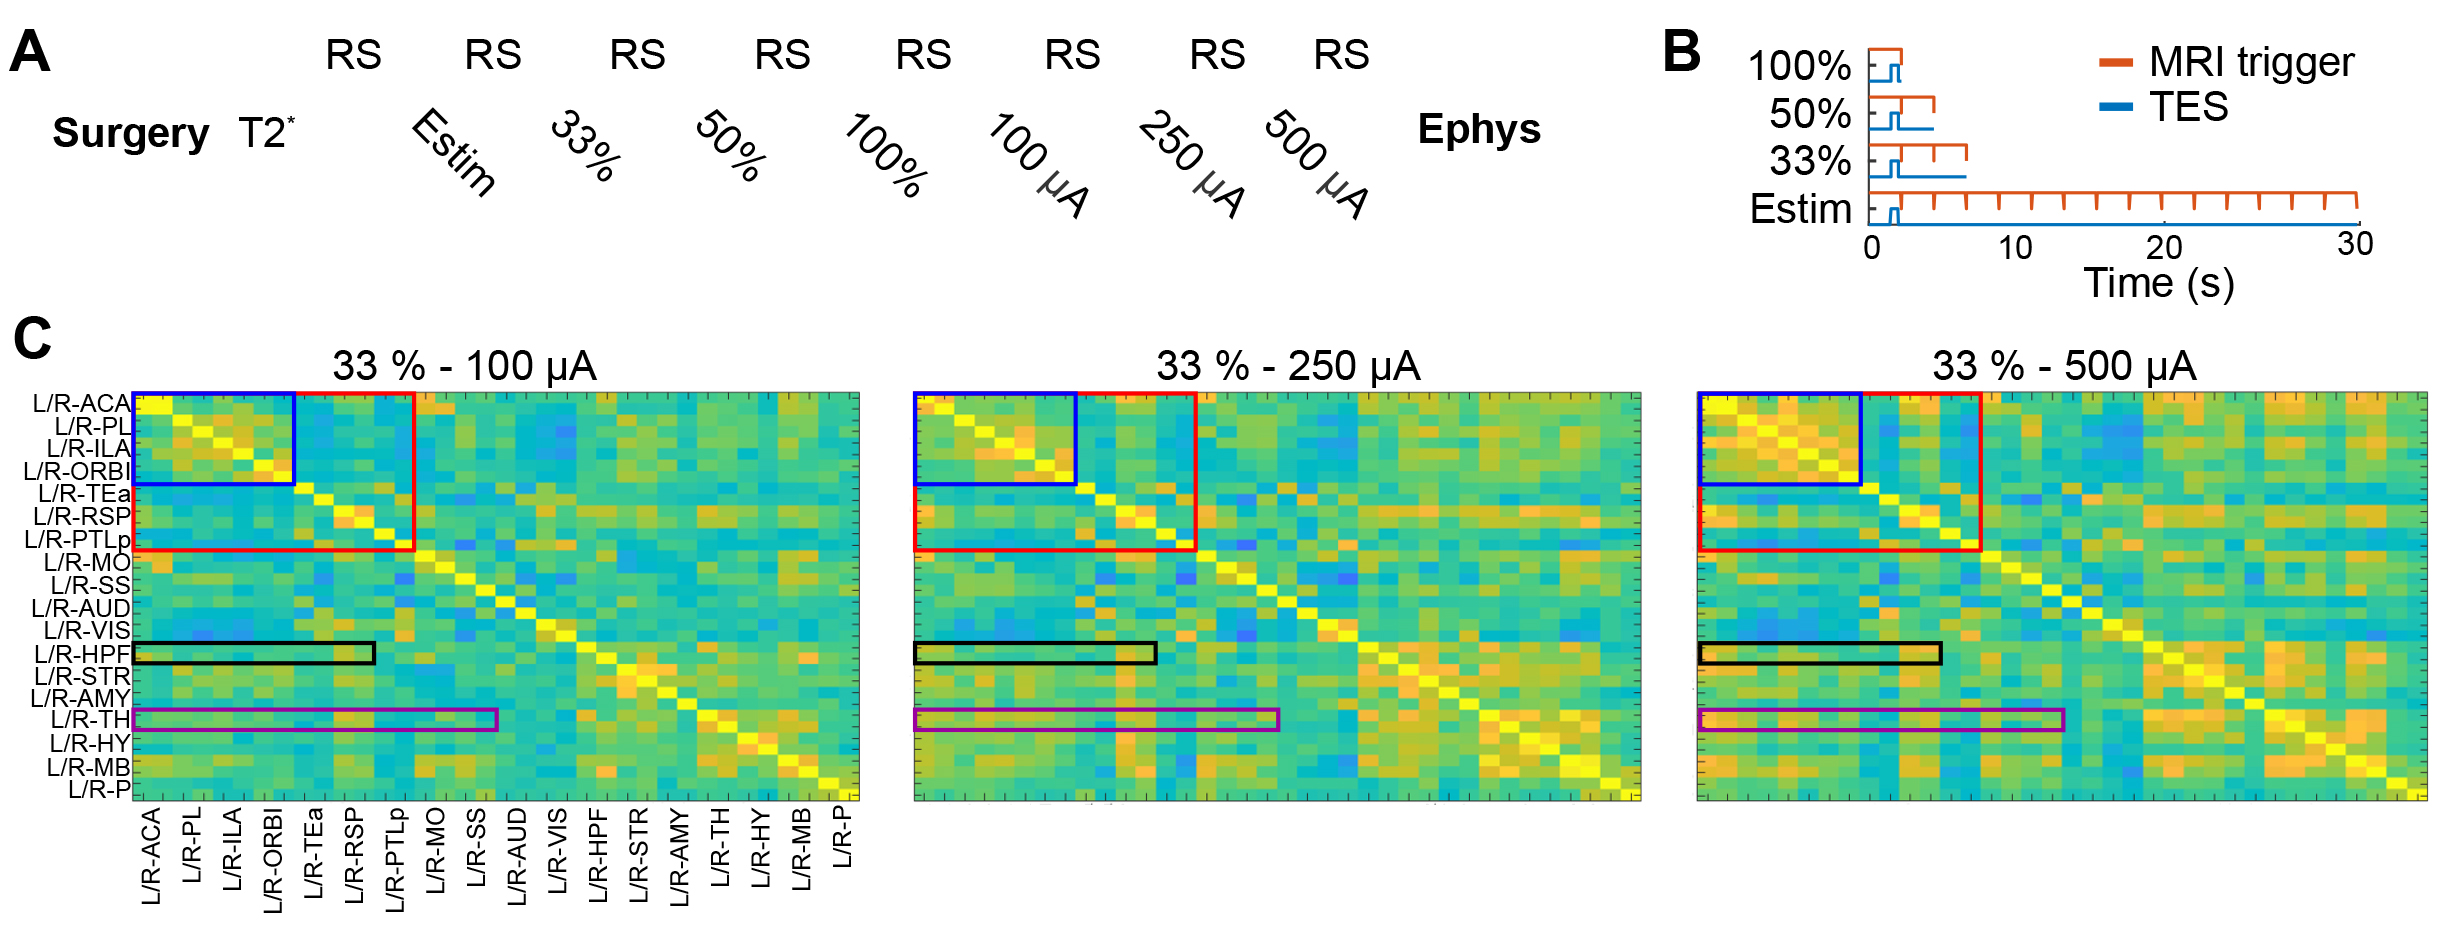
fMRI data were acquired with T2*-weighted single-shot GE-EPI sequence on urethane anesthetized rats (N=3, 1.4 g/kg, IP). Rat brain excluding the cerebellum was covered using 23 axial slices with the following parameters: TE/TR=13.4/(1500 or 2200)ms (TES or rsfMRI), 300 repetitions and resolution = 0.23 x 0.23 x 0.8mm. 500-ms constant current pulses were applied at every 33, 6.6, 4.4 or 2.2 seconds (100, 33, 50 and 100 %, respectively). Resting-state (rs)-fMRI data were acquired between TES pulses. Physiological parameters (rectal temperature, respiratory rate, and oxygen saturation) were monitored.Electrical stimulation was delivered using our custom designed, 3D-printed pockets (2x5 mm, Fig. 2A). The pocket consists of a bottom part and a lid. The bottom part was secured to the temporal bone bilaterally with dental cement, and the lid with a hole was attached to the bone/bottom to create a watertight seal (Fig. 2B). The pockets were filled with deuterium using a 2ml syringe. To increase conductivity, NaCl was added to the deuterium (5%). To reduce MR artifacts (e.g. RF heating and eddy currents on the wires, Fig. 2C), twisted copper wires were inserted inside the silicone tube 20cm away from the brain (Fig. 3). Resistance of stimulation electrode was monitored regularly throughout the experiments. Electrical stimulation was delivered prior to the start of image acquisition (before the RF pulses) to reduce the interference between TES currents and MR signal (Fig. 3).
Different duty cycles were used to determine the TES-induced time courses of the BOLD signal. In addition, 3 different intensities were applied to establish a dose response (Fig. 4A,B). The fMRI data analysis included the following steps: EPI and structural image of each subject were normalized to a template space – Swanson’s rat atlas (down-sampled to 36 structures)10. Using these 36 nodes, whole brain functional connectivity (FC) matrix was mapped (average of 3 rats) to identify the networks that are affected by TES. Pearson’s correlation coefficient for each connection was calculated in subject’s space and normalized to a z-score using Fisher’s r-to-z transformation. After the MRI data acquisition, electrophysiology recording was performed from the hippocampus using a silicon probe. Neuronal activity was recorded for 30 min (baseline) followed by 300 trials of electrical stimulation (500-ms TES pulses followed by 2 s stimulation free epochs, two polarities at 500 µA intensity).
Results
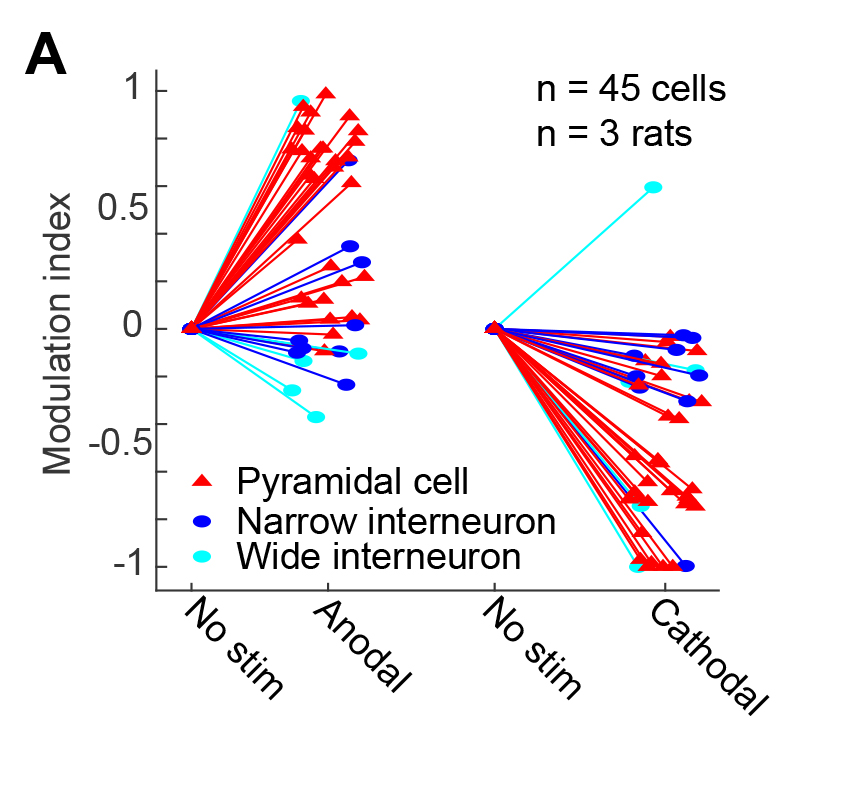
Several brain regions, including somatosensory/motor cortices, hippocampus, and thalamus showed BOLD responses to TES. Overall, we observed stimulation intensity-dependent changes in rat brain FC networks (Fig. 4C). Within the cortex, FC strength was strongly modified particularly in the prefrontal and default mode network (blue and red boxes) in response to the stimulation intensities from 100 µA to 250 and 500 µA. However, the cortico-hippocampal (black box) and thalamo-cortical (purple box) networks exhibited stronger modifications at intensities higher than 100 µA.Well isolated single units were recorded from the right hippocampus after BOLD-fMRI. Cells were classified into three putative cell types: narrow-interneurons, wide-interneurons, and pyramidal-cells11. Of the 45 isolated single units, 29 showed stimulation polarity dependent modulation of their spiking rate (Fig. 5A), verifying the effectiveness of TES in the same experiment.
Discussion
We developed an MR-compatible, deuterium-based, concurrent TES-fMRI stimulation system for rats, followed by electrophysiological verification. The effects of TES are not simply restricted to the area under the electrodes, but stimulation can also affect connectivity within cortical and cortico-subcortical networks. We found stimulation intensity-dependent changes in prefrontal, default mode, cortico-hippocampal and thalamo-cortical networks. We confirmed the functionality of our stimulation system in each rat using in vivo, extracellular electrophysiology. Our data can also provide insights about the relationship between neuroimaging signals and brain electrophysiology.Acknowledgements
This work was performed at NYU Langone’s Preclinical Imaging Laboratory.References
1. Transcranial Direct Current Stimulation in Neuropsychiatric Disorders. (Springer International Publishing, 2021). doi:10.1007/978-3-319-33967-2.
2. Pinto, C. B., Teixeira Costa, B., Duarte, D. & Fregni, F. Transcranial Direct Current Stimulation as a Therapeutic Tool for Chronic Pain. J. ECT 34, e36–e50 (2018). 3. Peterchev, A. V. et al. Fundamentals of transcranial electric and magnetic stimulation dose: Definition, selection, and reporting practices. Brain Stimul. 5, 435–453 (2012).
4. Datta, A. et al. Gyri-precise head model of transcranial direct current stimulation: Improved spatial focality using a ring electrode versus conventional rectangular pad. Brain Stimul. 2, 201–7, 207.e1 (2009).
5. Bikson, M. et al. Effect of uniform extracellular DC electric fields on excitability in rat hippocampal slices in vitro. J. Physiol. 557, 175–190 (2004).
6. Esmaeilpour, Z. et al. Incomplete evidence that increasing current intensity of tDCS boosts outcomes. Brain Stimul. 11, 310–321 (2018).
7. Esmaeilpour, Z. et al. Methodology for tDCS integration with fMRI. Hum. Brain Mapp. 41, 1950–1967 (2020).
8. Ghobadi-Azbari, P. et al. fMRI and transcranial electrical stimulation (tES): A systematic review of parameter space and outcomes. Prog. Neuro-Psychopharmacology Biol. Psychiatry 107, 110149 (2021).
9. Alexander, A., Lee, J. E., Lazar, M. & Field, A. S. Diffusion tensor imaging of the brain. Neurotherapeutics 4, 316–329 (2007).
10. Swanson, L. W. Brain maps 4.0—Structure of the rat brain: An open access atlas with global nervous system nomenclature ontology and flatmaps. J. Comp. Neurol. 526, 935–943 (2018).
11. Petersen, P., Siegle, J., Steinmetz, N., Mahallati, S. & Buzsáki, G. CellExplorer: a graphical user interface and a standardized pipeline for visualizing and characterizing single neurons. bioRxiv 2020.05.07.083436 (2020).
Figures