0414
Mouse rsfMRI connectome fingerprinting recovers subject as well as genetically encoded Ca2+ indicator loci1Radiology and Biomedical Imaging, Yale University, New Haven, CT, United States, 2Interdepartmental Neuroscience Program, Yale University, New Haven, CT, United States, 3Biomedical Engineering, Yale University, New Haven, CT, United States, 4Department of Physiology, UCSF, San Francisco, CA, United States, 5Urology, Yale University, New Haven, CT, United States, 6Kavli Institute for Neuroscience, Yale University, New Haven, CT, United States, 7Neuroscience, Yale University, New Haven, CT, United States, 8Neurosurgery, Yale University, New Haven, CT, United States
Synopsis
We find that the connectome, from resting-state functional magnetic resonance imaging data, can be used to identify (ID) individuals across species (humans and mice). This finding hints at the potential to use these data for individualized medicine and for translational research. To this end, we interrogate how ID rates differ across species, and how the manipulations we introduce into animal models – the use of clones and genetically encoded calcium indicators (GECI) – impact the connectome. We find species-specific ID rates differ, but only require small portions of the connectome, and that GECI loci can be recovered using this framework.
Introduction
Functional fingerprinting using the connectome hints at the potential of rsfMRI data for individualized medicine. Functional MRI data are well suited to translational research, as these data can be collected from many species. It is thus important to understand how measures differ across species, and how the manipulations we introduce into animal models – such as the use of clones or the introduction of fluorophores – impact these analyses.Methods
We included longitudinal murine (N=48, 3 time-points), as well as human data (N=825, 2 time-points - from the human connectome project, HCP1). Mice belonged to each of five genotype groups (Fig. 1) distinguished by the locus of a GECI2.Mice were imaged weekly (Fig. 1) on an 11.7T magnet (Bruker). RsfMRI data were acquired using a gradient-echo, echo-planar-imaging (EPI) sequence, TR=1s, TE=9.1ms. Data were collected at 0.4×0.4×0.4mm3, across 28 slices. Each run had 600 repetitions (10-minutes). For the creation of a murine common space (Fig. 1), within each session, we acquired a high in-plane resolution multi-spin-multi-echo (MSME) image: TR/TE of 2500/20ms, 28 slices (0.4mm thick), and in-plane resolution 0.1×0.1mm2 (two averages) - repeated twice and averaged (Fig. 1). The prescription of these data matched those of the fMRI data. We also acquired an isotropic (0.2 mm) 3D-MSME whole-brain image: TR/TE of 5500/15ms, single average - repeated thrice and averaged (Fig. 1).
The murine3 and human4,5 data were preprocessed as described previously. Data from both species were used to compute connectomes (Fig. 2) for each subject at each time-point. The connectome is a measure of all region-to-region functional connectivity strengths (i.e., edges, derived using Pearson’s Correlation). For murine data, we imposed the Allen atlas6, and computed connectomes for each rsfMRI run (10-minutes, n=3-4 per session, Fig. 1). For human data, we used the Shen-268 atlas7. For both species, we computed time-point-to-time-point connectome similarity (Pearson’s Correlation). For this measure, all edges strengths in the connectome were correlated between data from two time-points (Fig. 1).
The ID of a subject (human/mouse), or genotype (mouse-only), was made based on whether the highest inter-session similarity belonged to the same subject (or genotype). For both species, we estimated how much data was needed to make an ID by randomly selecting a subset of all brain regions and repeating our analyses (100-iterations) (Fig. 2&3). Null distributions were created by permuting connectomes and subject labels (100-iterations). Using mouse data, to probe which brain circuits drove genotype ID, we computed an average genotype-specific connectome as well as an average connectome across all mice (all genotype groups) and measure the deviation of each genotype-specific connectome from the total connectome (Fig. 4&5).
Results
The human connectome is unique to the individual and as such can be used to identify a person across two rsfMRI sessions from different days4,5. We replicate this finding in a 6.5-fold larger sample (Fig. 2). Further, we find that only a small number of nodes (as few as 4), selected at random, are needed to make a significant number of correct IDs. With more and more data, the ID error rate drops exponentially reaching a minimum of 12% when all nodes are included.Using a comparable amount of rsfMRI data to humans (10-minutes), mice can also be identified when data are collected on different days (Fig. 3a). We test this finding using three sessions (6 comparisons). Like humans, mice can be identified with above random success using small fractions of the connectome (as few as 12 nodes). Unlike humans, mice are much more similar to one another. Even when data from the whole brain is used, error rates never drop below 88%. With increasing amounts of data, using all 40-minutes of data per session, this rate drops to 67% - still high relative to humans.
In addition to subject IDs using murine data, we explore genotype ID. For these analyses, the mouse is completely held-out from one imaging session. Thus, ID of genotype is always made between two different animals belonging to the same genotype. We find that genotype ID is above random (Fig. 3b), reaching a minimum error rate of 69% when 10-minutes of data are used. Similar to mouse ID, this finding is robust across session pairs and evident when small portions of the connectome (8 nodes) are used.
Human IDs using some established functional networks (e.g., frontoparietal) out-perform random networks of comparable size (error rates as low as 6%). This led us to examine if specific networks drive mouse genotype ID. Networks that underly genotype ID in mice are different for each group (Fig. 4&5). Yet, some regions are frequently implicated (somatosensory and visual areas). Apart from the SLC group (where cortical areas are most strongly implicated), the remaining four genotype groups show frequent cortical to subcortical edge involvement (Fig. 5).
Conclusion
The connectome can be used for subject ID in both humans and mice, albeit with markedly different error rates. For ID rates near ceiling, only a small portion of the connectome is needed in either species. Beyond subject ID in mice, genotype (or locus of a GECI) ID can be revealed using rsfMRI connectivity data. These findings have implications for studies using rsfMRI data for individual analyses and GECIs.Acknowledgements
All members of the Multiscale Imaging and Spontaneous Activity in Cortex (MISAC) collaboration at Yale University. Peter Brown for valuable input on the design and building the RF saddle coil. Cheryl Lacadie for help with data registration. This work was supported by funding from the NIH: R01 MH111424 as well as U01 N2094358.References
1. Van Essen DC, Smith SM, Barch DM, Behrens TE, Yacoub E, Ugurbil K; WU-Minn HCP Consortium. The WU-Minn Human Connectome Project: an overview. Neuroimage. 2013 Oct 15;80:62-79.
2. Nakai J, Ohkura M, Imoto K. A high signal-to-noise Ca(2+) probe composed of a single green fluorescent protein. Nat Biotechnol. 2001 Feb;19(2):137-41.
3. Lake EMR, Ge X, Shen X, Herman P, Hyder F, Cardin JA, Higley MJ, Scheinost D, Papademetris X, Crair MC, Constable RT. Simultaneous cortex-wide fluorescence Ca2+ imaging and whole-brain fMRI. Nat Methods. 2020 Dec;17(12):1262-1271.
4. Finn ES, Shen X, Scheinost D, Rosenberg MD, Huang J, Chun MM, Papademetris X, Constable RT. Functional connectome fingerprinting: identifying individuals using patterns of brain connectivity. Nat Neurosci. 2015 Nov;18(11):1664-71.
5. Shen X, Finn ES, Scheinost D, Rosenberg MD, Chun MM, Papademetris X, Constable RT. Using connectome-based predictive modeling to predict individual behavior from brain connectivity. nature protocols. 2017 Mar;12(3):506-18.
6. Lein ES, Hawrylycz MJ, Ao N, Ayres M, Bensinger A, Bernard A, Boe AF, Boguski MS, Brockway KS, Byrnes EJ, et al. Genome-wide atlas of gene expression in the adult mouse brain. Nature. 2007 Jan 11;445(7124):168-76.
7. Shen X, Tokoglu F, Papademetris X, Constable RT. Groupwise whole-brain parcellation from resting-state fMRI data for network node identification. Neuroimage. 2013 Nov 15;82:403-15.
Figures
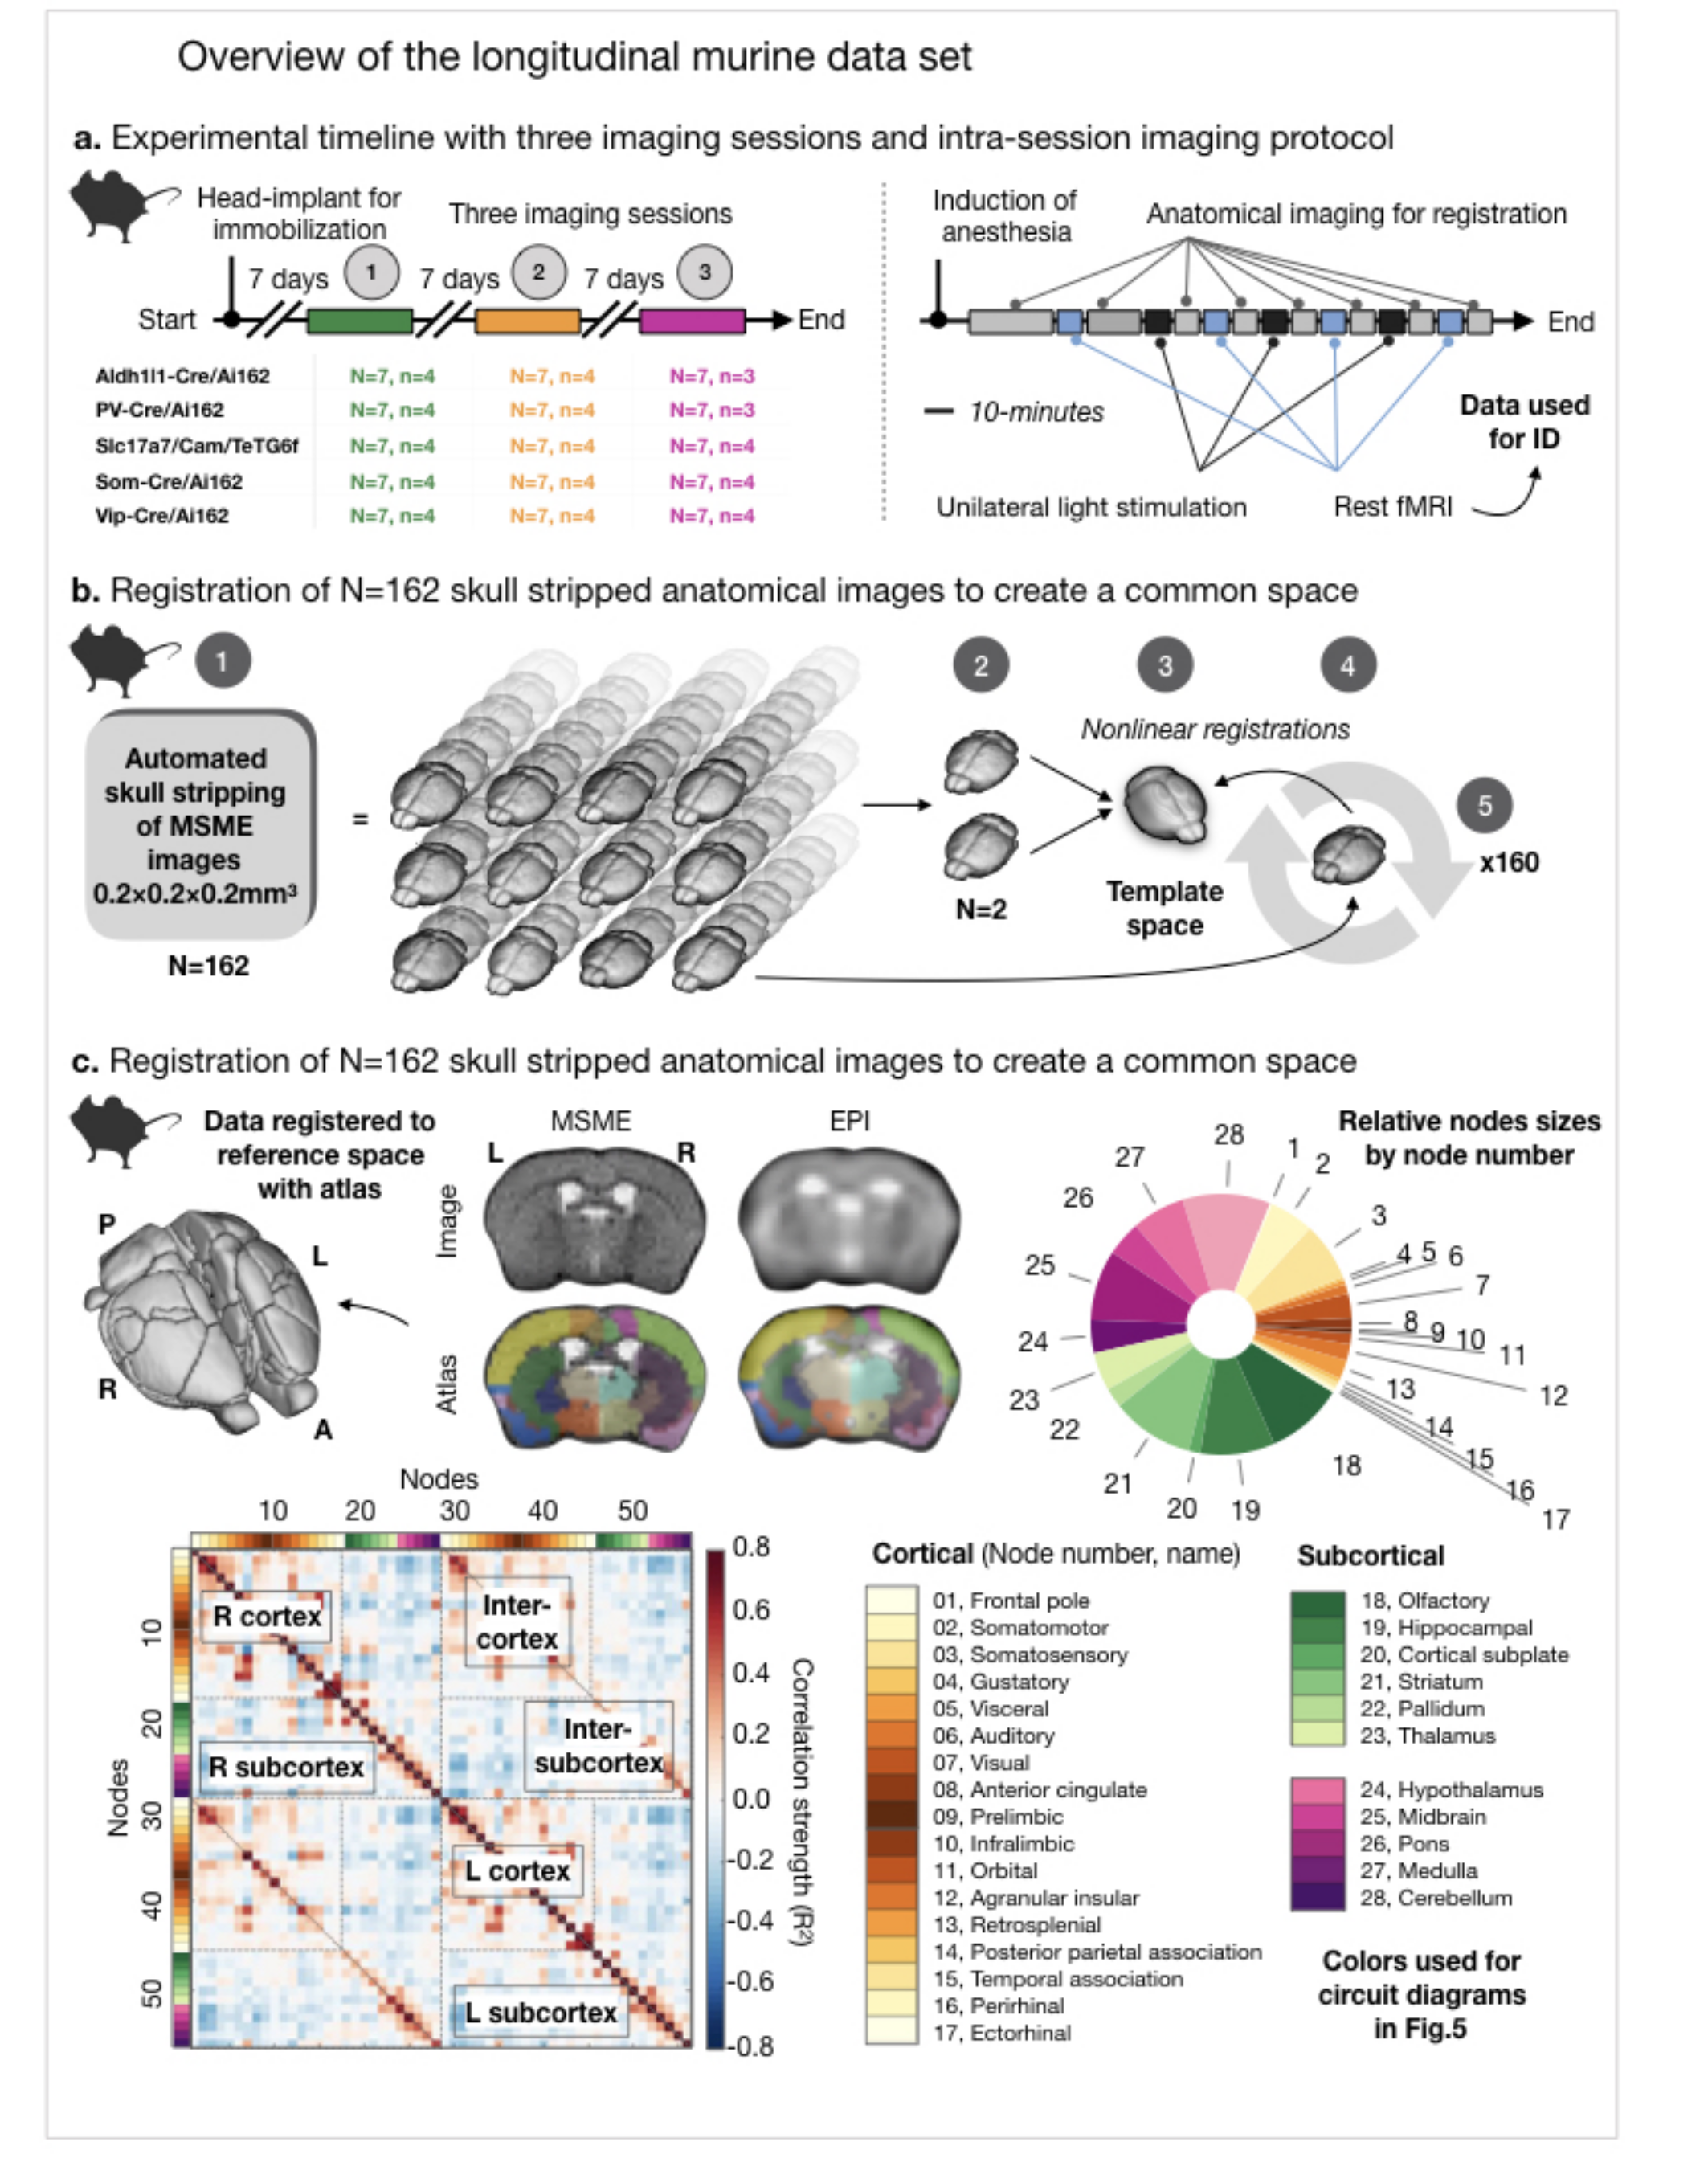
Fig. 1. Longitudinal murine dataset.
5 groups of mice (N=7/group, n=3/4 10-mins runs of rsfMRI data), each with a different GCaMP label, were imaged 3 times (a, left). In each session, anatomical (MSME) and fMRI data were collected (a, right). The skull stripped MSMEs were registered to create a common space (b); this was registered to the Allen Atlas (28 regions per hemisphere) (c). All EPIs were linearly registered to the within-session MSME and moved to common space. Region names/sizes are shown. Average connectome for all murine data is shown with cortical/subcortical areas labeled.
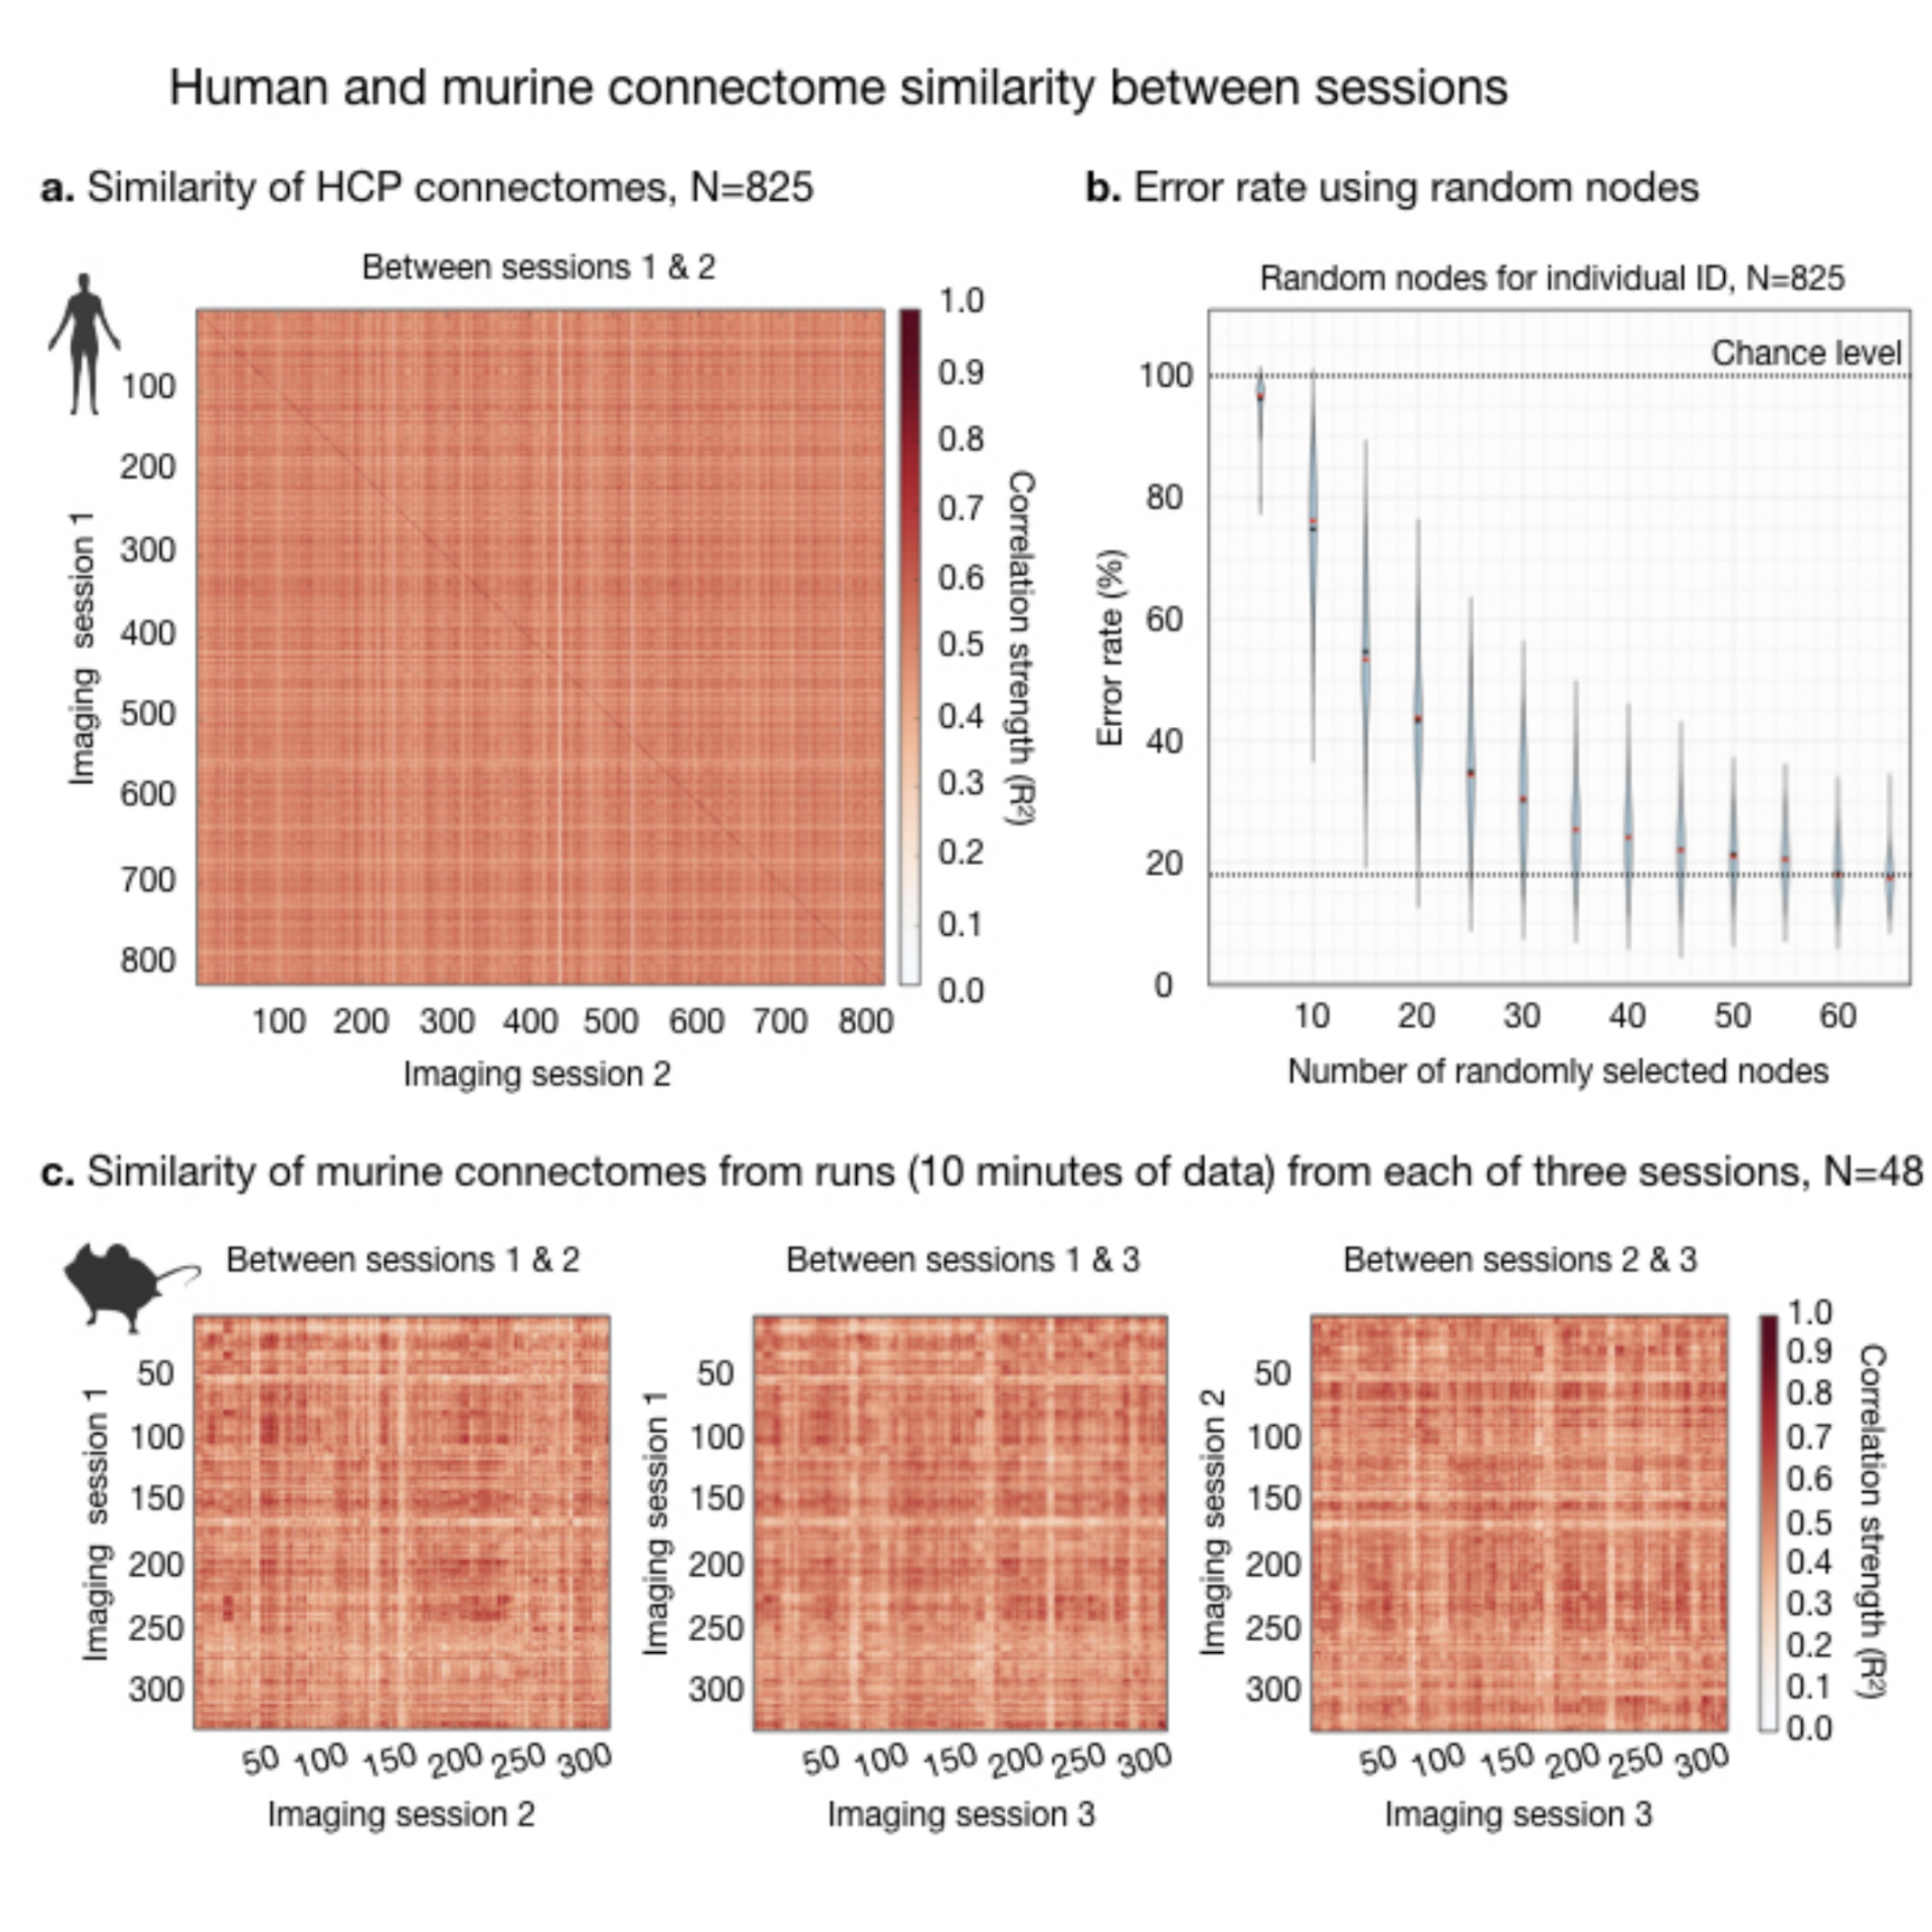
Fig. 2. Human and murine connectome similarity between sessions.
The connectome, using Shen-268, is computed for individuals with two resting-state sessions. Connectome similarity between sessions is computed for all pairs of individuals (a). If the highest correlation value in each row corresponds to the same individual, the ID is correct. Human ID rates are high (dark diagonal). We consider how much data is needed to make an ID (b) by randomly selecting subsets of nodes and repeating the ID calculation (100 iterations). Connectome similarities are plotted for murine data (c).
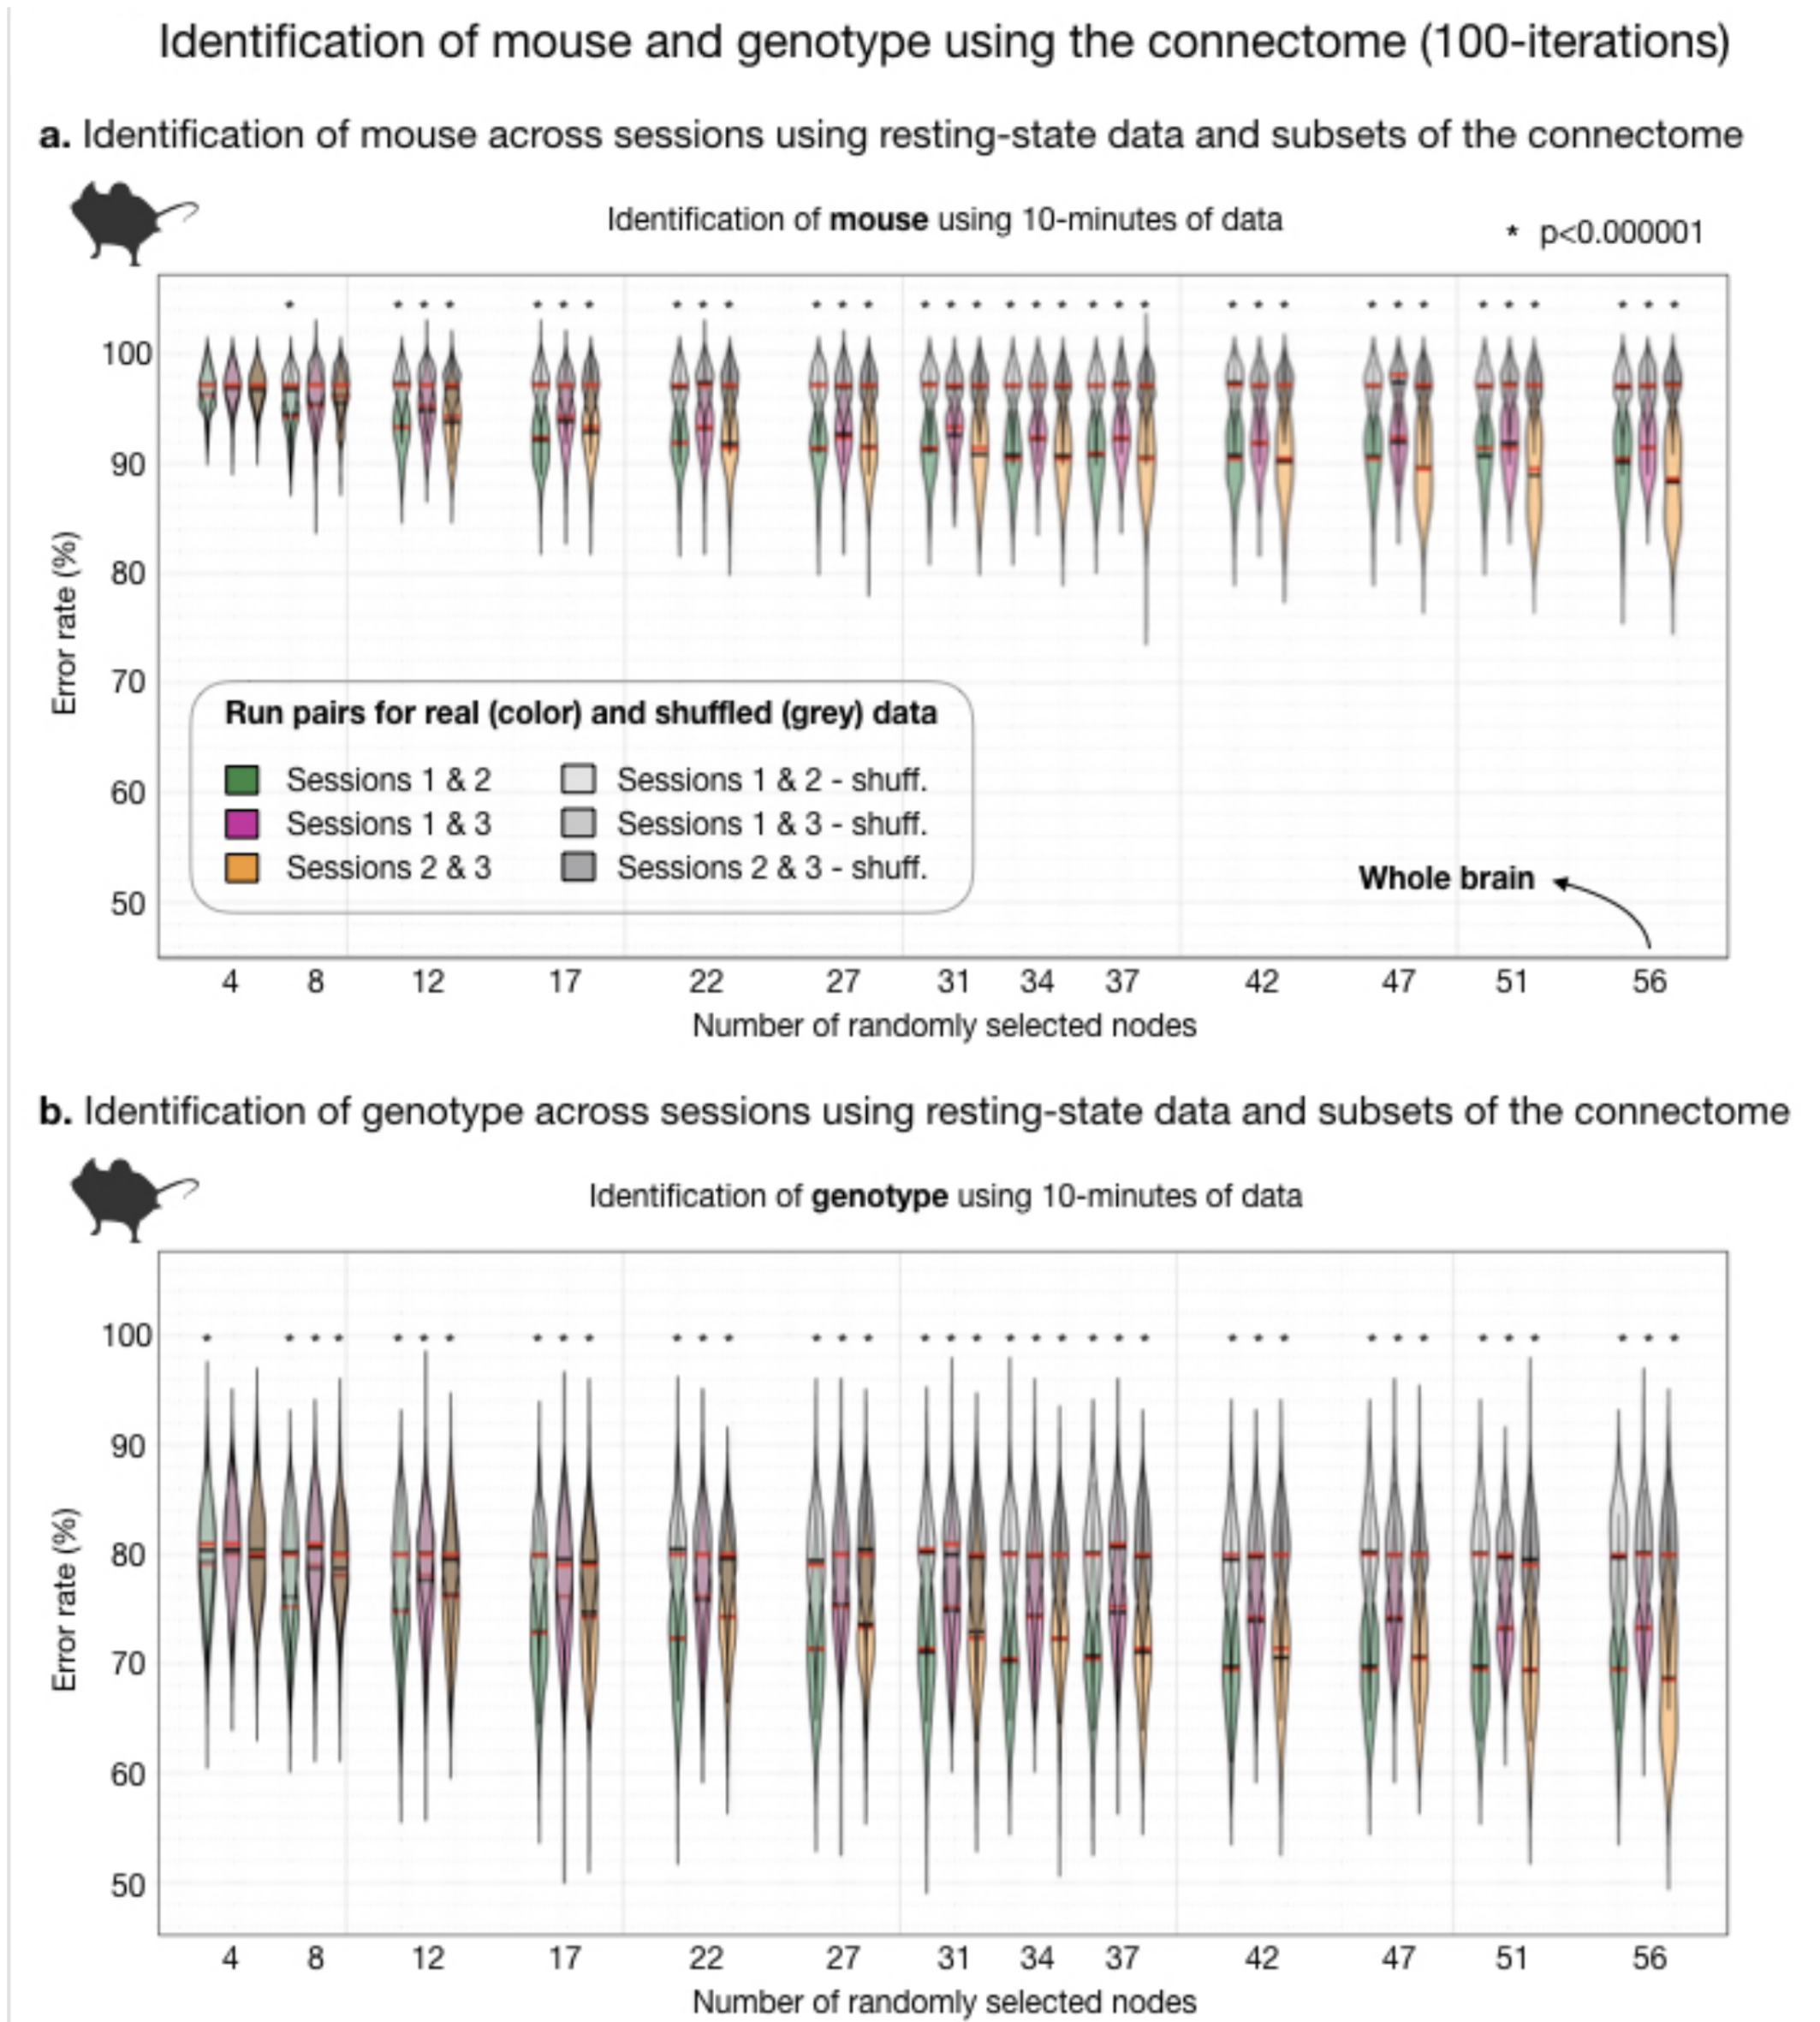
Fig. 3. Identification of mouse and genotype using the connectome (100-iterations).
Akin to Fig. 2b. where human data are plotted, here we plot murine ID results. For randomly selected nodes, inter-session mouse (a) and genotype (b) ID rates are plotted. Using 10-minutes or resting-state data, ID of mouse or genotype (where correct mouse is held out), are above chance (computed by shuffling mouse or genotype label and connectome data). For small fractions of the connectome (8-10 random nodes), mouse and genotype ID rates are above chance. Yet, never reach high rates (as in humans).
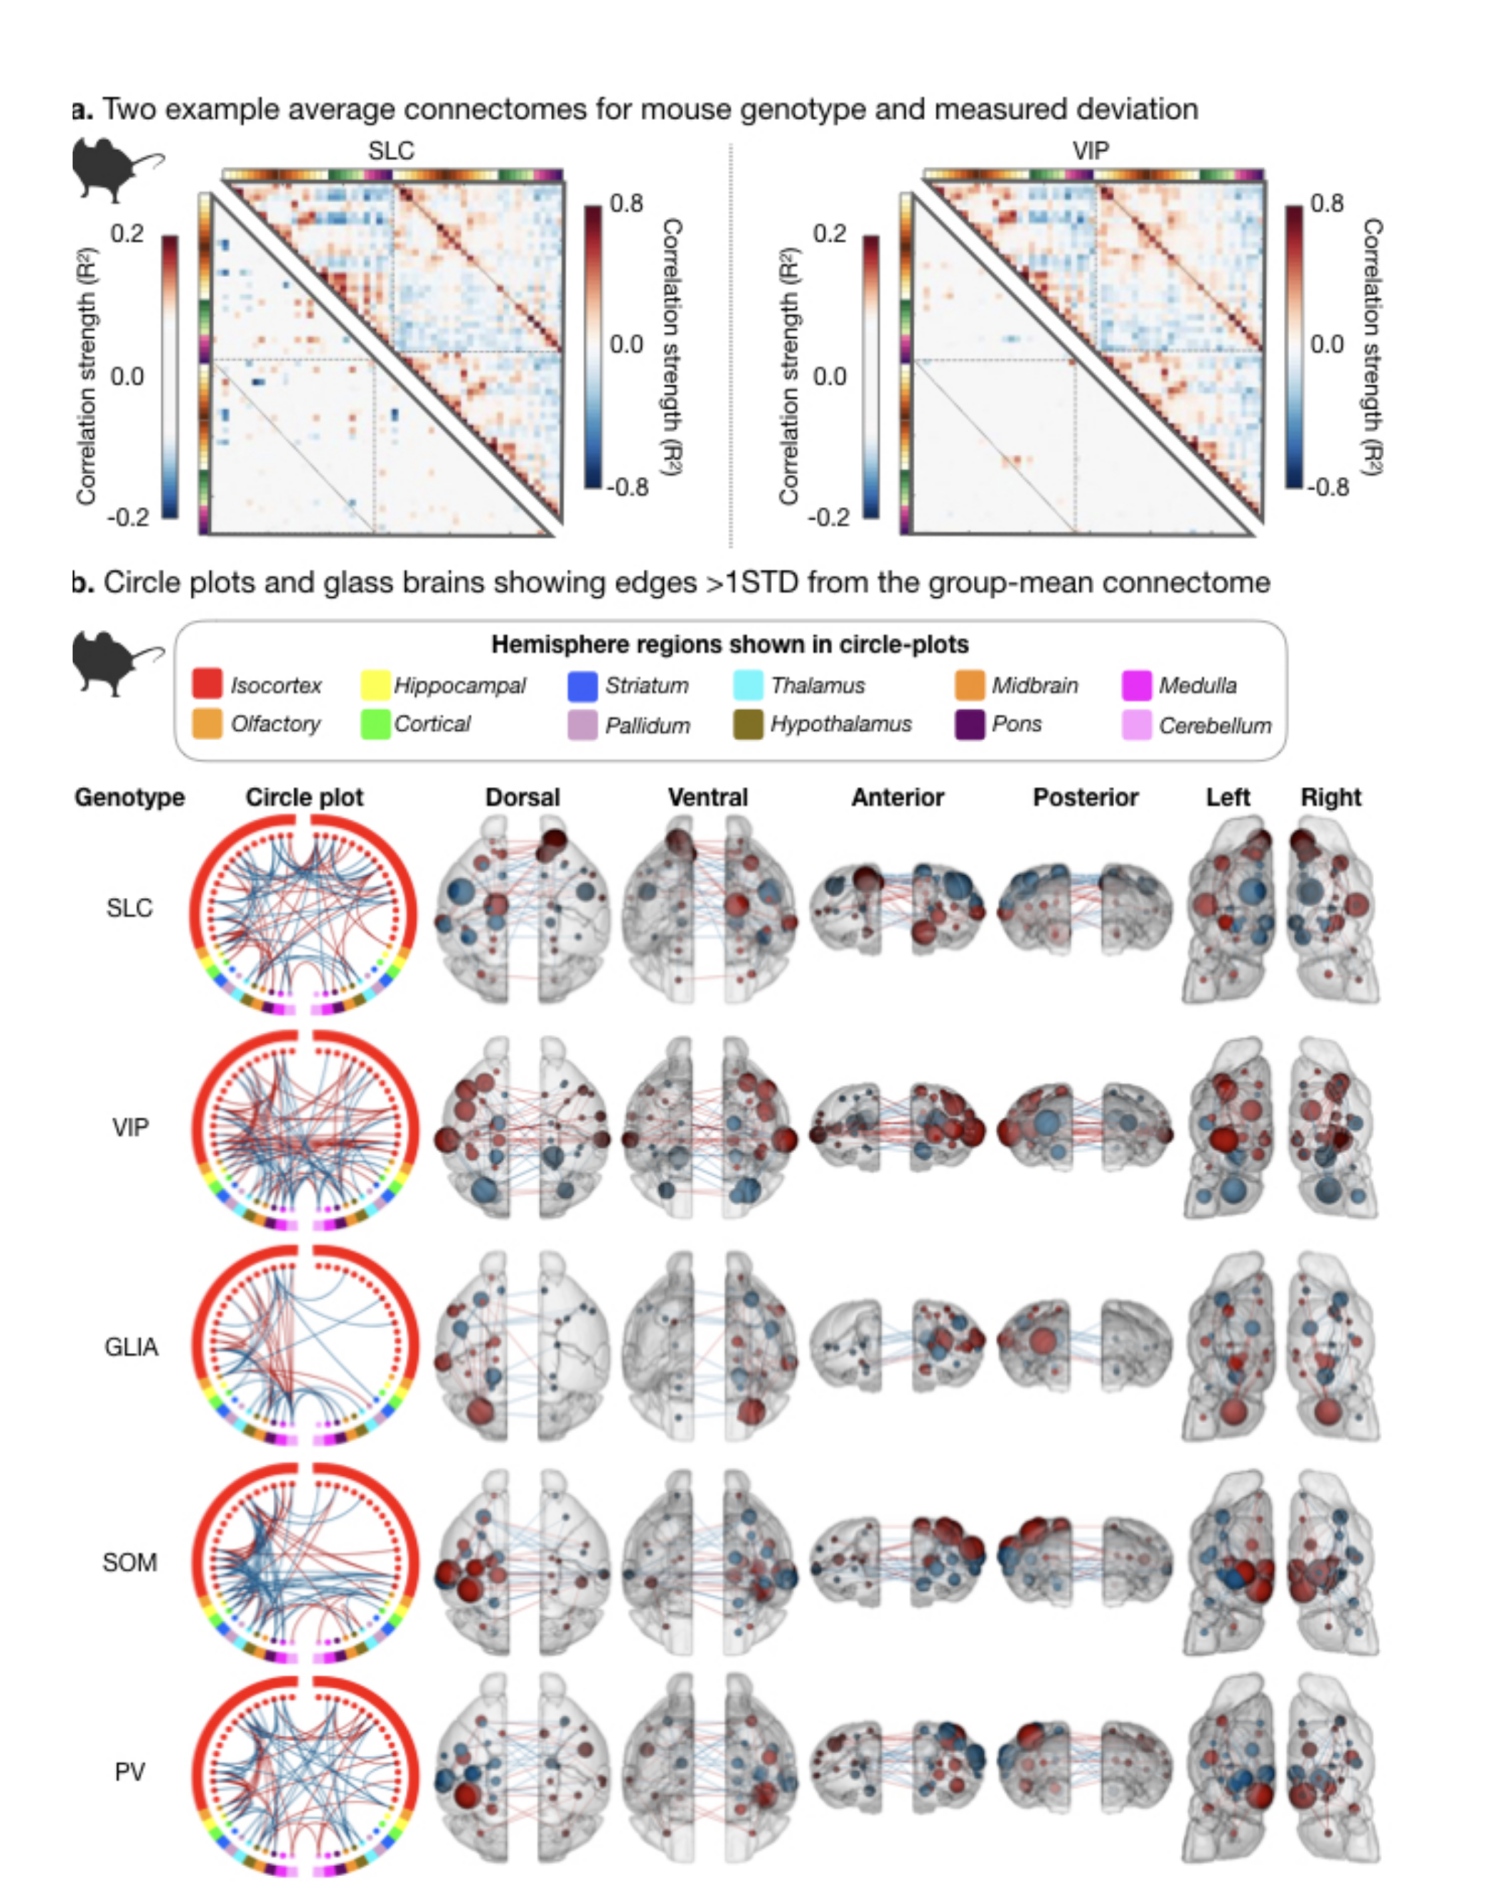
Fig. 4. Differences in the murine connectome for two example genotypes.
We show which connections distinguish each genotype from the average (all genotypes); example of genotype-specific connectome (matrix – upper half) and difference (matrix – lower half) for SLC (left) and VIP (right) (a). Circle and glass-brain anatomy plots for connections >1STD from the average in each genotype reveal genotype-specific connectomes. Edges and nodes that show greater strength are indicated in red, those with diminished strength are shown in blue.
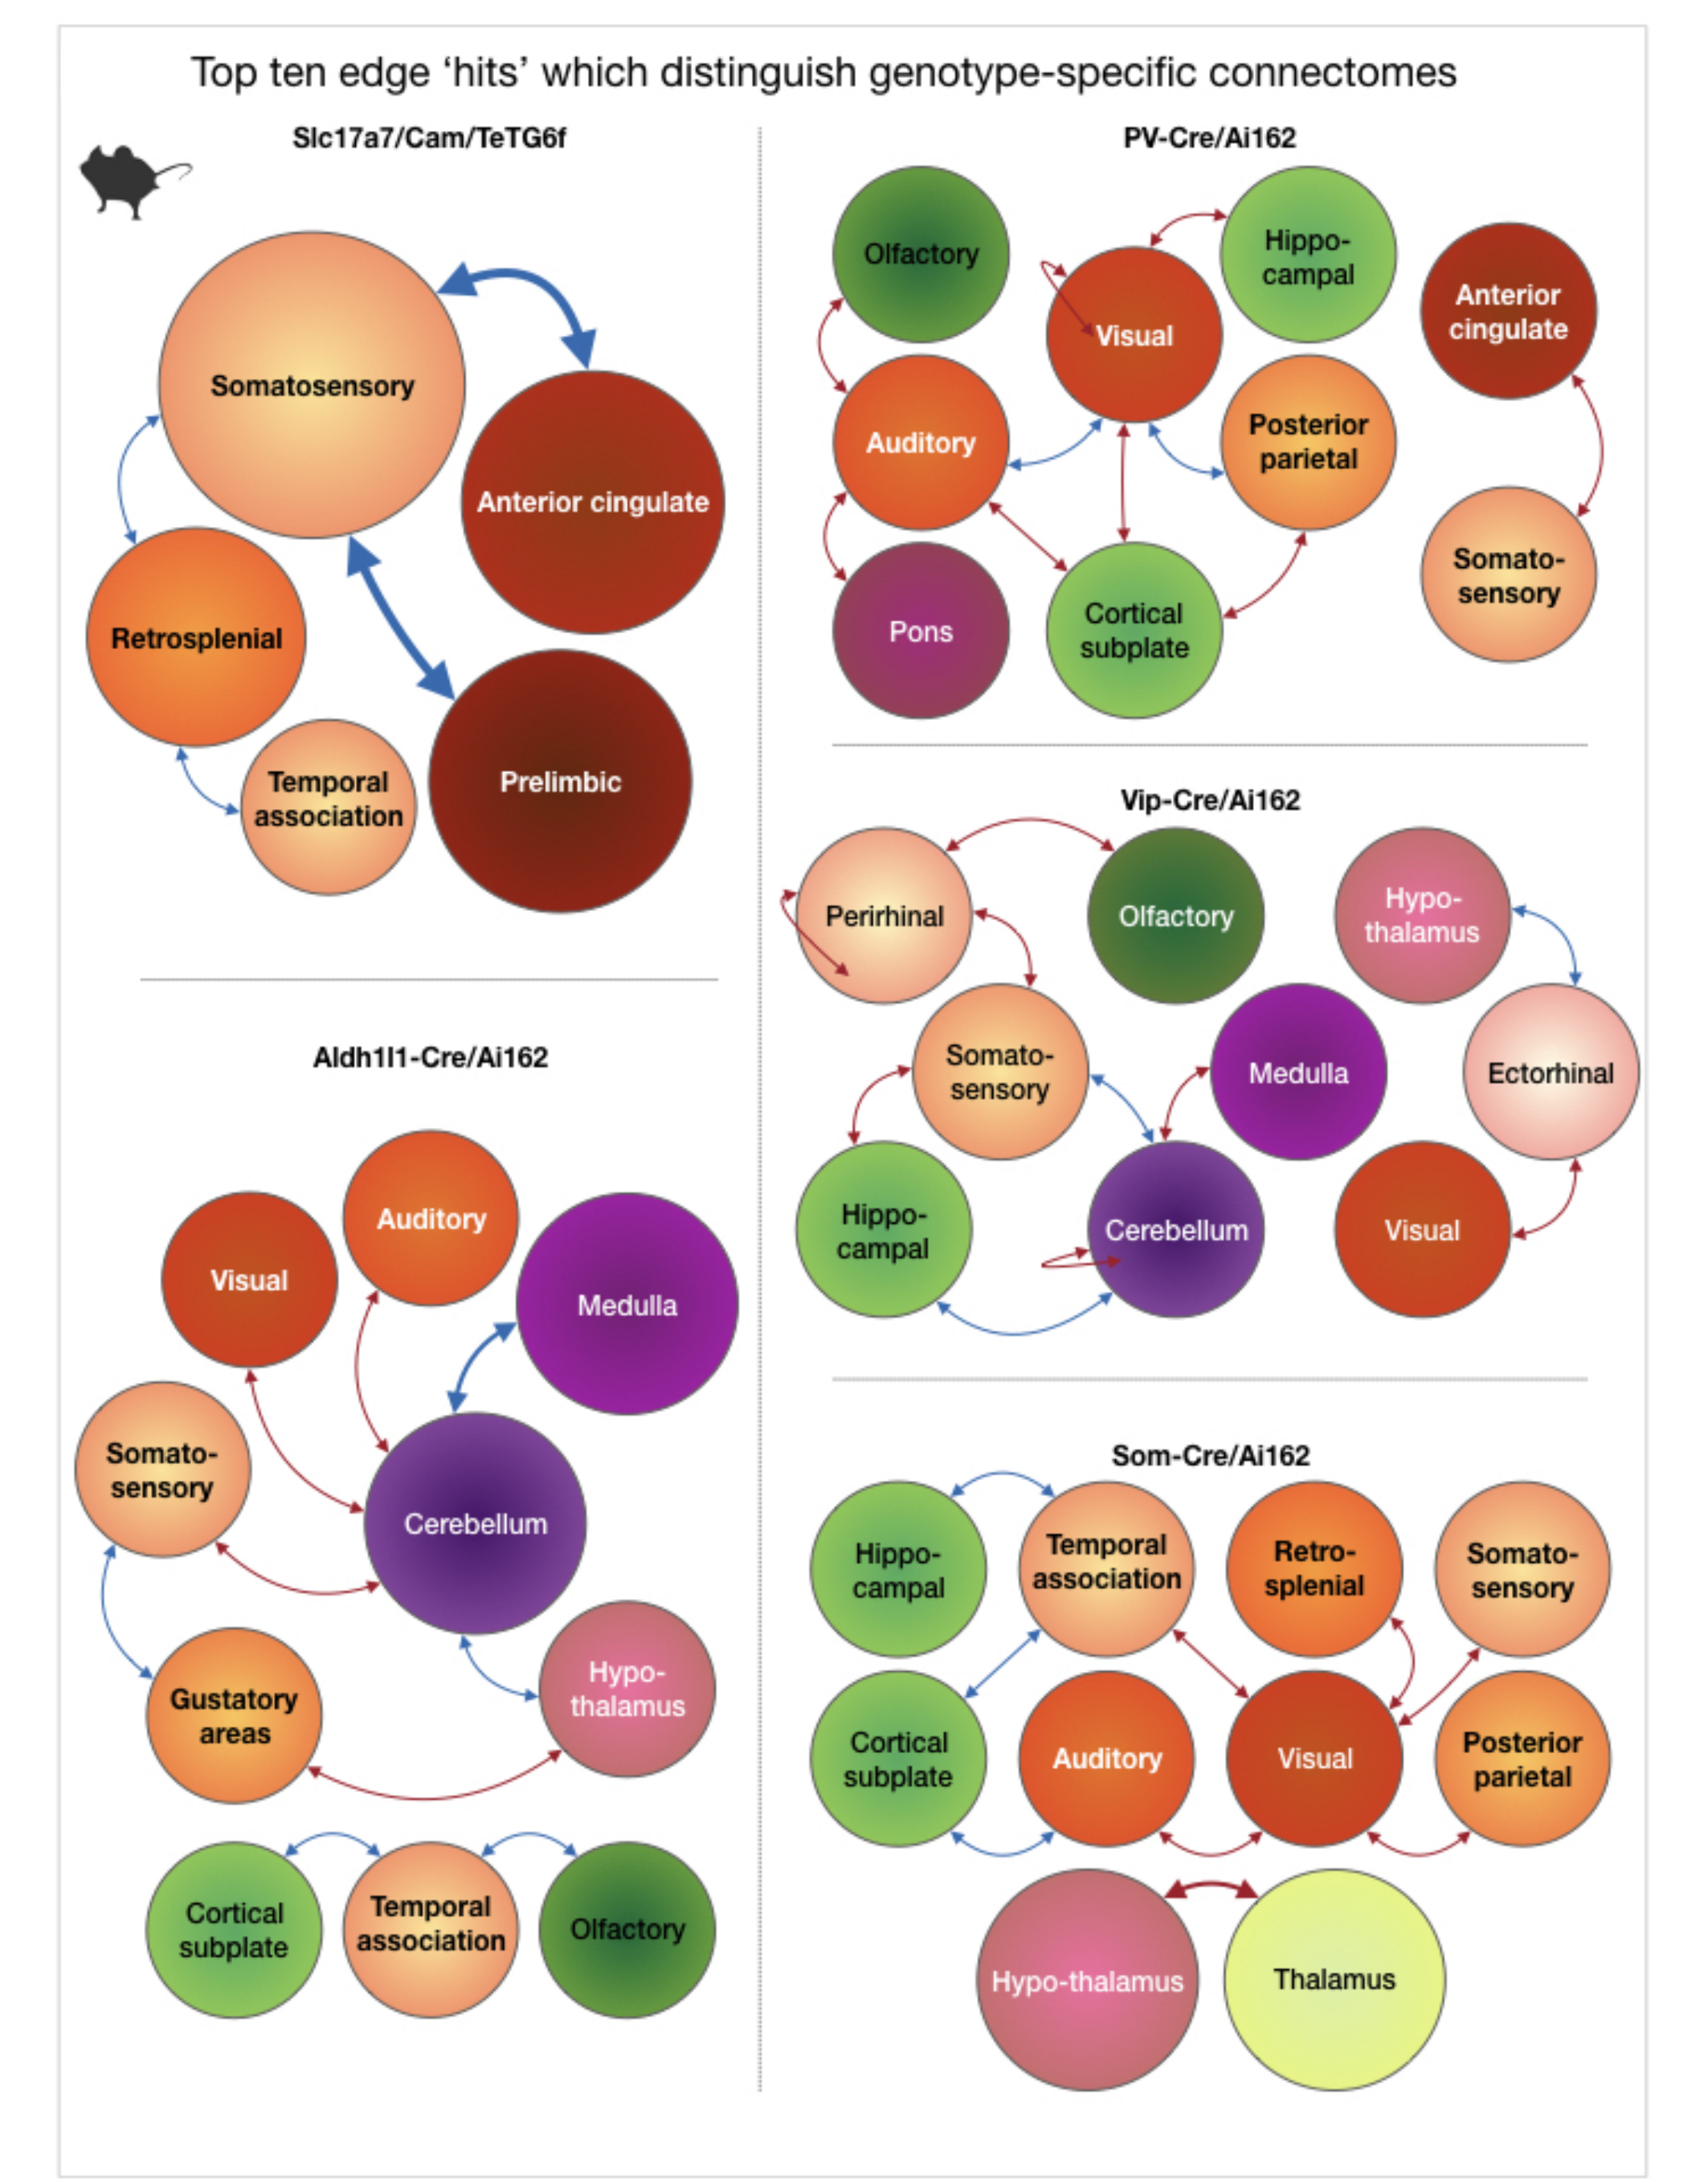
Fig. 5. Top ten edge ‘hits’ which distinguish genotype-specific connectomes.
Five circuits, one for each genotype-group, are shown. Each circuit is comprised of edges showing the largest difference between each genotype-specific connectome and the whole-group average connectome. Orbs, denoting brain regions, are color-coded to match Fig. 1c. – cortical areas in orange, subcortical areas in pink and green. Arrows are red for edges that show greater strength and blue for diminished strength. Orb and arrow size are proportional to the number of edges they represent.