0413
Mapping the time course of cortical reorganization and the influence of visual experience during plasticity.1Preclinical MRI Laboratory, Champalimaud Foundation, Lisbon, Portugal, 2Preclinical MRI Laroratory, Champalimaud Centre for the Unknown, Lisbon, Portugal, 3Champalimaud Centre for the Unknown, Lisbon, Portugal
Synopsis
During development, the organization of the brain’s underlying circuitry is shaped by sensory experience. However, how the adult brain reorganizes remains much less understood. Here, we performed a longitudinal BOLD-fMRI study assessing plasticity in the adult rat brain using a chronic visual deprivation model and a novel set-up for mapping detailed visual responses. We show that dark rearing (DR) boosts neural responses to visual stimuli but delays retinotopic and spatial frequency (SF) specialization in the visual pathway. Our findings suggest that DR shifts the stability/plasticity balance and that fMRI can map dynamic processes in the visual system.
Introduction
Unravelling the organization and the functional specialization of neural networks is fundamental to understanding how the adult brain adapts its function and structure. In the visual system, deprivation of stimulus from birth entails an absence of the critical period for plasticity, thereby delaying the normal specialization and development of the pathway1. It remains unclear how the adult brain reorganises upon being exposed to light, especially from a brain-wide perspective.High-field preclinical MRI can map brain-wide plasticity2,3. However, understanding brain reorganisation in the visual system requires the delivery of complex visual stimuli and advanced computational models to measure detailed receptive fields (RFs) and spatial frequency (SF) tuning curves4-6. Here, using a unique set-up for delivery of complex stimuli in rodents in the scanner, we mapped rat RFs and SF tuning curves with high resolution, and investigated how they modulate over time. Our results suggest a shift in the critical period upon light exposure.
Methods
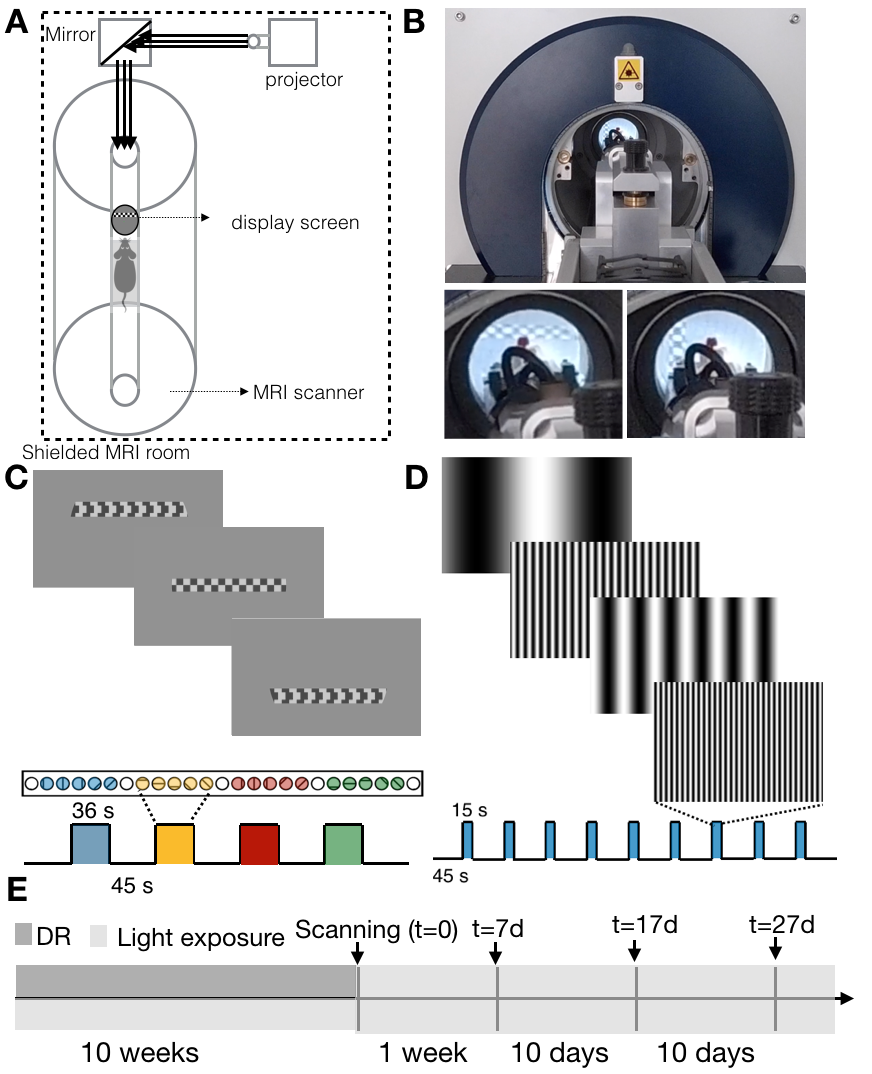
All experiments were preapproved by the competent institutional and national authorities and were carried out in accordance with European Directive 2010/63.Dark rearing: The experiment timeline is shown in Figure.1E. N=12 Adult Long Evan rats (10 Females) were divided into two groups: healthy controls (HC,N=6) and dark reared (DR,N=6). The DR animals were born and kept in the dark until 10 weeks of age. They were first exposed to light during the first MRI scan (t=0). Thereafter, the DR animals were housed in a normal environment with 12h light/12h dark cycle. Follow-up scans took place 7, 17 and 27 days after t=0. HC rats were scanned following the same protocol but were born and kept in the normal environment with 12h light/12h dark cycle from birth.
Animal preparation and MRI experiments: Rats were sedated using medetomidine (0.05mg/kg bolus; 0.1mg/kg/h infusion). Temperature and respiration rate were continuously monitored and remained stable throughout the sessions. MRI experiments were performed on a 9.4T BioSpec scanner (Bruker) equipped with an 86mm quadrature resonator for transmittance and a 20mm loop surface coil for reception.
Visual stimulus delivery set-up and paradigm: A tailored set-up for delivering complex stimuli in the scanner was used (Figure.1A,B). Retinotopic organization and SF tuning along the visual pathway were obtained using two different stimuli: a luminance contrast-inverting checkerboard drifting bar (Figure.1C) and full field moving gratings of 10 different SFs varying between 0.003 and 0.5 cycles per degree (cpd, Figure.1D), respectively. Each retinotopic run was repeated 6 times and each SF tuning run was repeated twice per animal.
fMRI experiments: Multislice GE-EPI acquisition parameters included: TE/TR=16.7/1500ms, FOV=20.5x15mm2, resolution=125x125μm2, slice thickness=0.650mm).
Data analysis and receptive field estimation: Images were slice-timing and motion corrected, coregistered and normalized to an atlas and spatially smoothed (FWHM=0.15mm2) using a home-written Python pipeline. Regions of interest (ROIs) were defined according to the SIGMA atlas7. The voxels' time-series were drift corrected and slightly temporally smoothed (Savitzky-Golay filter,span=5,window=3). The average cycle was calculated by averaging all stimulation epochs. The population RF characterization was performed using micro-probing8 and population RF analysis9.
Results
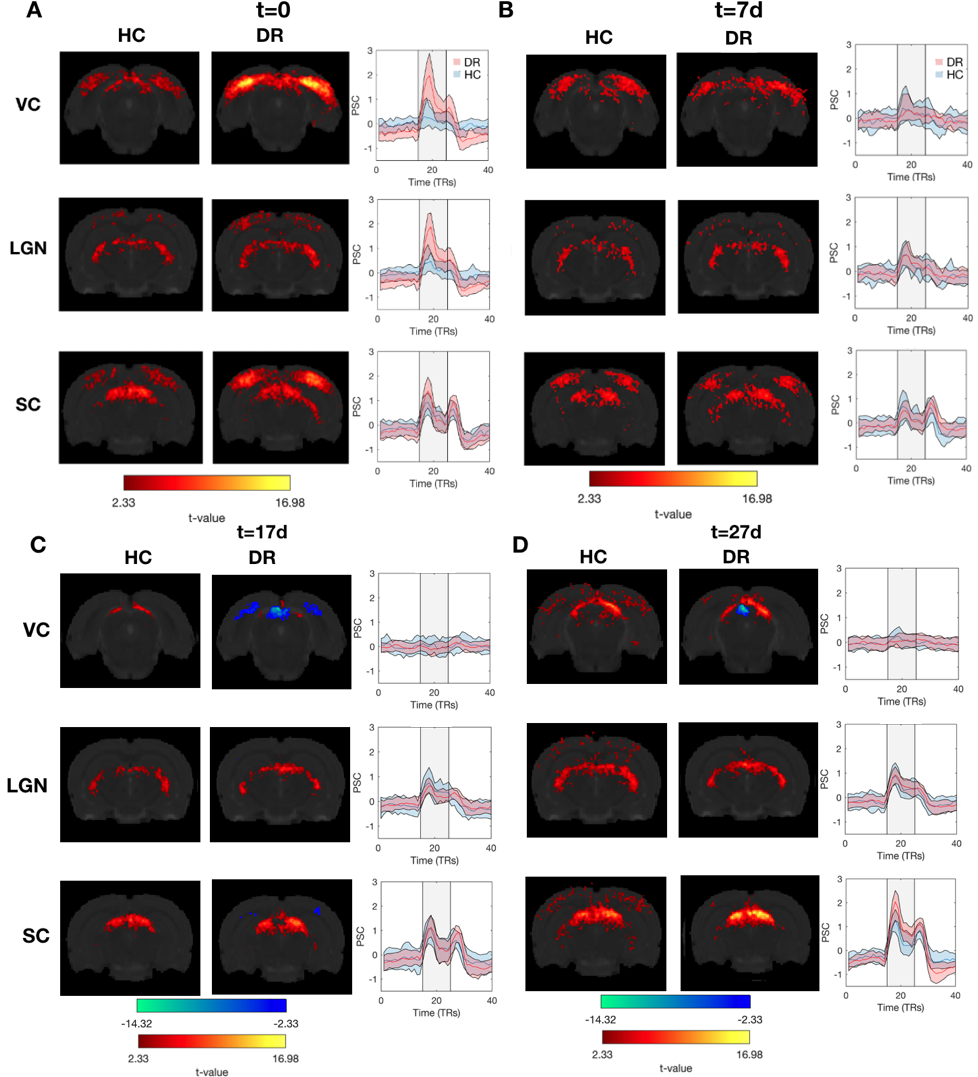
Figure.2 shows that both stimuli resulted in reliable and robust BOLD activation throughout the entire visual pathway in HC. These activation patterns are consistent across scanning sessions (Figure.3).At t=0, when compared to HC, the DR group exhibited 3-fold and 2-fold increases in BOLD amplitudes in visual cortex (VC) and lateral geniculate nucleus (LGN), respectively (Figure.3A). Interestingly, one week after light exposure, the BOLD responses in the DR group became similar to HC BOLD responses (Figure.3B,C and D). This effect is visible using both stimuli, SF tuning and retinotopy.
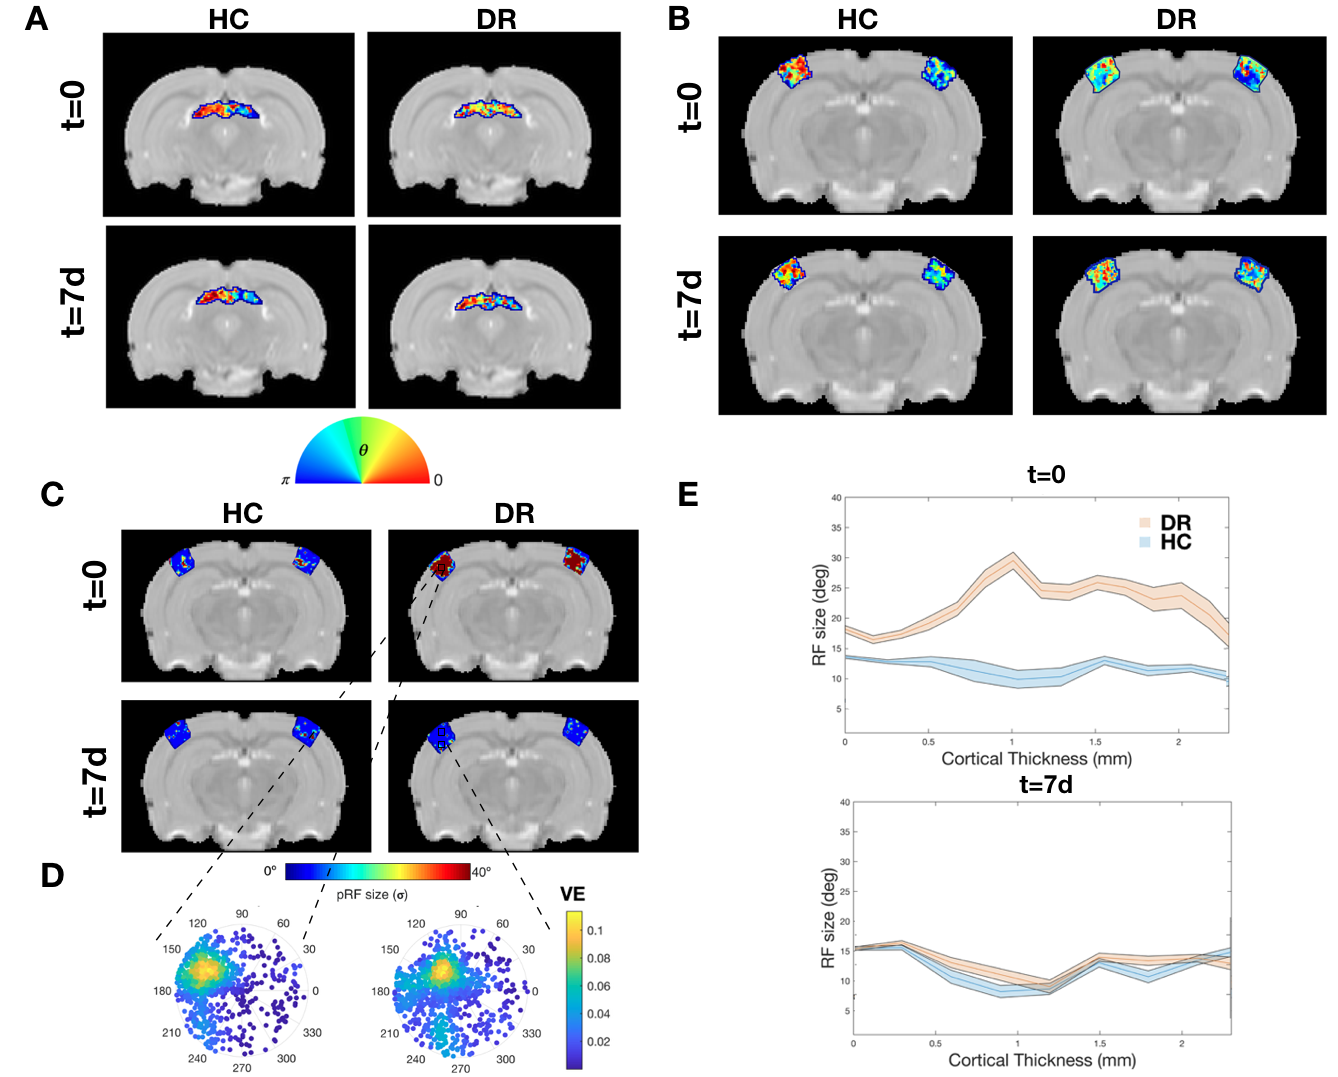
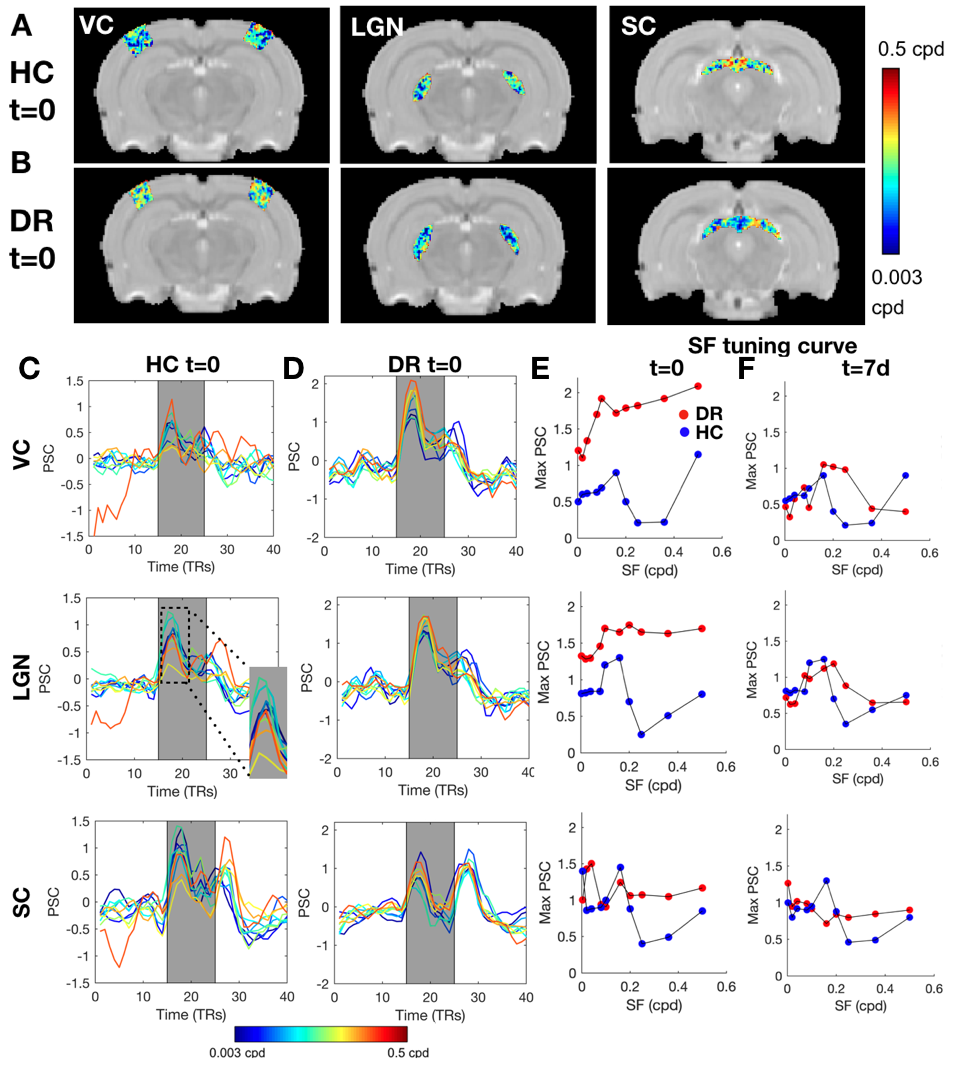
To further investigate the specialization of the pathway, RF and SF mapping was performed. At t=0, the DR RFs are much larger than those of HC and the DR's visual pathway lacks retinotopic organization (Figure.4). After light exposure, the visual pathway progressively becomes retinotopically organized, as evident from the polar angle gradient from 0 to π (Figure.4A and B) and the decrease in RF sizes. In the VC, RF sizes were reduced to HC levels already at t=7d in all layers (Figure.4C,D and E). Similar observations were made for SF specificity: DR animals show broad tuning curves without a specific optimal SF compared to HC at t=0, which normalized at later time points (Figure.E and F).
Discussion
Using this unique set-up for delivery of complex stimuli in the scanner, our findings shed light into plasticity in the adult brain. We have shown that the adult rat brain is highly plastic and that the absence of a critical period in DR rats delays the maturation of the visual system. Our results agree with previous electrophysiology and calcium studies which locally showed that, in DR adult animals, the RF sizes of visual cortical neurons remain large10-12. Furthermore, light exposure clearly promoted the specialization of the visual system. This unique view of the whole pathway is promising for future characterisations of plasticity in health and disease.Conclusion
This study illustrates how high-resolution MRI, in combination with complex visual stimulation, can bridge the spatiotemporal scales necessary for repeatedly interrogating structural and functional changes underlying plasticity and investigate how the stability/plasticity balance is sculpted by visual experience.Acknowledgements
This study was supported by funding from the European Research Council (ERC) under the European Union’s Horizon 2020 research and innovation programme (Starting Grant, agreement No. 679058) and by the European Union’s Horizon 2020 research and innovation programme under the Marie Sklodowska-Curie grant agreement No 101032056 (PlastiMap).References
1. Gianfranceschi, L. et al. Visual cortex is rescued from the effects of dark rearing by overexpression of BDNF. Proc. Natl. Acad. Sci. U. S. A. 100, 12486–12491 (2003).
2. Dijkhuizen, R. M. et al. Status of the neonatal rat brain after NMDA-induced excitotoxic injury as measured by MRI, MRS and metabolic imaging. NMR Biomed. 9, 84–92 (1996).
3. Hoehn, M., Nicolay, K., Franke, C. & van der Sanden, B. Application of magnetic resonance to animal models of cerebral ischemia. Journal of Magnetic Resonance Imaging vol. 14 491–509 (2001).
4. Wandell, B. A. & Smirnakis, S. M. Plasticity and stability of visual field maps in adult primary visual cortex. Nat. Rev. Neurosci. 10, 873–884 (2009).
5. Vreysen, S., Zhang, B., Chino, Y. M., Arckens, L. & Van den Bergh, G. Dynamics of spatial frequency tuning in mouse visual cortex. J. Neurophysiol. 107, 2937–2949 (2012).
6. Henriksson, L., Nurminen, L., Hyvärinen, A. & Vanni, S. Spatial frequency tuning in human retinotopic visual areas. J. Vis. 8, 5.1–13 (2008).
7. Barrière, D. A. et al. The SIGMA rat brain templates and atlases for multimodal MRI data analysis and visualization. Nat. Commun. 10, 5699 (2019).
8. Carvalho, J. et al. Micro-probing enables fine-grained mapping of neuronal populations using fMRI. Neuroimage 209, 116423 (2020).
9. Dumoulin, S. O. & Wandell, B. A. Population receptive field estimates in human visual cortex. NeuroImage vol. 39 647–660 (2008).
10. Fagiolini, M., Pizzorusso, T., Berardi, N., Domenici, L. & Maffei, L. Functional postnatal development of the rat primary visual cortex and the role of visual experience: dark rearing and monocular deprivation. Vision Res. 34, 709–720 (1994).
11. Regal, D. M., Boothe, R., Teller, D. Y. & Sackett, G. P. Visual acuity and visual responsiveness in dark-reared monkeys (Macaca nemestrina). Vision Res. 16, 523–530 (1976).
12. Teller, D. Y., Regal, D. M., Videen, T. O. & Pulos, E. Development of visual acuity in infant monkeys (Macaca nemestrina) during the early postnatal weeks. Vision Res. 18, 561–566 (1978).
Figures