0412
Effects of Aging and Muscle Degeneration on Metabolic Response to High-Intensity Muscle Contraction in Mice by Phosphorus-31 MRS
Kihwan Kim1, Yuran Zhu2, Yudu Li3, Zhi-Pei Liang 3,4, and Xin Yu2,5
1Biomedical Engineering, Case Western Reserve University, Cleveland, OH, United States, 2Biomedical Engineering, Case Western Reserve University, cleveland, OH, United States, 3Electrical and Computer Engineering, University of Illinois at Urbana-Champaign, Urbana, IL, United States, 4Beckman Institute for advanced Science and Technology, University of Illinois at Urbana-Champaign, Urbana, IL, United States, 5Case Center for Imaging Research, Case Western Reserve University, cleveland, OH, United States
1Biomedical Engineering, Case Western Reserve University, Cleveland, OH, United States, 2Biomedical Engineering, Case Western Reserve University, cleveland, OH, United States, 3Electrical and Computer Engineering, University of Illinois at Urbana-Champaign, Urbana, IL, United States, 4Beckman Institute for advanced Science and Technology, University of Illinois at Urbana-Champaign, Urbana, IL, United States, 5Case Center for Imaging Research, Case Western Reserve University, cleveland, OH, United States
Synopsis
In this study, 31P-MRS was employed to evaluate the effects of aging and muscle degeneration on metabolic response to stimulation-induced, high-intensity muscle contraction in two age groups of C57BL/6 and mdx mice, a mouse model of moderate muscular dystrophy. Significant, age-dependent differences in mitochondrial oxidative capacity and creatine kinase activity after muscle stimulation were observed between C57BL/6 and mdx mice, suggesting a positive metabolic response to muscle contraction that can be modulated by aging and muscle degeneration.
Introduction:
Skeletal muscle is the major site of insulin-mediated postprandial glucose uptake. Regular exercise training has the beneficial effects of enhancing skeletal muscle insulin sensitivity via mitochondrial biogenesis and improved mitochondrial function.1 However, large inter-subject variations in response to exercise training were also reported.2 and the mechanisms and predictors of exercise responses are poorly understood.31P-MRS provides quantitative measures of mitochondrial function in vivo. It enables repeated measurements such that the response to an acute event (e.g., exercise) or long-term interventions (e.g., physical training) can be evaluated. In this study, we evaluated the acute metabolic response to stimulation-induced muscle contraction in C57BL/6 and mdx mice, a mouse model of moderate muscular dystrophy. Our results revealed a positive metabolic response to high-intensity muscle contraction that can be modulated by aging and muscle degeneration.
Methods:
Experimental protocol: C57BL/6 and mdx mice were characterized at 10-12 weeks (young, n = 8) and 20-22 weeks (adult, n = 14) of age. 31P-MRS studies were performed on a 9.4T preclinical scanner. All mice were anesthetized with 1-1.5% isoflurane and placed in a lateral position. Two needle electrodes were inserted subcutaneously along the distal nerve. Muscle contraction was induced by applying electric stimulation for 4 min. Two rounds of electrical stimulation were applied, with a 35 to 40-min interval between the two rounds.Mitochondrial oxidative capacity: Mitochondrial oxidative capacity was quantified by dynamic 31P-MRS. Nonlocalized 31P spectra were acquired continuously before (5 min), during (4 min), and after (16 min) muscle stimulation using 30° RF pulses and 500-ms repetition time. The rate constant of phosphocreatine (PCr) recovery, an index of mitochondrial oxidative capacity, was quantified by fitting the PCr recovery profile with an exponential model.
Creatine kinase (CK) activity: The pseudo first-order forward rate constant of CK was measured using 31P magnetic resonance spectroscopic fingerprinting (31P-MRSF).3,4 Three measurements were obtained at baseline and 16 min after each round of stimulation. For each measurement, 30 fingerprints were acquired in 10 min. The fingerprints were averaged and matched to a dictionary of simulated fingerprints to derive the CK rate constant.
Results:
Figure 1A shows a representative dynamic 31P-MRS dataset and the profile of PCr changes before, during and after muscle stimulation. Figure 1B demonstrates the representative time courses of PCr recovery in young C57BL/6 and mdx mice after the second round of stimulation. The group-averages of PCr recovery rate are shown in Figure 2A, and changes in PCr recovery between the second and the first round of stimulation of individual mice are shown in Figure 2B&2C. In both age groups, there was no significant difference in PCr recovery rate between the mdx and C57BL/6 mice after the first round of stimulation (Young: 0.93±0.28 vs 0.97±0.27 min-1; Adult: 0.99±0.25 vs 1.07±0.28 min-1). Compared to the first round, all young C57BL/6 mice showed a net increase in PCr recovery rate after the second round, suggesting a positive response. As a result, the mean PCr recovery rate after the second round increased significantly to 1.29±0.27 min-1 (p < 0.05). In contrast, adult C57BL/6 mice showed varied responses after the second round, leading to an attenuated increase in the mean PCr recovery rate (1.21±0.31 min-1). Both young and adult mdx mice showed no significant changes in PCr recovery rate after the second round.Shown in Figure 1C&1D are a representative 31P-MRSF dataset and the matching of the simulated fingerprints from C57BL/6 and mdx mice. The group-averages of the CK rate constant at baseline and after muscle stimulation are shown in Figure 3A&3C. At baseline, the CK rate constant was similar between the young mdx and C57BL/6 mice and was reduced in adult mdx mice (0.37±0.03 vs 0.41±0.04 s-1, p<0.05). All C57BL/6 mice showed an increase in CK rate constant in response to muscle stimulation (Figure 3B&3D). As a result, the mean CK rate constant after muscle stimulation increased significantly compared to the baseline (p<0.05). While 8 out of 9 young mdx mice showed a positive response to muscle stimulation, the magnitude was attenuated compared to C57BL/6 mice (p<0.05). Adult mdx mice showed more heterogeneous response to stimulation, leading to further attenuated increase in CK rate constant.
Discussion and conclusion:
In this study, we observed age-dependent changes in acute metabolic response to high-intensity muscle contraction in mdx and C57BL/6 mice. While young C57BL/6 mice showed a significant increase in PCr recovery rate, this increase was attenuated in adult C57BL/6 mice, and was completely blunted in mdx mice. Furthermore, while both C57BL/6 and mdx mice showed an increase in CK rate constant after stimulation, CK activity in mdx mice was lower than that in C57BL/6 mice. These changes suggest a positive metabolic response to muscle contraction that can be modulated by aging and muscle degeneration. While these observations reflect the acute responses of the skeletal muscle to a short bout of exercise, whether they are indicative of long-term adaptation to exercise training needs further investigation.Acknowledgements
This work was supported by a grant from the National Institute of Health (R01 EB23704).References
- Knowler WC, Barrett-Connor E, Fowler SE, Hamman RF, Lachin JM, Walker EA, Nathan DM, Diabetes Prevention Program Research Group. Reduction in the incidence of type 2 diabetes with lifestyle intervention or metformin. N Engl J Med. 2002;346:393–403.
- Bouchard C, An P, Rice T, Skinner JS, Wilmore JH, Gagnon J, Pérusse L, Leon AS, Rao DC. Familial aggregation of V̇O2max response to exercise training: Results from the HERITAGE family study. J Appl Physiol. 1999;87:1003–1008.
- Wang CY, Liu Y, Huang S, Griswold MA, Seiberlich N, Yu X. 31P magnetic resonance fingerprinting for rapid quantification of creatine kinase reaction rate in vivo. NMR Biomed. 2017;30:e3786.
- Kim K, Gu Y, Wang CY, Clifford B, Huang S, Liang Z, Yu X. Quantification of creatine kinase reaction rate in mouse hindlimb using phosphorus-31 magnetic resonance spectroscopic fingerprinting. NMR Biomed. 2021;34:e4435.
Figures
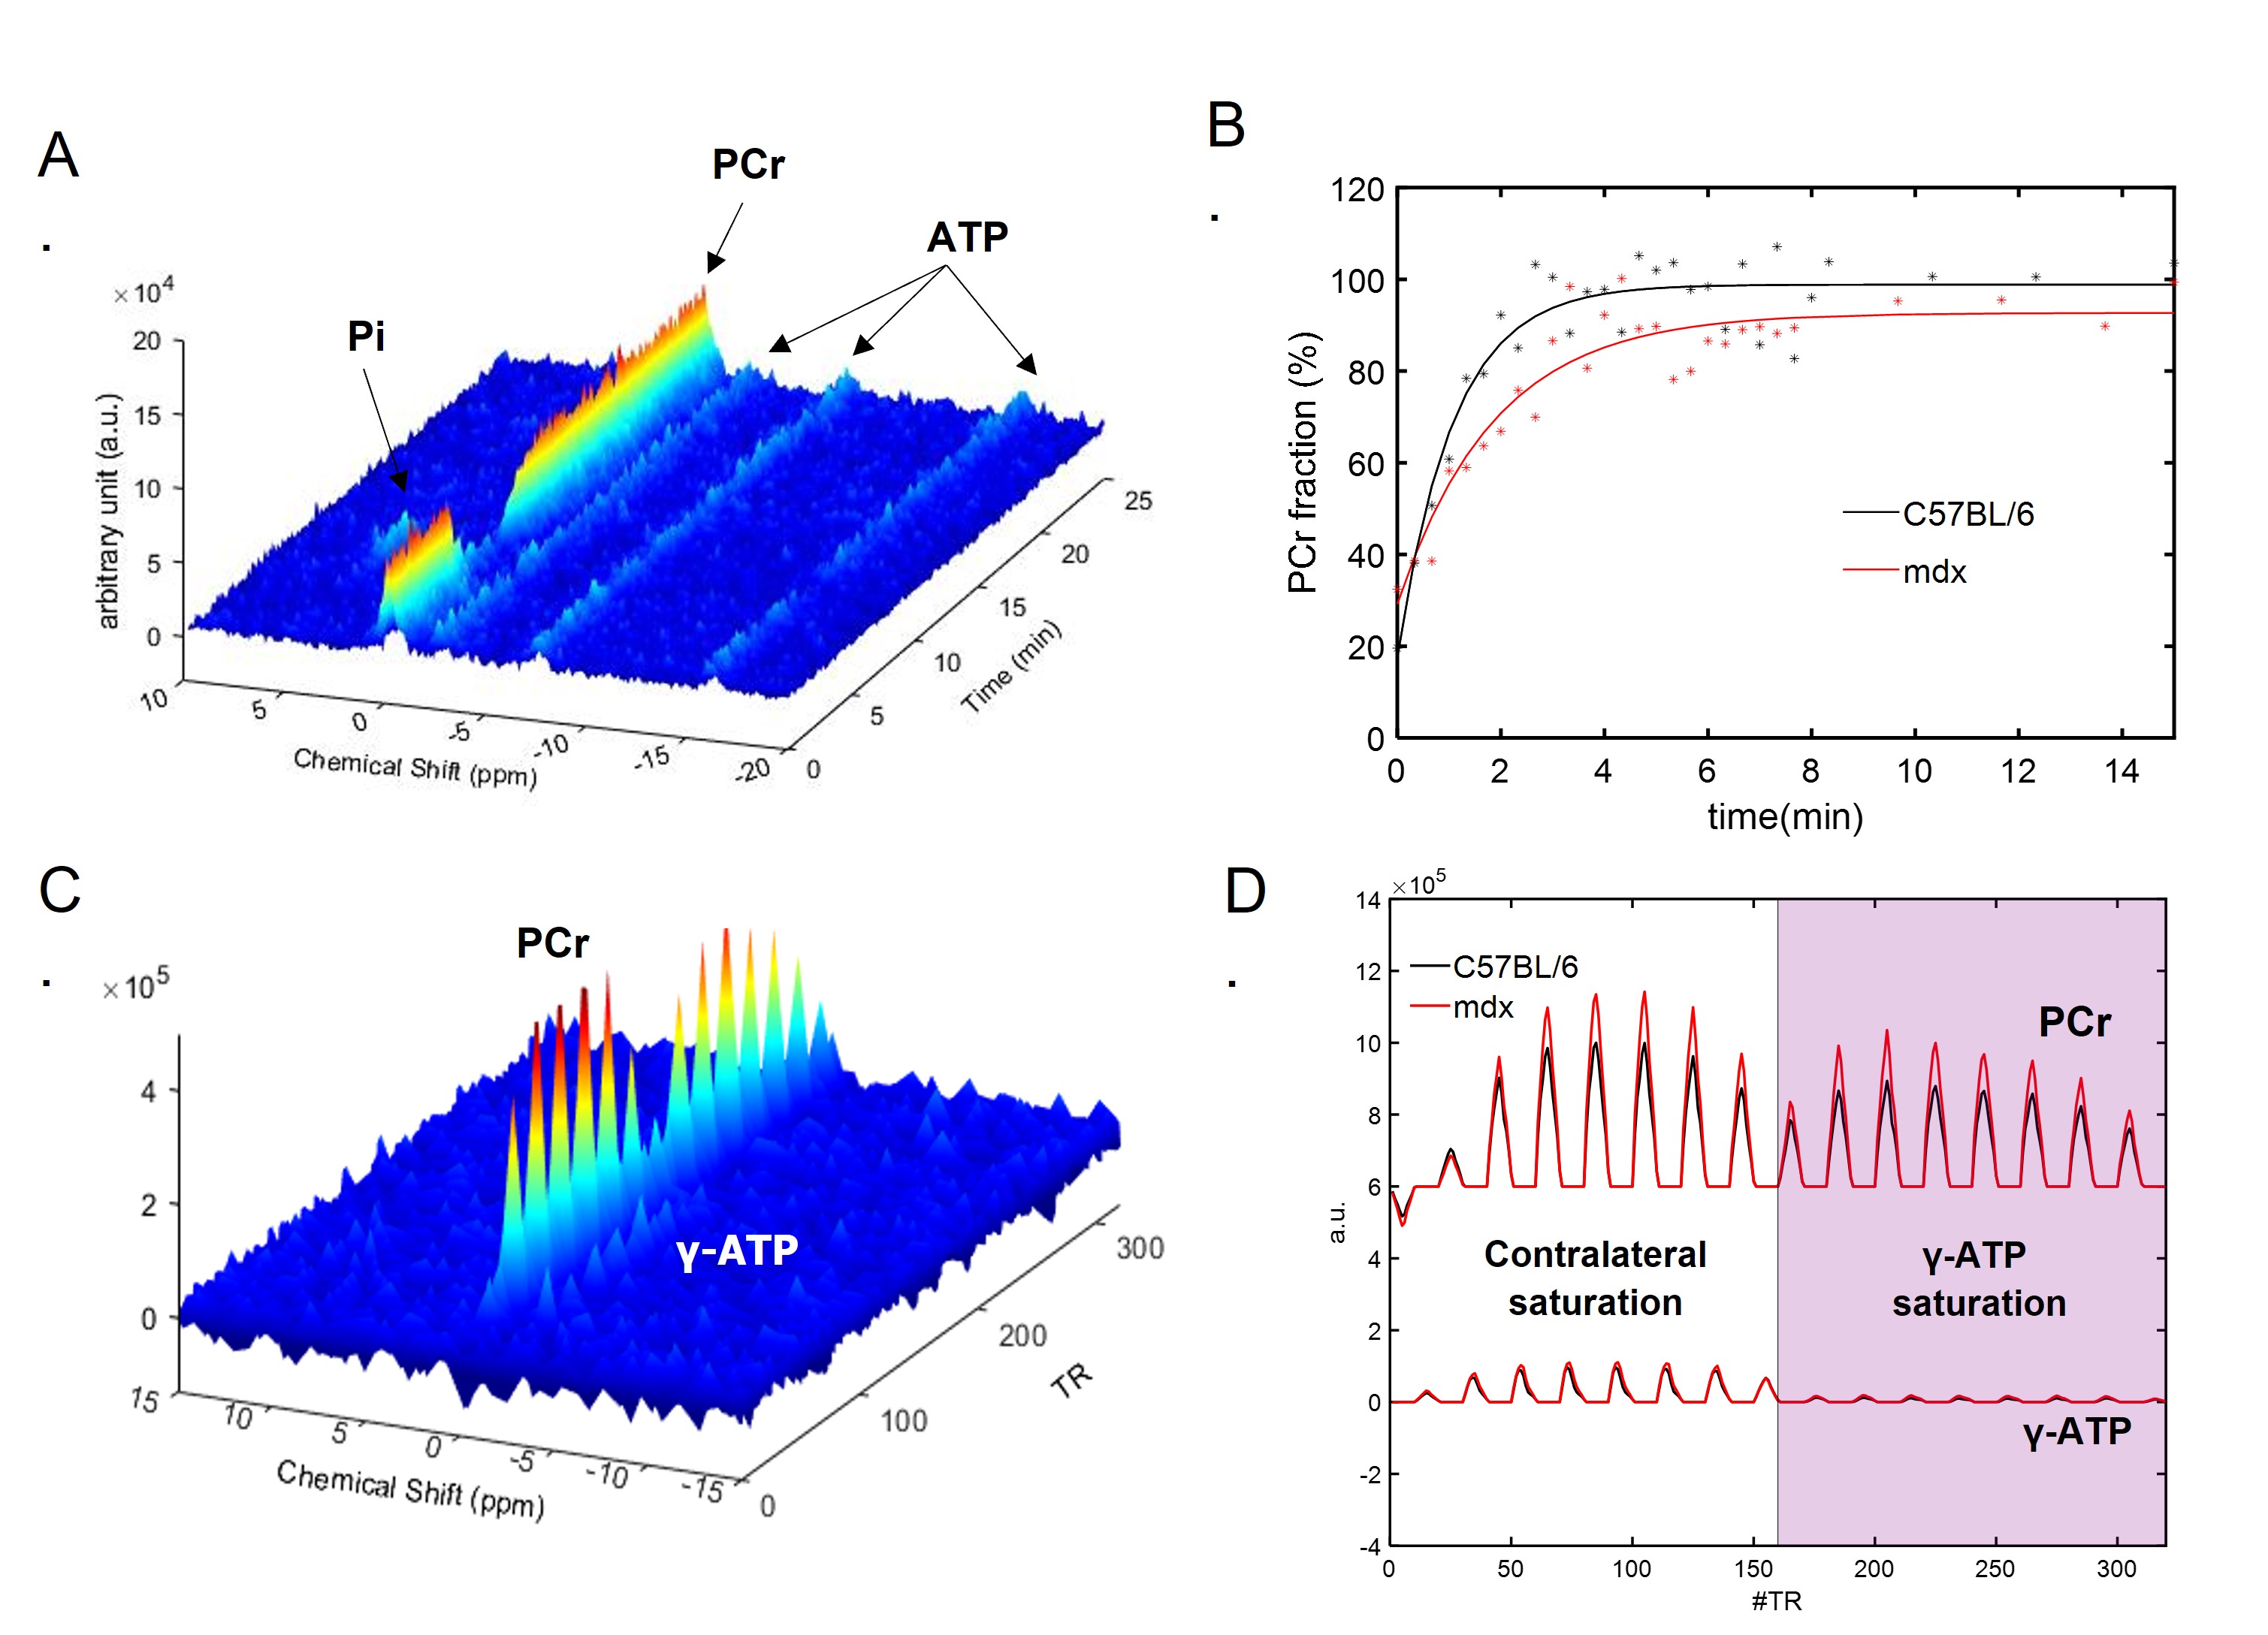
Figure 1. Dynamic 31P MRS and 31P-MRSF. A. Representative dynamic 31P-MRS from mouse skeletal muscle showing the metabolite profiles before, during and after stimulation. B. PCr recovery profiles and the monoexponential fitting in C57BL/6 and mdx mice. C. Representative 31P-MRSF fingerprint from mouse skeletal muscle. D. Comparison of matched 31P-MRSF fingerprints from C57BL/6 and mdx mice.
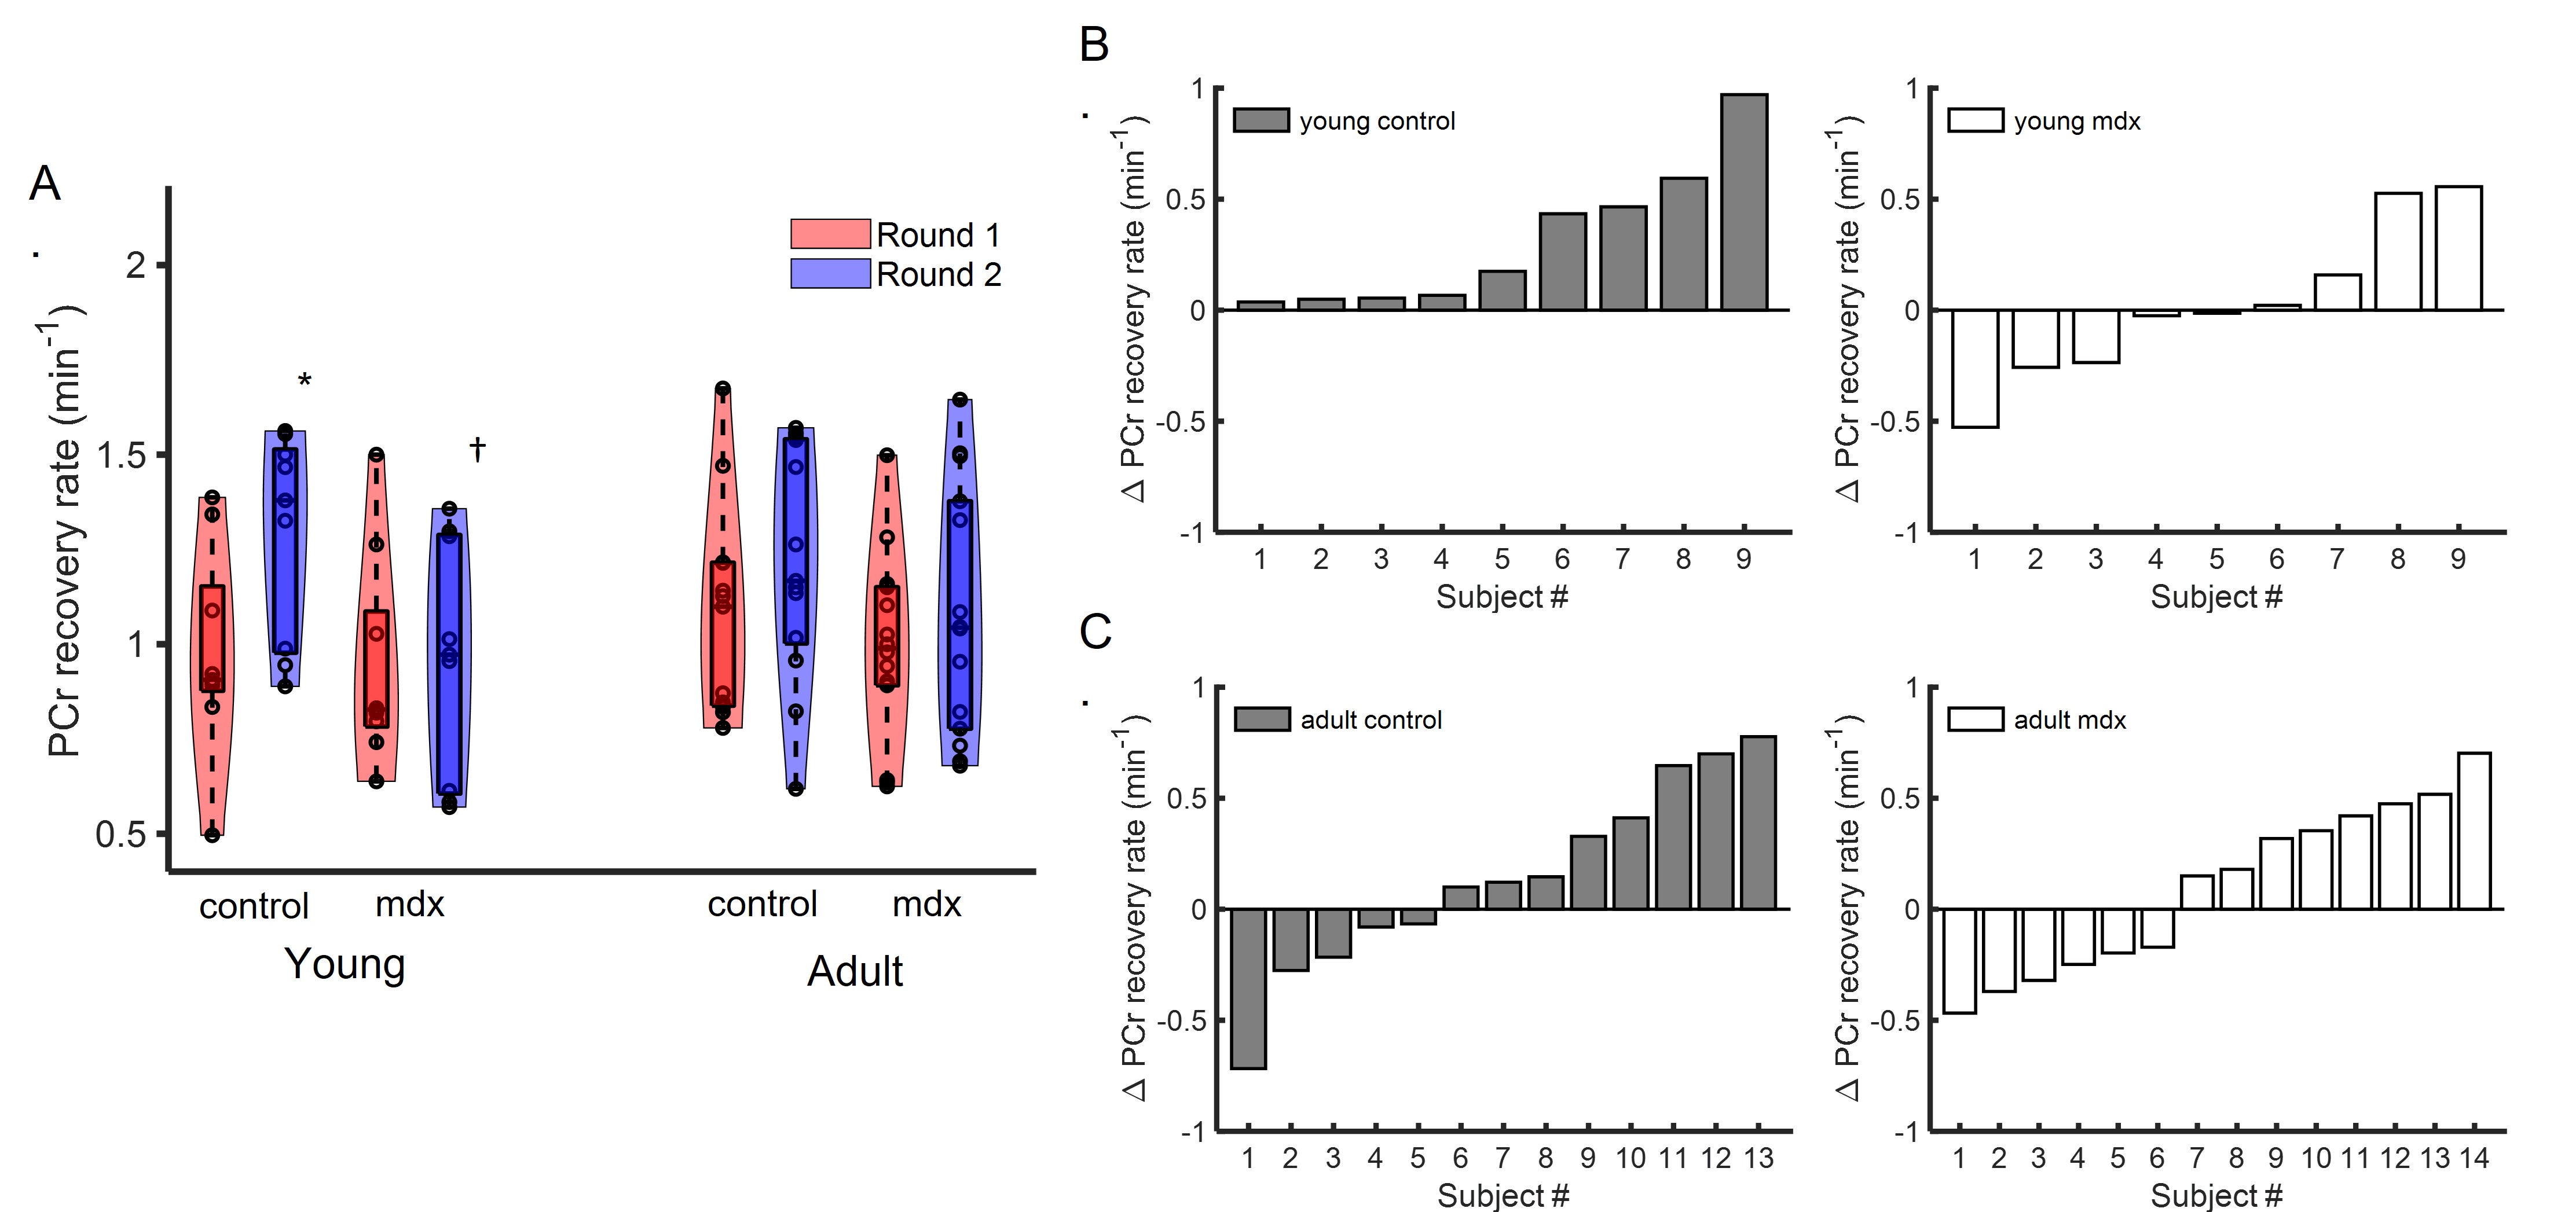
Figure 2. PCr recovery rate. A. Group-averaged PCr recovery rate after two rounds of stimulation. B&C. Net change in PCr recovery rate between Round 2 and Round 1 in individual young (B) and adult (C) mice. * p<0.05, Round 1 vs Round 2; †p<0.05 C57BL/6 vs mdx.
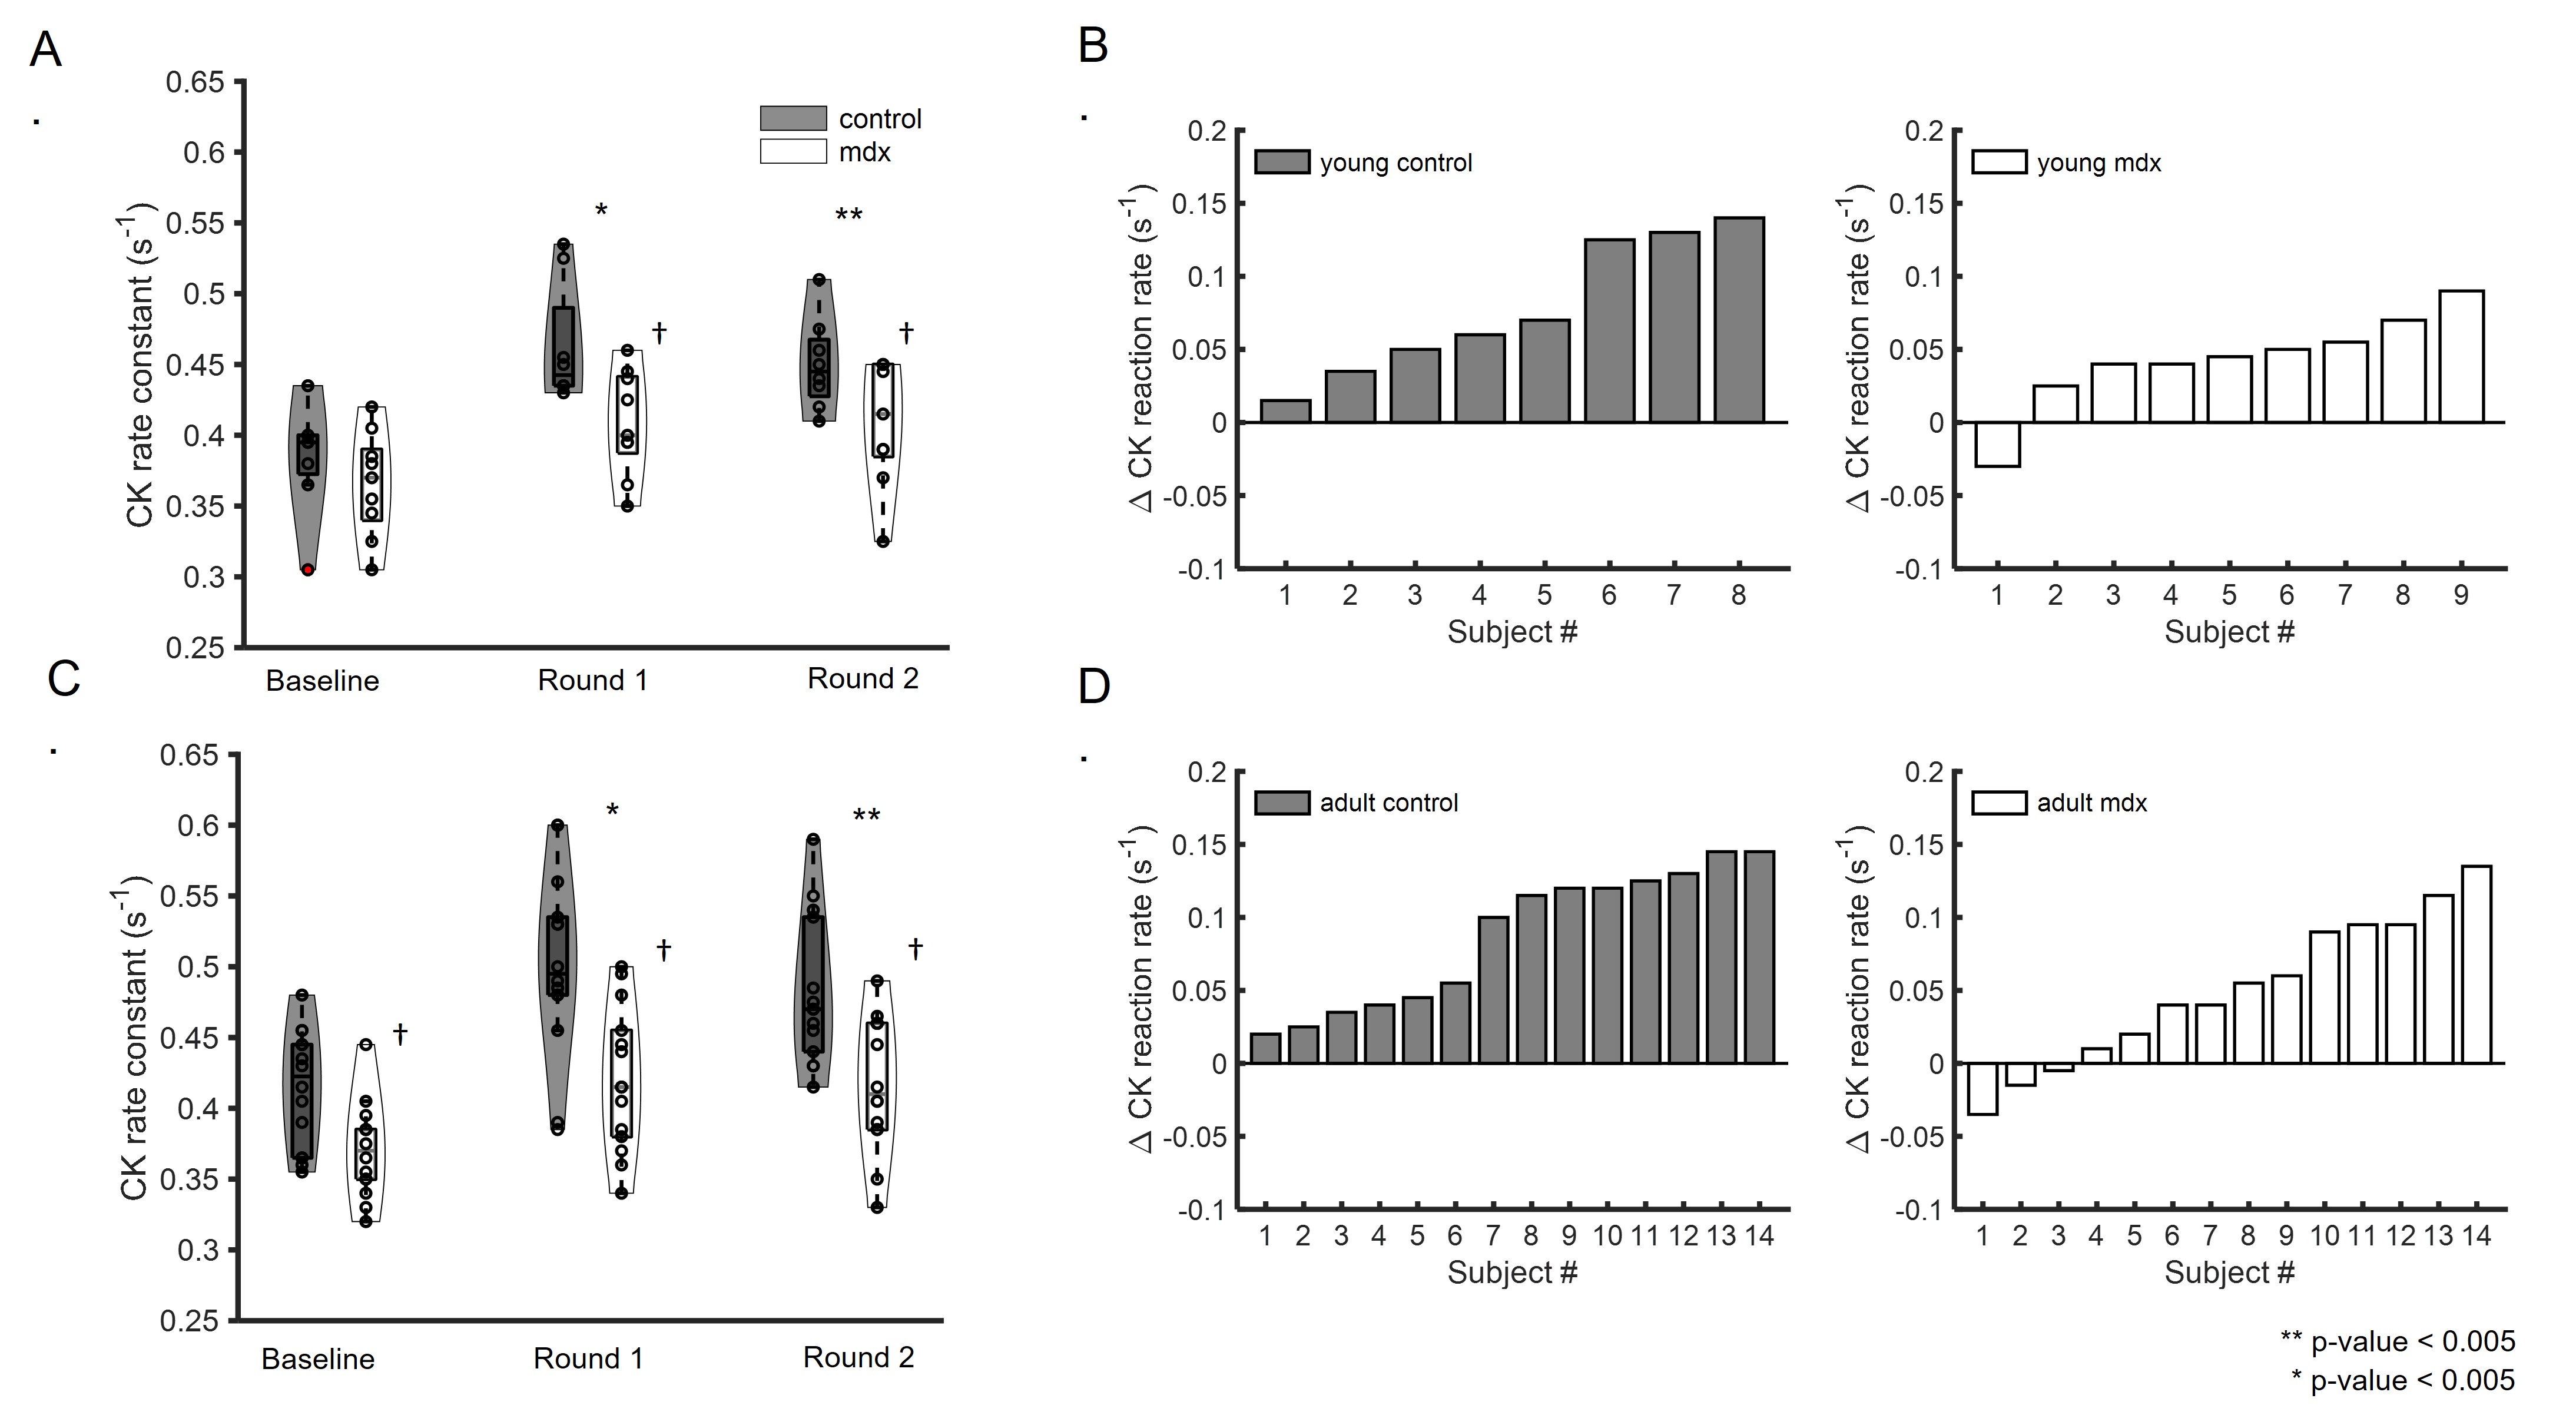
Figure 3. CK rate constant. A&C. Group-averaged CK rate constant at baseline and after two rounds of stimulation in young (A) and adult (C) mice. B&D. Net change in CK rate constant between post-stimulation and baseline in individual young (B) and adult (D) mice. *p<0.05, Round 1 vs baseline; **p<0.05, Round 2 vs baseline; †p<0.05, C57BL/6 vs mdx.
DOI: https://doi.org/10.58530/2022/0412