0410
A Neural Network Application for Fast Simultaneous Muscle T2-Water and Fat Fraction Mapping from Multi-Spin-Echo Acquisitions1Radiology, Stanford University, Stanford, CA, United States, 2Radiology and Nuclear Medicine, Amsterdam University Medical Center, Amsterdam, Netherlands, 3Bioengineering, Stanford University, Stanford, CA, United States
Synopsis
Muscle T2 relaxometry can be used to monitor disease activity in neuromuscular disorders. Dictionary matching of multi-echo-spin-echo (MESE) data is the gold-standard method to estimate the T2 of the myocitic component (T2-water) because of its ability to correct for multiple confounding factors, but suffers from a high computational burden. This work proposes a neural network (NN) approach for fast muscle T2-water mapping with subject-specific T2-fat calibration to overcome computational limitations of the dictionary method. The method was validated in-vivo against the standard dictionary approach. The NN application outperformed the dictionary approach in computational resources (x140 faster) while retaining quantitative accuracy.
Introduction
Muscle T2 relaxometry can be used to monitor disease activity in neuromuscular disorders1,2 and is commonly performed using multi-echo-spin-echo (MESE) sequences. Dictionary matching based on extended phase graph (EPG) simulations, with a two-component model (intramuscular fat and water), is the gold-standard method to estimate the T2 of the myocitic component (T2-water) because of its ability to correct for fat-fraction (FF), slice-profile and B1 inhomogeneities3,4,5. The main drawback of this approach is the computational burden arising from the creation of the dictionary and the subsequent exhaustive search across it. Moreover, since the T2 of the fat component (T2-fat) needs to be fixed to optimize fitting, multiple dictionaries are required if fat calibration is performed for each subject, increasing the computational burden.This work proposes a neural network (NN) approach for fast muscle T2-water mapping with subject-specific T2-fat calibration to overcome the computational limitations of the dictionary method.
Methods
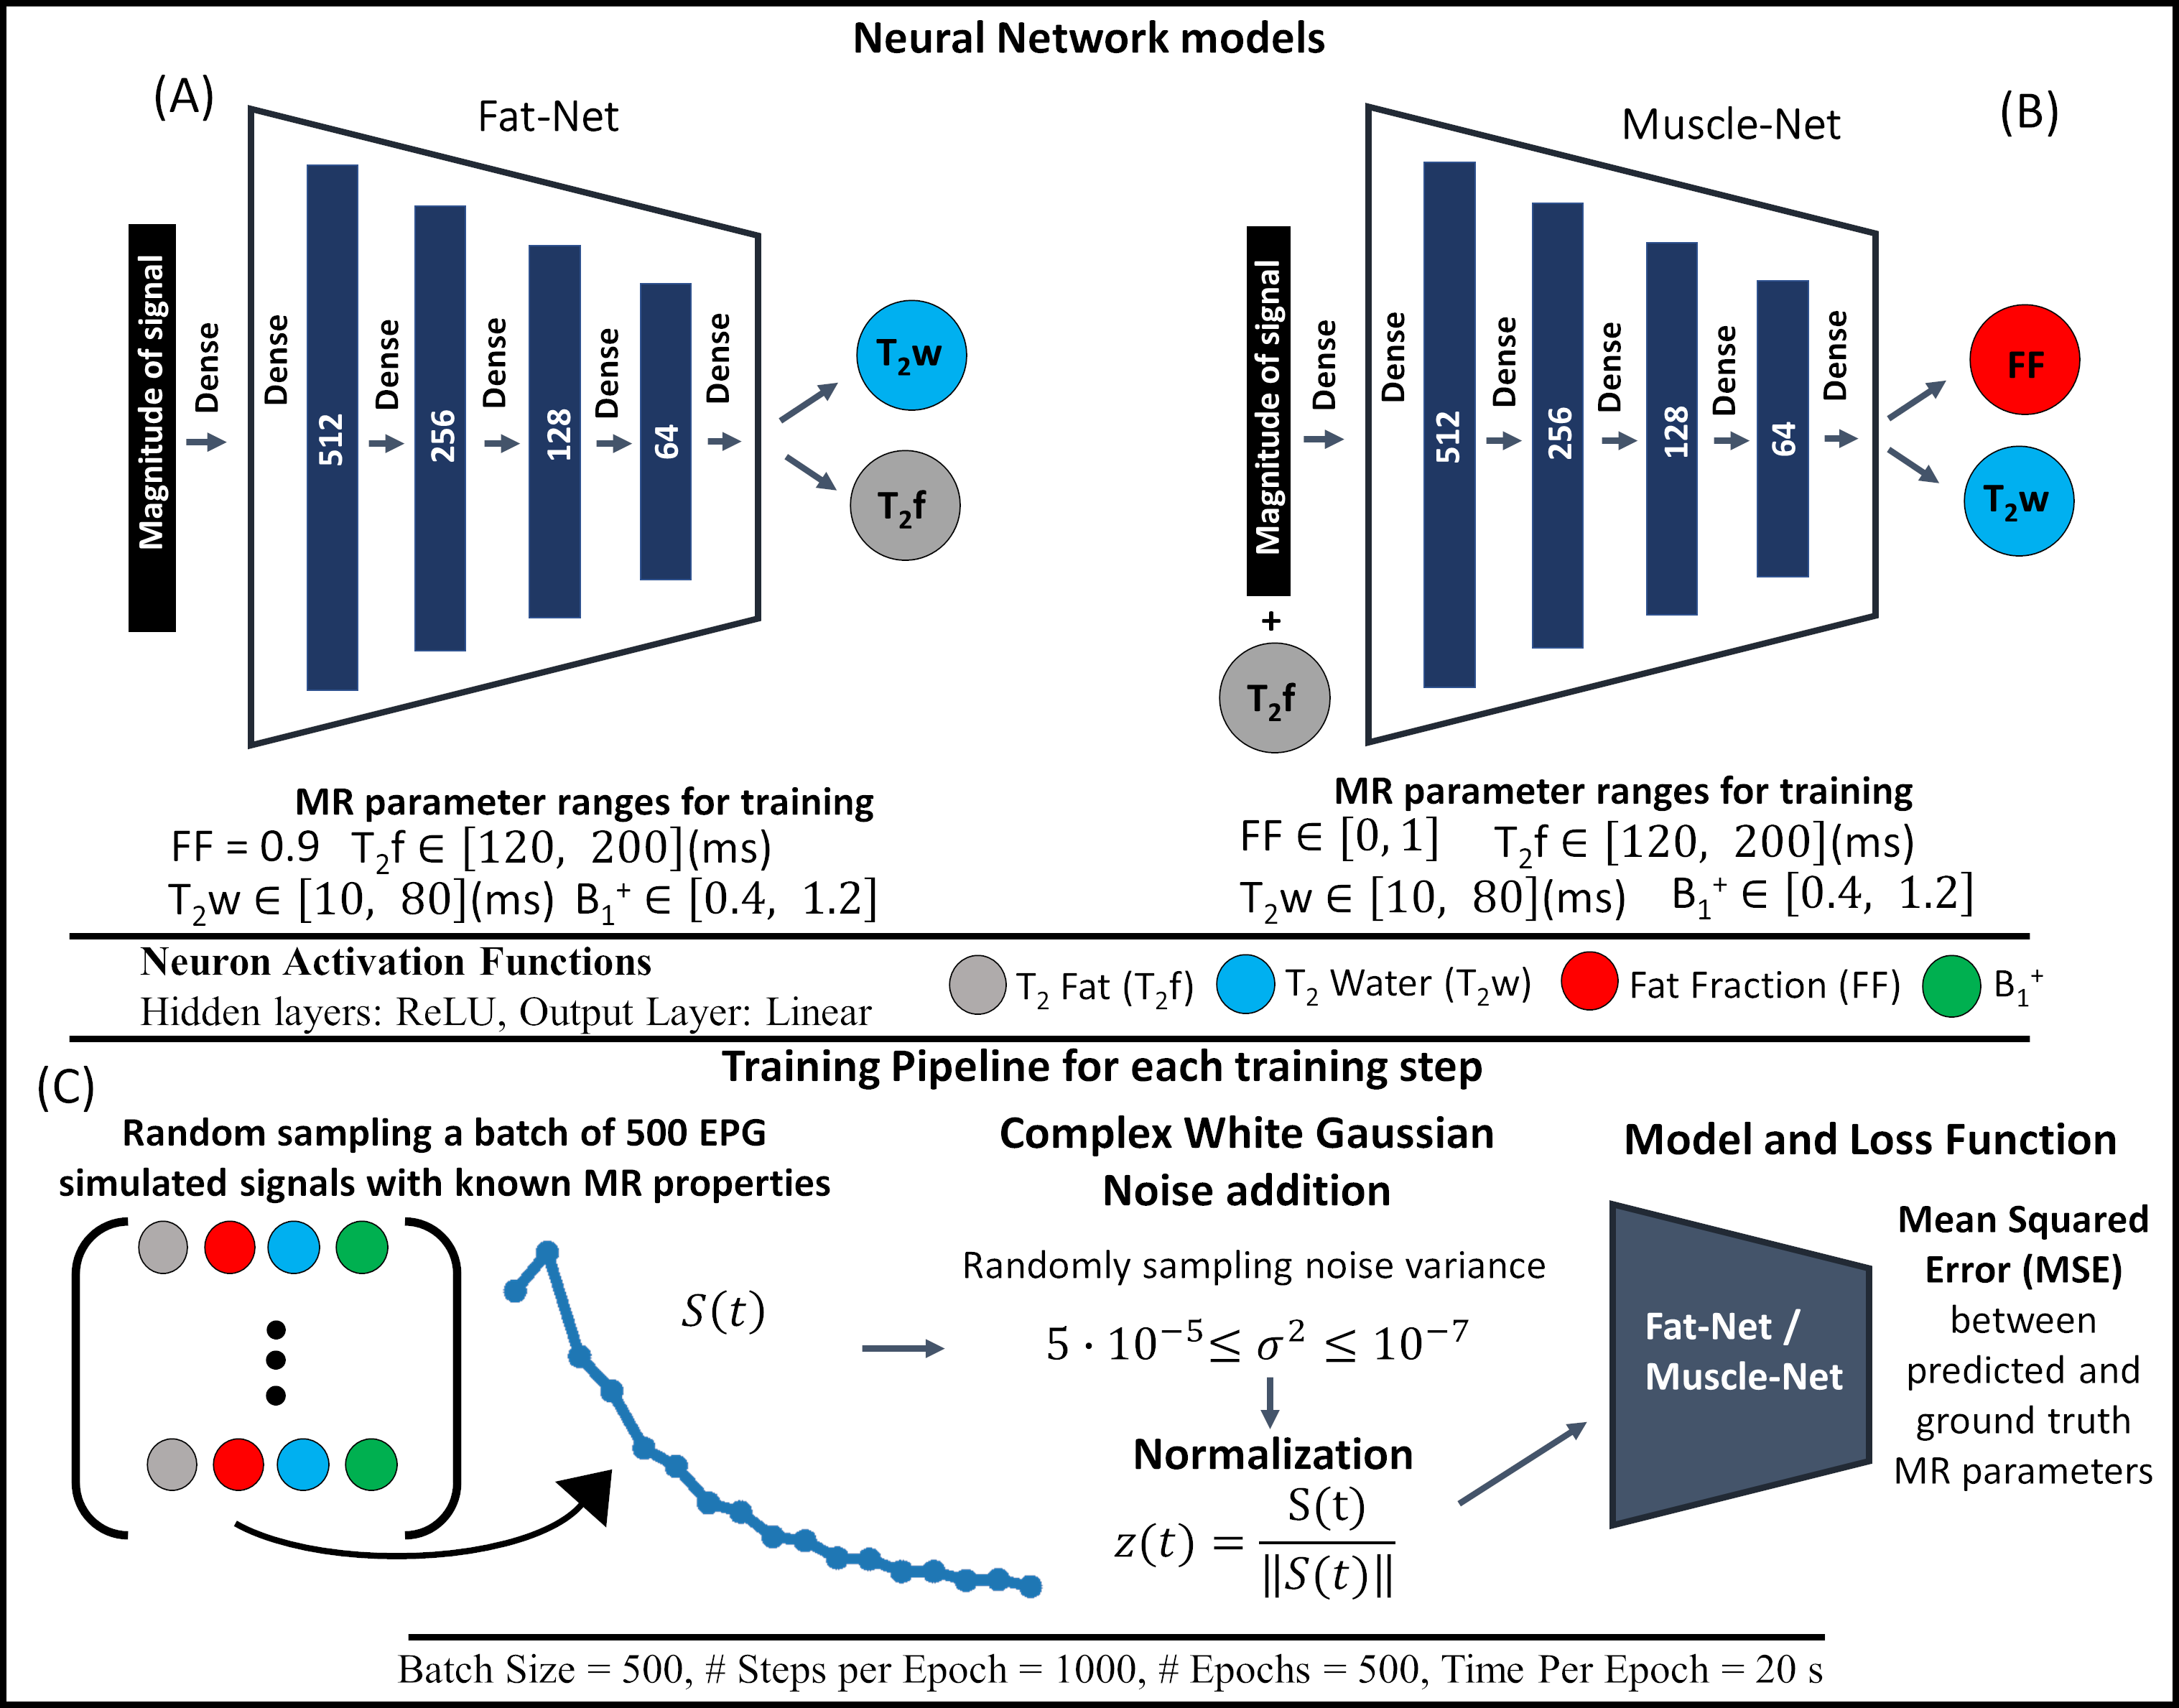
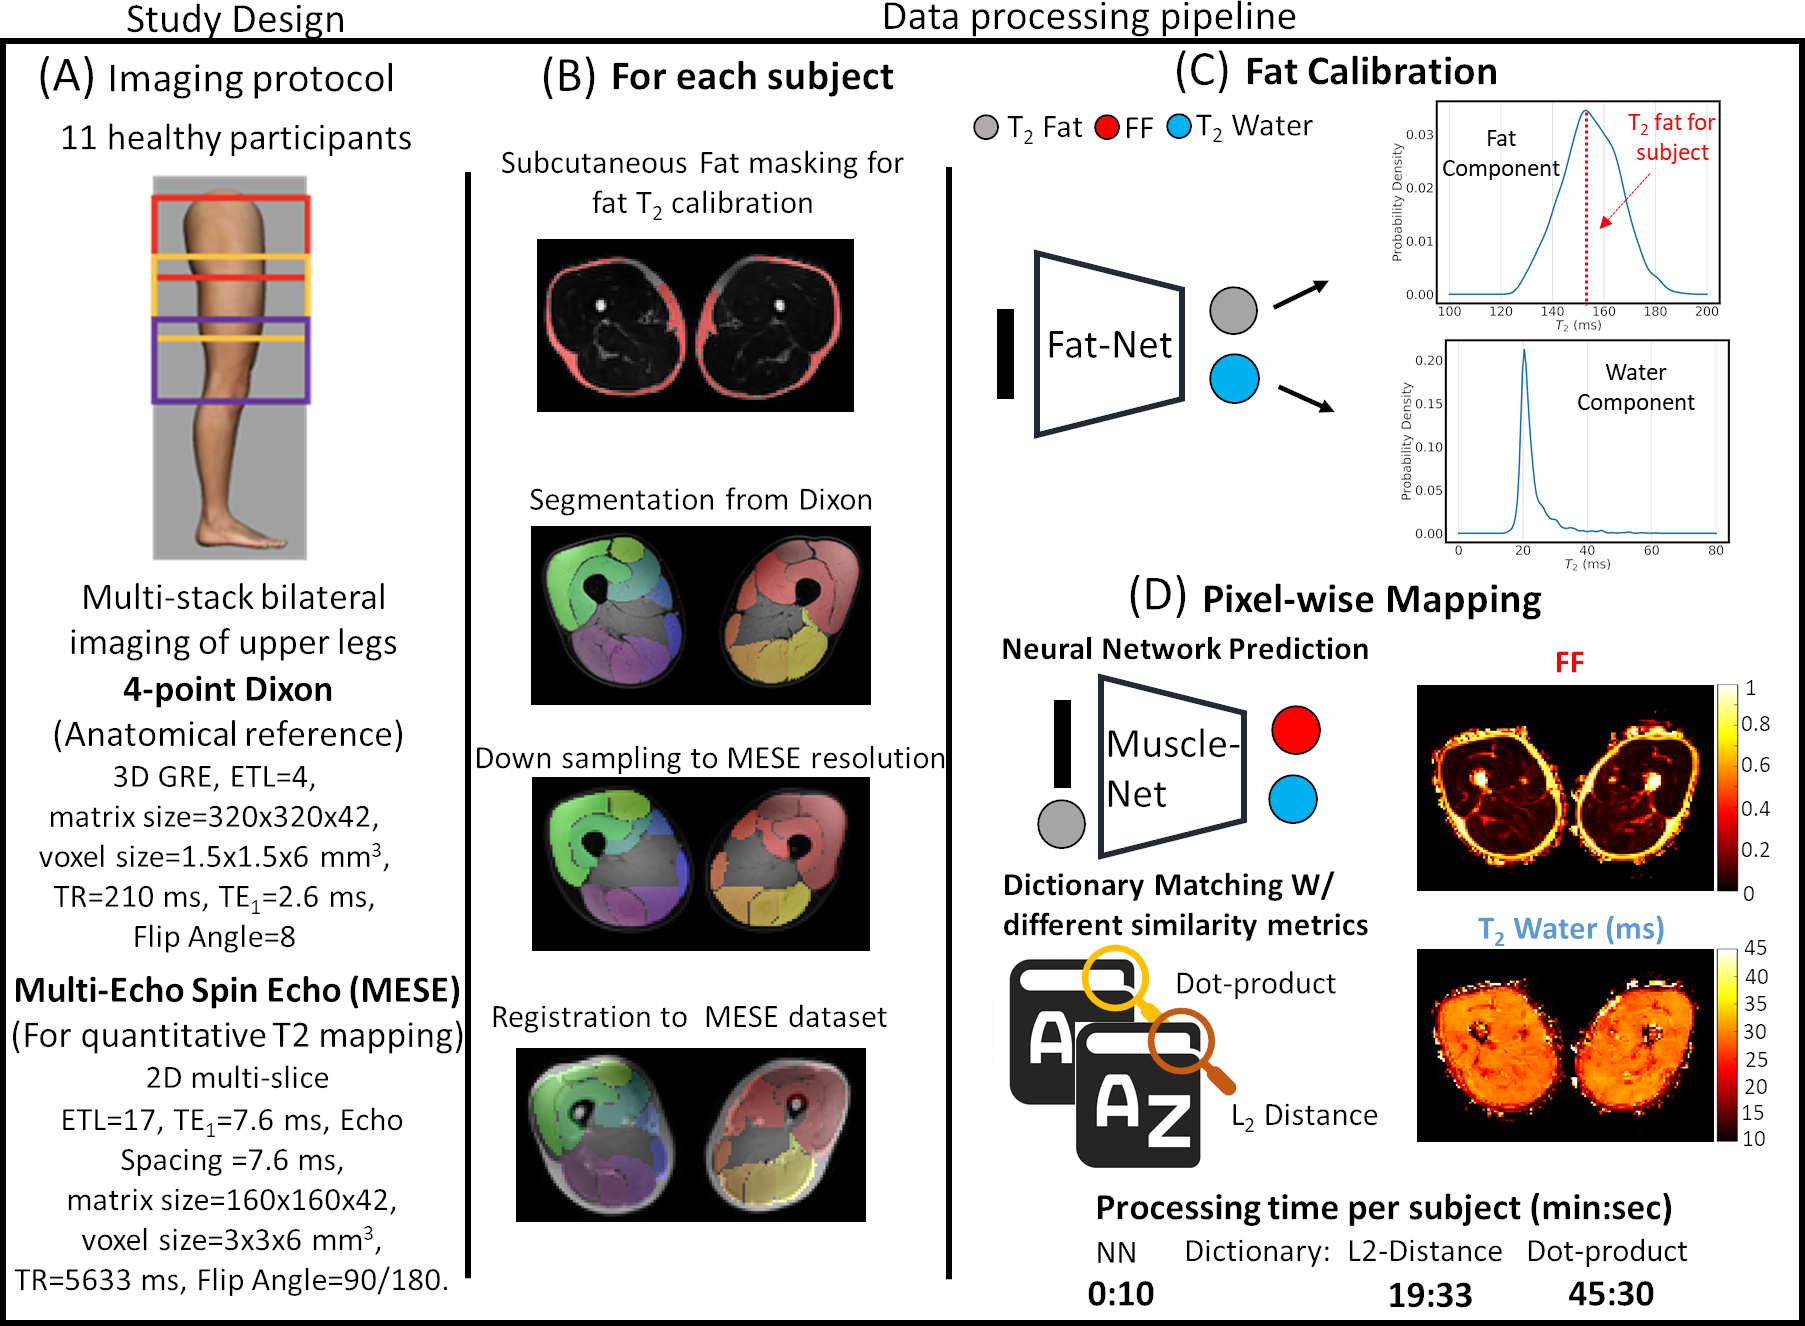
The NN application was developed in Keras and summarized in Fig. 1. Two NNs were defined: Fat-Net, for fat calibration, and Muscle-Net for T2-water and FF estimation. A training data set was generated by simulating, using the EPG formalism, the MESE fat and water signals from 100000 (T2-fat, T2-water, B1) parameter sets randomly sampled using uniform distributions (details in Fig. 1). Water and fat signals were combined using different FFs during training. The slice-profile was also considered.A multi-stack upper leg bilateral scan of eleven healthy subjects was performed at 3T (Ingenia, Philips, Best, Netherlands) that included a Dixon water/fat-separated sequence for anatomical reference and a MESE for T2-water mapping. Part of the data has been presented in6. The analysis pipeline is summarized in Fig. 2. Eight muscles in both legs were manually segmented for each subject based on the out-of-phase Dixon images. The MESE images were then registered to Dixon with Elastix7. The pre-trained Fat-Net was used to calibrate the T2-fat from a subcutaneous region selected using a thresholding segmentation (FF was fixed to 0.9 during training).
T2-water and FF maps were reconstructed with the pre-trained Muscle-Net and the conventional dictionary approach using two similarity measures: the dot product5 (in-house Matlab implementation, R2020b) and the L2 distance3 (using qMRI tools8 for Mathematica, only T2-water maps). Average T2-water values for each muscle were used to assess the agreement between the NN and the dictionary approaches employing correlation plots and Bland-Altmann (BA) analysis. Lin's concordance coefficient (ρc) and the root-mean-square-error (RMSE) coefficient variation percentage (%CV) were evaluated. Reference average FFs were estimated from Dixon.
Results
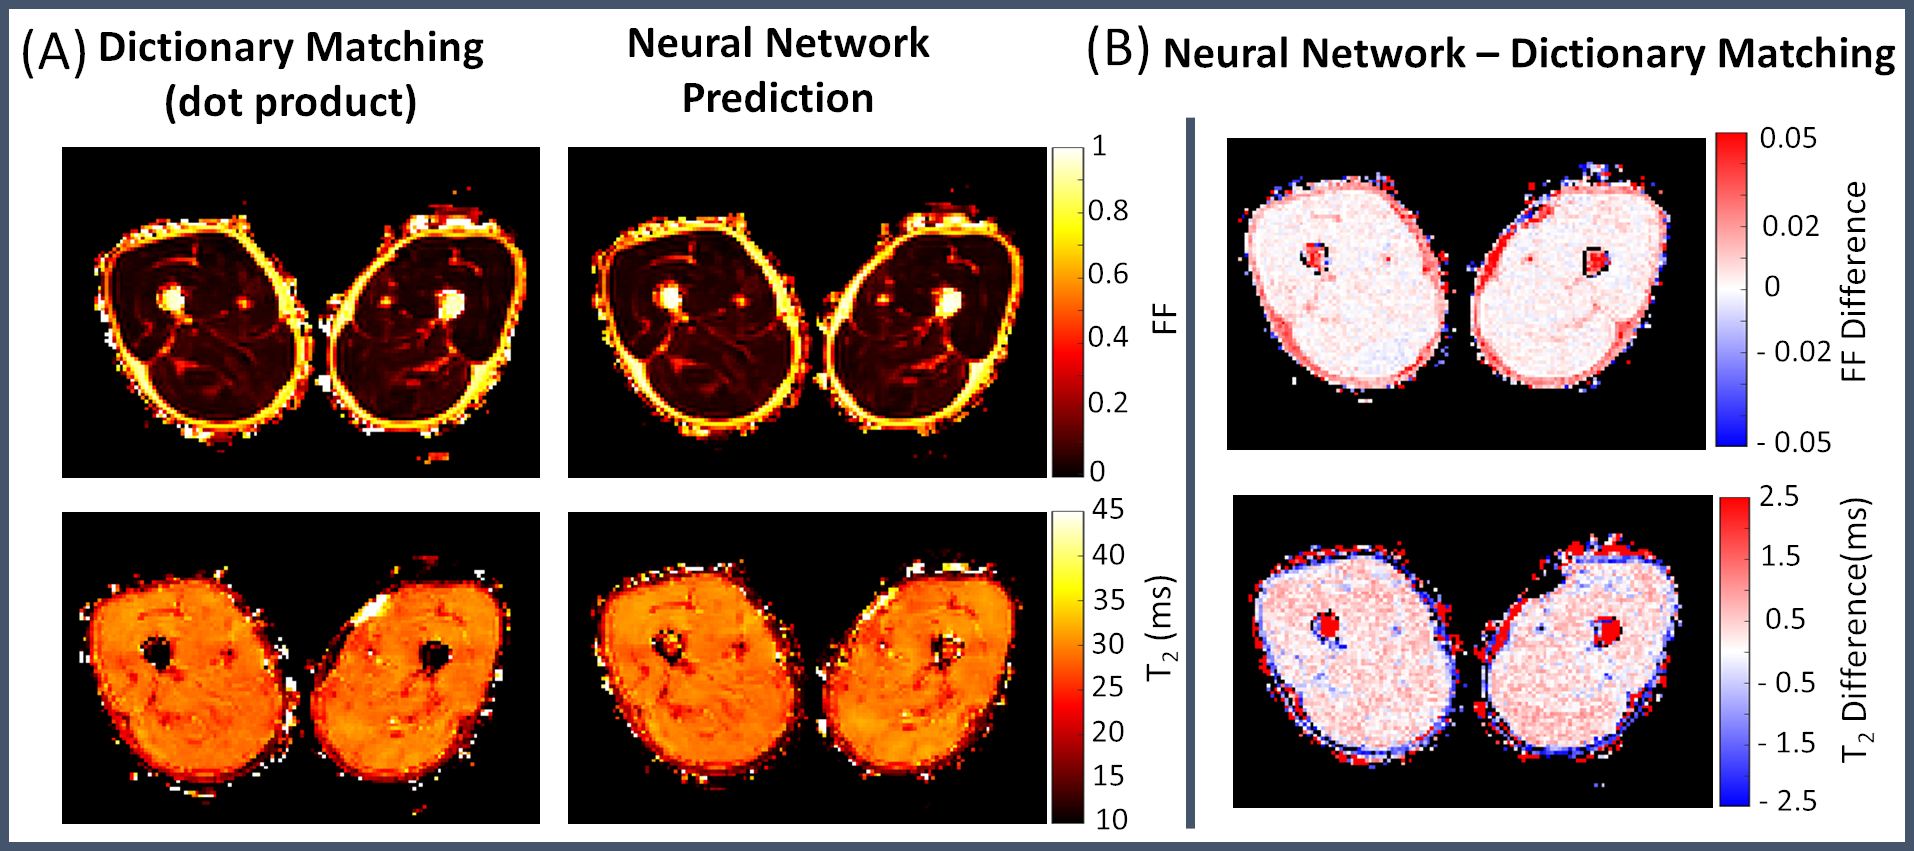
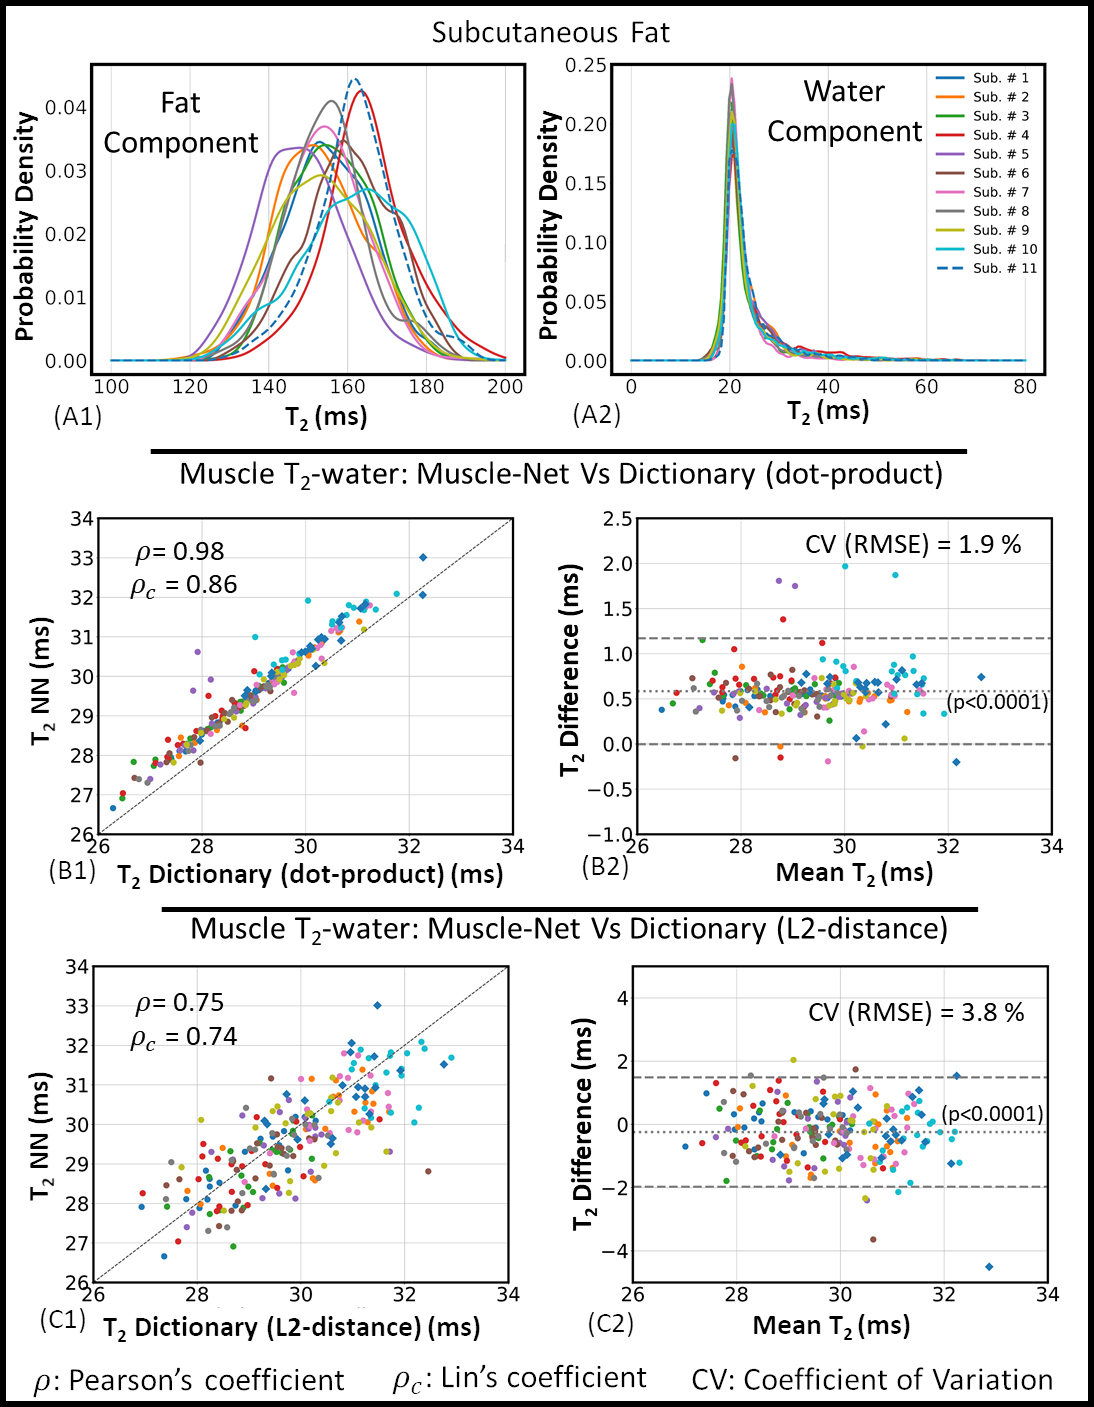
Representative parameter maps reconstructed using the NN and the dictionary approach and their corresponding difference maps are shown in Fig. 3. In muscles, the difference in T2-water between the dictionary matching and NN approach was less than 1ms.T2-fat and T2-water distributions in subcutaneous fat obtained with the Fat-Net (top panel of Fig. 4) showed that, across subjects, mean T2-fat varied within the 145-165 ms range, while the mean estimated T2-water was 20 ms for all subjects. Correlation and BA analyses are presented in the bottom panel of Fig 4. The Muscle-Net estimated T2-water values were in very good agreement with those obtained with the dictionary approach based on dot-product metric (ρ=0.98, ρc=0.86, bias=0.58 ms, CV=1.9%) and in good agreement with those computed using the L2-distance metric (ρ =0.75, ρc=0.74, bias=0.24 ms, CV=3.8%).
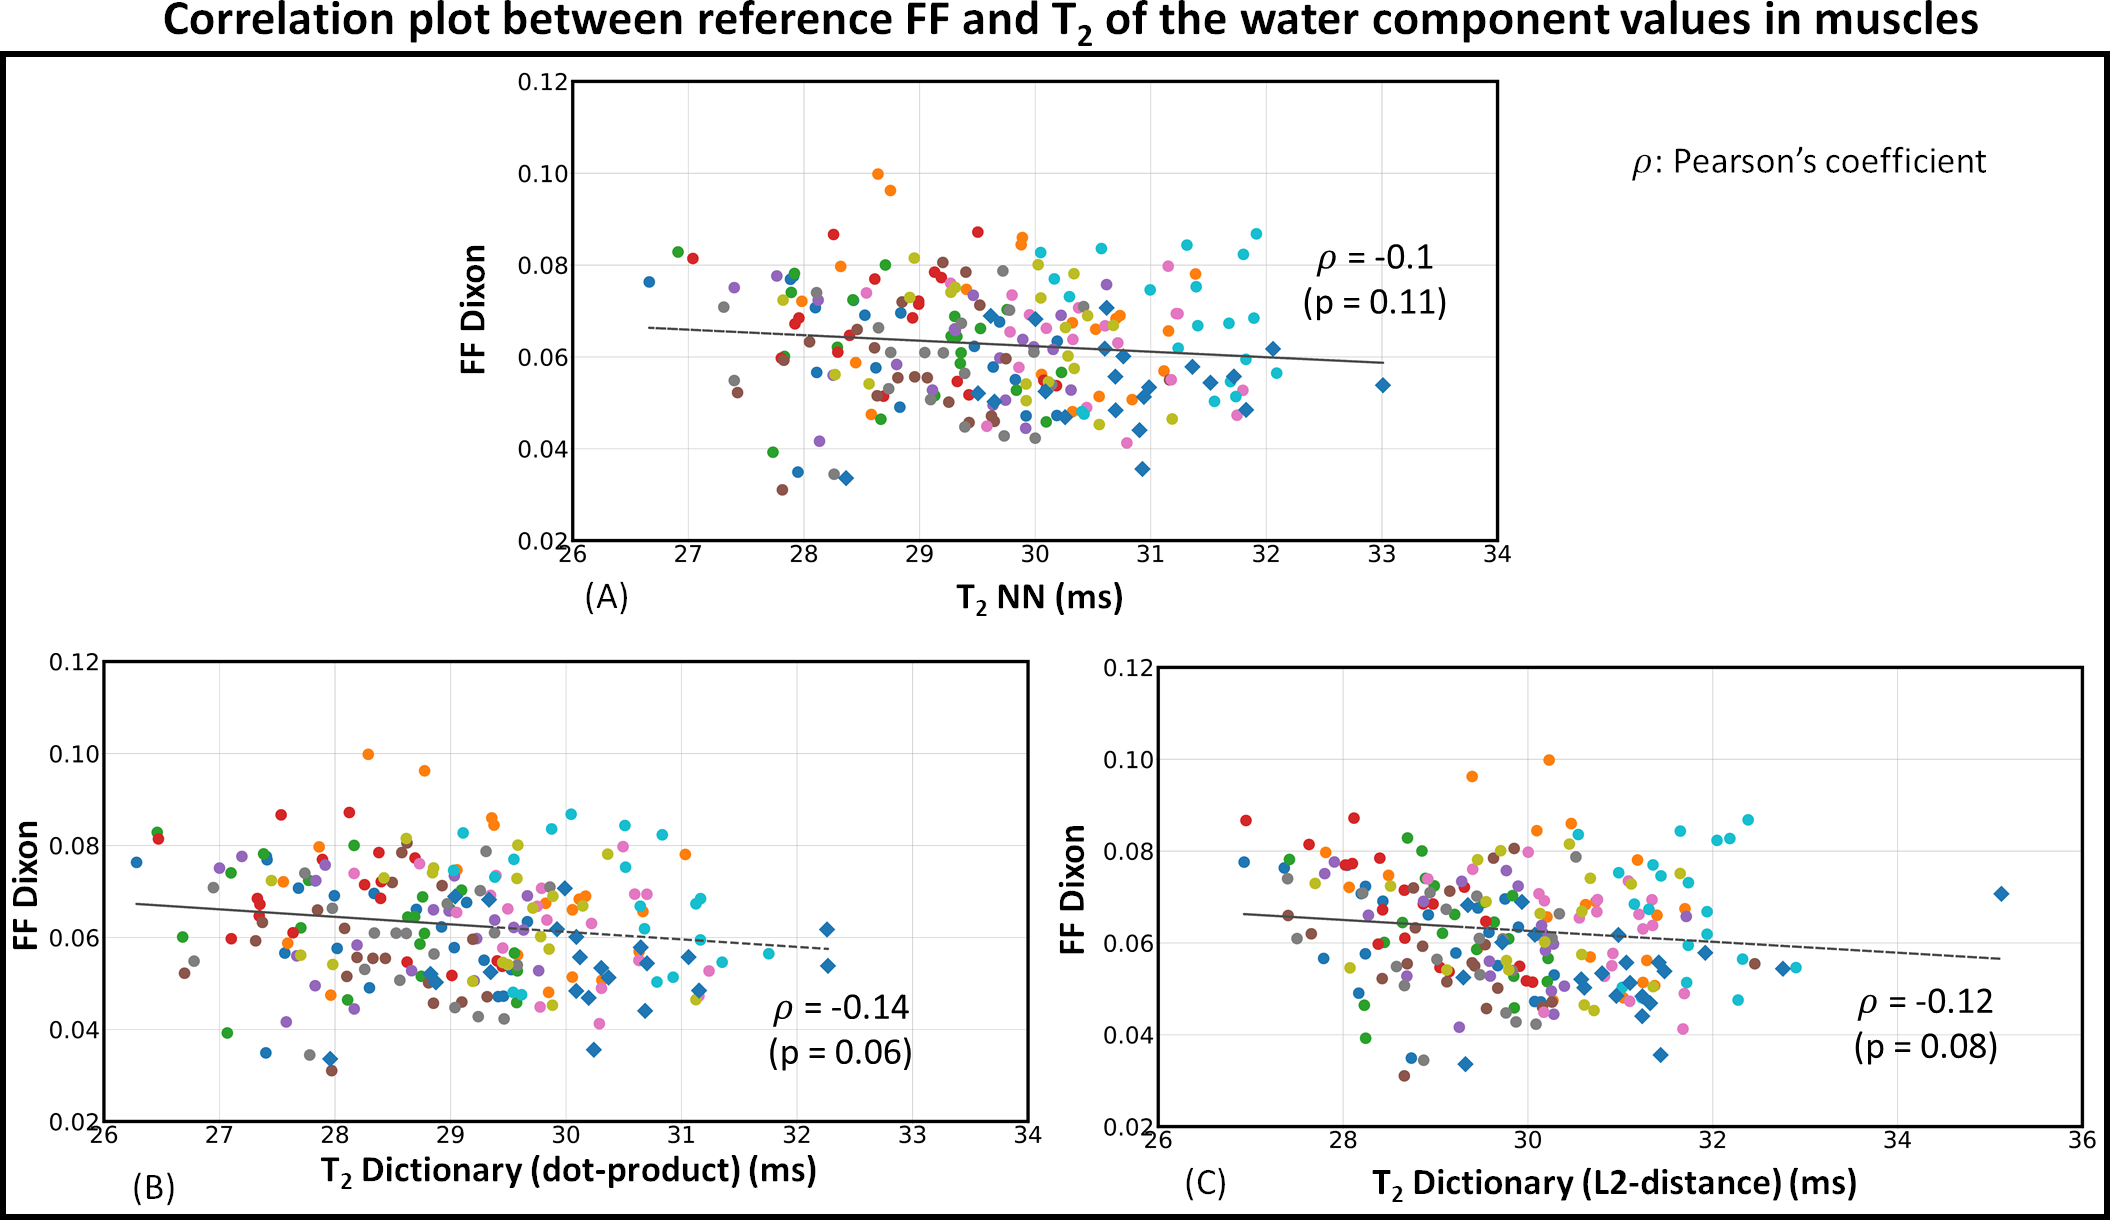
No statistically significant correlation was found between the reference FF and T2-water values (Figure 5), indicating that our approach can successfully decouple T2-water in muscle from the local FF. The processing times per subject were: 10 s for Muslce-Net, vs 1173 s and 2730 s using the dictionary matching with the L2-distance and the dot-product metrics, respectively.
Discussion
Our Muscle-Net was able to predict T2-water values that were in good agreement with those obtained using the gold-standard dictionary approach while reaching an x140 computational time improvement. Interestingly, the agreement was stronger with the dot-product-based dictionary matching, especially in terms of scattering. This suggests that the NN might exploit the correlation among signals. Differences between dot-product and L2-distance-based dictionary methods have been previously reported in the literature.Even small variations in T2-fat have been shown to cause significant differences in T2-water3, and we observed a relatively wide range of T2-fat values in a cohort of healthy participants, which is expected to be even wider in patients. However, in practice often a single fixed T2-fat is assumed for dictionary matching approaches to keep storage and computational resources manageable. The task is easily handled with our NN approach requiring minimal resources (our application was executed on a middle-range laptop using only CPUs).
A potential limitation of our approach is that new training is required whenever a new sequence is used. However, this is also a limitation of current dictionary-based methods. It is also important to put care in designing the training pipeline to allow robust learning. Although we expect good generalization capabilities on new real datasets, since only simulated data were used during training, the goodness of our training pipeline should be further investigated.
Conclusion
We successfully developed a NN approach for fast muscle T2-water mapping with subject-specific T2-fat calibration that outperformed the dictionary approach in computational resources while maintaining quantitative accuracy.Acknowledgements
No acknowledgement found.References
1. Willcocks RJ, Arpan IA, Forbes SC, et al. Longitudinal measurements of MRI-T2 in boys with Duchenne muscular dystrophy: Effects of age and disease progression. Neuromuscul Disord. 2014; 24:393-401.
2. Strijkers GJ, Araujo ECA, Azzabou N, Bendahan D: Exploration of New Contrasts, Targets, and MR Imaging and Spectroscopy Techniques for Neuromuscular Disease – A Workshop Report of Working Group 3 of the Biomedicine and Molecular Biosciences COST. 2019; 6:1–30.
3. Keene KR., Beenakker JWM, Hooijmans MT, Naarding KJ, Niks EH, Otto LAM, Ludo van der Pol W, Tannemaat MR, Kan HE, and Froeling M. “T2 Relaxation-Time Mapping in Healthy and Diseased Skeletal Muscle Using Extended Phase Graph Algorithms.” Magnetic Resonance in Medicine 84, no. 5 (2020): 2656–70.
4. Marty B, Baudin PY, Reyngoudt H, Azzabou N, Araujo ECA, Carlier PG, and Louis de Sousa P. “Simultaneous Muscle Water T2 and Fat Fraction Mapping Using Transverse Relaxometry with Stimulated Echo Compensation.” NMR in Biomedicine 29, no. 4 (2016): 431–43.
5. Santini F, Deligianni X, Paoletti M, Solazzo, Weigel M, Loureiro de Sousa P, Bieri O, et al. “Fast Open-Source Toolkit for Water T2 Mapping in the Presence of Fat From Multi-Echo Spin-Echo Acquisitions for Muscle MRI.” Frontiers in Neurology (2021): 248.
6. Hooijmans MT, Monte JRC, Froeling M, van den Berg-Faay S, Aengevaeren VL, Hemke R, Smithuis FF, et al. “Quantitative MRI Reveals Microstructural Changes in the Upper Leg Muscles After Running a Marathon.” Journal of Magnetic Resonance Imaging 52, no. 2 (August 1, 2020): 407–17.
7. Klein S, Staring M, Murphy K, Viergever MA, Pluim JPW. “Elastix: A toolbox for intensity-based medical image registration". IEEE Trans Med Imaging (2010); 29:196–205.
8. Froeling M. "QMRTools: a Mathematica toolbox for quantitative MRI analysis. J Open Source Softw" (2019); 4:1204.
9. Barbieri M, Brizi L, Giampieri E, Solera F, Manners DN, Castellani G, Testa C, and Remondini D. “A Deep Learning Approach for Magnetic Resonance Fingerprinting: Scaling Capabilities and Good Training Practices Investigated by Simulations.” Physica Medica 89 (2021): 1120–1797.
10. Barbieri M, Lee PK, Brizi L, Giampieri E, Toews AR, Castellani G, et al. Deep Learning for Magnetic Resonance Fingerprinting: Data Augmentation with Phase Encoding and SVD Preprocessing for Accurate Parameter Reconstruction of FISP Data; (2019). Proc Intl Soc Mag Reson Med 27
Figures