0408
Early Chemotherapeutic Response Evaluation In Ewing Sarcoma Using Diffusion Weighted MRI1Indian Institute of Technology Delhi, Delhi, India, 2Krishna Imaging & Diagnostics, Telengana, India, 3All India Institute of Medical Sciences Delhi, Delhi, India
Synopsis
The objective of this prospective study was to assess the role of diffusion weighted MRI for early evaluation of chemotherapy response in patients with Ewing sarcoma with RECIST 1.1 criteria correlation. Absolute apparent diffusion coefficient (ADC), normalized ADC (nADC) and tumor diameter at baseline and after 1st cycle of chemotherapy were assessed for early detection of chemotherapy response in 16 patients. Results showed, baseline nADC and after 1st chemotherapy cycle, relative percentage change (Δ%) in nADC & tumor-size were significant and observed to be useful markers of early chemotherapeutic response (AUC=0.700, 0.750, 0.938) in Ewing sarcoma.
Introduction
Ewing Sarcoma Family of Tumors (ESFT) is the second most common primary malignant bone tumor in children and young adults next to osteosarcoma1. ESFT is treated with systemic neoadjuvant chemotherapy for local control. The assessment of chemotherapy response is done by the RECIST 1.1 criteria2 (Response evaluation criteria in solid tumors) after completion of chemotherapy or by histopathology of resected tumor. However, early noninvasive assessment of tumor response to chemotherapy may help to prevent the non-responders from undergoing ineffective chemotherapy regimen and can be directed to alternate therapeutic option. Therefore, this study was undertaken to assess the role of diffusion weighted (DW) MRI in the early evaluation of chemotherapy response in ESFT using correlation with RECIST 1.1.Methods
Patients: Sixteen patients (n=16; age=16.8±5.6years; Male:Female=10:6) with biopsy proven ESFT were analysed prospectively. All patients underwent neoadjuvant chemotherapy: VAC (Vincristine, Doxorubicin/Actinomycin-D, Cyclophosphamide) alternated with IE (Ifosfamide, Etoposide) for 5 complete cycles at three weeks interval followed by surgery and/or chemotherapy/chemo-radiotherapy.MRI acquisition: Conventional T1W and T2W along with DW-MRI scan was acquired on a 1.5Tesla scanner (Achieva; Philips,Netherlands) at three time points: first, within 7 days prior to starting chemotherapy (baseline); second, after one week of 1st chemotherapy cycle (early-time-point) and third, after completion of chemotherapy (last-time-point). DW-MRI sequence was acquired using free breathing SE-EPI(Spin-echo Echo Planar Imaging) using parallel imaging at b-values of 0,100,500,1000 s/mm2 and diffusion sensing gradients were applied in all three orthogonal planes. ADC maps were derived from all b-values automatically on a voxel-by-voxel basis.
RECIST 1.1 for chemotherapy response: RECIST 1.1 criteria2 was considered as the clinical standard for evaluation of response to chemotherapy. Complete Response(CR) was total disappearance of all target lesions; Partial Response(PR) was minimum 30% decrease in the sum of diameters of target lesions with reference to baseline; Progressive Disease(PD) was minimum 20% increase and an absolute increase of at least 5mm in the sum of diameters of target lesions; Stable Disease(SD) was if neither PR and nor PD. Patients with PR and CR were categorized as responders and SD and PD were categorized as non-responders.
Quantitative image analysis: The largest diameter of tumor was measured manually on axial T2W images at baseline(SB), early-time-point(SE) and last-time-point(SL). Percentage size changes between baseline and early-time-point(Δ%SE) and between baseline and last-time-point(Δ%SL) were calculated.
Region of interest(ROI) of the largest tumor cross-section was drawn manually on axial DWI (b=1000s/mm2) slice and automatically transferred to the ADC map with reference to T2W images. Absolute mean ADC in tumor ROI and normalized ADC (nADC) by obtaining ratio of ADC in tumor and muscle3,4, were calculated. Muscle ADC was calculated by placing 10 mm2 size ROI on adjacent healthy skeletal muscle. ADC and nADC values were calculated for baseline (ADCB, nADCB) and early-time-point (ADCE, nADCE). At early-time-point with respect to baseline values, absolute change in ADC (ΔADCE) and nADC (ΔnADCE) and percentage change in ADC (Δ%ADCE) and nADC (Δ%nADCE) were calculated.
Statistical analysis: Baseline parameters and change in the parameters after one cycle of chemotherapy were assessed for early detection of chemotherapy response. Inter-group comparison between responders and non-responders was performed using Mann-Whitney-Wilcoxon test. Intra-group comparison between baseline and early-time-point was performed using Wilcoxon-signed-rank test. Receiver-operating-characteristics (ROC) curve analysis was used to assess the predictability of chemotherapy response by quantitative parameters. Data was analysed by using SPSS v15 and a p-value=0.05 was considered for statistical significance.
Results
Based on RECIST1.1 score, responder:non-responder was 10(CR:2,PR:8):6(SD:5,PD:1). Among responders and non-responders, SB, Δ%SE, and Δ%SL are presented in Table1. Δ%SE in responders (26±14%) was significantly higher (p=0.001) compared with non-responders (4.6±10%).At baseline ADCB, nADCB and its changes at early-time-point are presented in Table2. At baseline, comparatively lower mean ADCB ((0.811±0.262 vs. 0.977±0.246)×10-3mm2/sec; p=0.360) and significantly lower mean nADCB ((0.710±0.299 vs. 0.925±0.262)×10-3mm2/sec; p=0.035) were observed among responders than the non-responders. At early-time-point, significantly higher Δ%nADCE among responders was noted (75%±42%; p<0.001) than the non-responders (48%±67%; p=0.086).
ROC curve analysis of size and diffusion parameters are presented in Table3. nADCB produced AUC=0.7 for predicting chemotherapy response at baseline. At early-time-point for predicting chemotherapy response, ∆ADCE,∆%ADCE produced AUC=0.701,0.720 respectively; while ∆nADCE, ∆%nADCE produced AUC=0.710,0.750 respectively and ∆%SE produced the highest AUC=0.938 (optimal-cutoff≥13%,sensitivity=83%,specificity=100%) for predicting chemotherapy response.
DWI b=1000s/mm2 and corresponding ADC map of a representative patient each from the responder and non-responder group are presented in Figure1 and Figure2 respectively.
Discussion
In this study higher pre-treatment ADC values in tumor have been observed among non-responders indicating possible necrosis in tumor and less sensitivity to cytotoxic agents due to decreased perfusion in tumor similar to earlier studies5. After chemotherapy significant increase in ADC was observed among responders as also reported by6,7. The percentage change in nADC was a better predictor of response compared to absolute nADC change; because, for a small absolute change in ADC, the relative percentage change may be significant. The optimal timing for imaging to detect the rise in ADC is crucial and hard to predict and required further studies with large sample size.Conclusion
Baseline nADC and its change after the first cycle of chemotherapy can be used as non-invasive surrogate markers of early assessment of response to chemotherapy in patients with ESFT.Acknowledgements
No acknowledgement found.References
1. Esiashvili N, Goodman M, Marcus RB (2008) Changes in incidence and survival of Ewing sarcoma patients over the past 3 decades: Surveillance Epidemiology and End Results data. J Pediatr Hematol Oncol 30:425–30.
2. Eisenhauer EA, Therasse P, Bogaerts J et al. (2009) New response evaluation criteria in solid tumours: revised RECIST guideline (version 1.1). Eur J Cancer 45:228-247. doi:10.1016/j.ejca.2008.10.026
3. Do RKG, Chandarana H, Chandanara H et al. (2010) Diagnosis of liver fibrosis and cirrhosis with diffusion-weighted imaging: value of normalized apparent diffusion coefficient using the spleen as reference organ. AJR Am J Roentgenol 195:671–6.
4. Wang HJ, Pui MH, Guo Y et al. (2014) Value of normalized apparent diffusion coefficient for estimating histological grade of vesical urothelial carcinoma. Clin Radiol 69:727–31.
5. Koh D-M, Collins DJ (2007) Diffusion-weighted MRI in the body: applications and challenges in oncology. AJR Am J Roentgenol 188:1622–35.
6. Hayashida Y, Yakushiji T, Awai K et al. (2006) Monitoring therapeutic responses of primary bone tumors by diffusion-weighted image: initial results. Eur Radiol 16:2637–43.
7. Degnan AJ, Chung CY, Shah AJ (2018) Quantitative diffusion-weighted magnetic resonance imaging assessment of chemotherapy treatment response of pediatric osteosarcoma and Ewing sarcoma malignant bone tumors. Clinical Imaging 47:9–13.
Figures
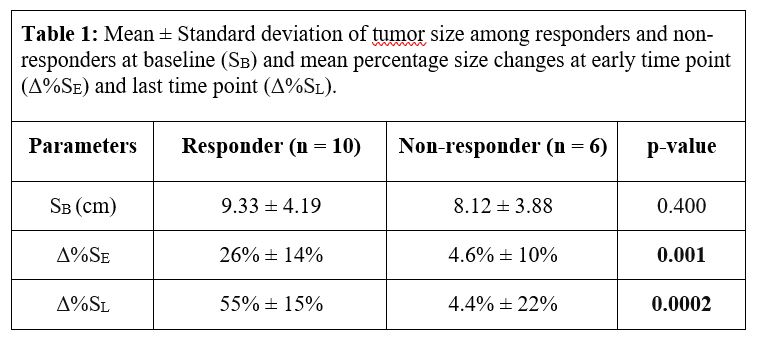
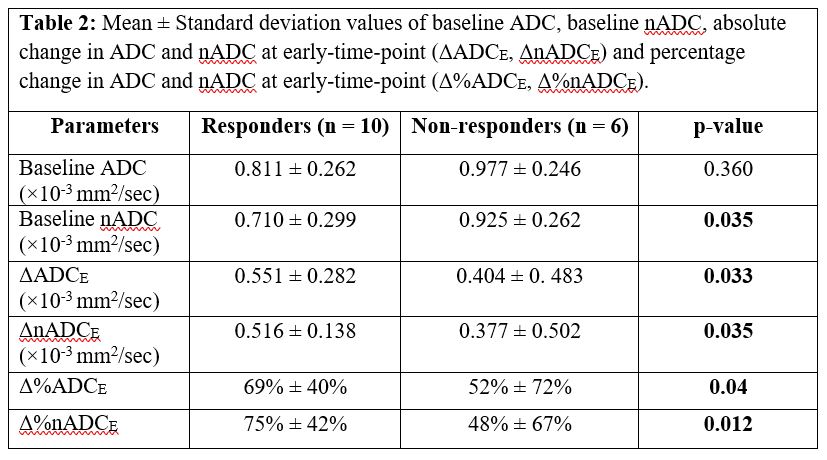
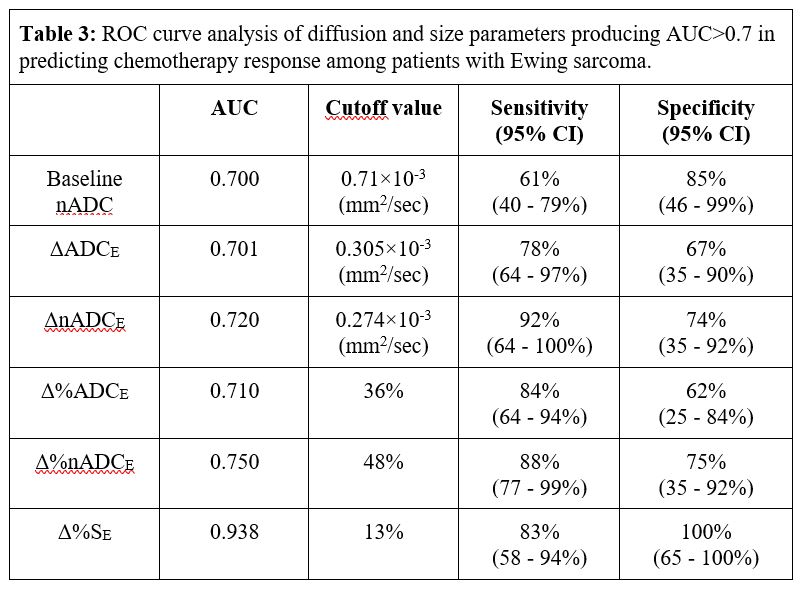
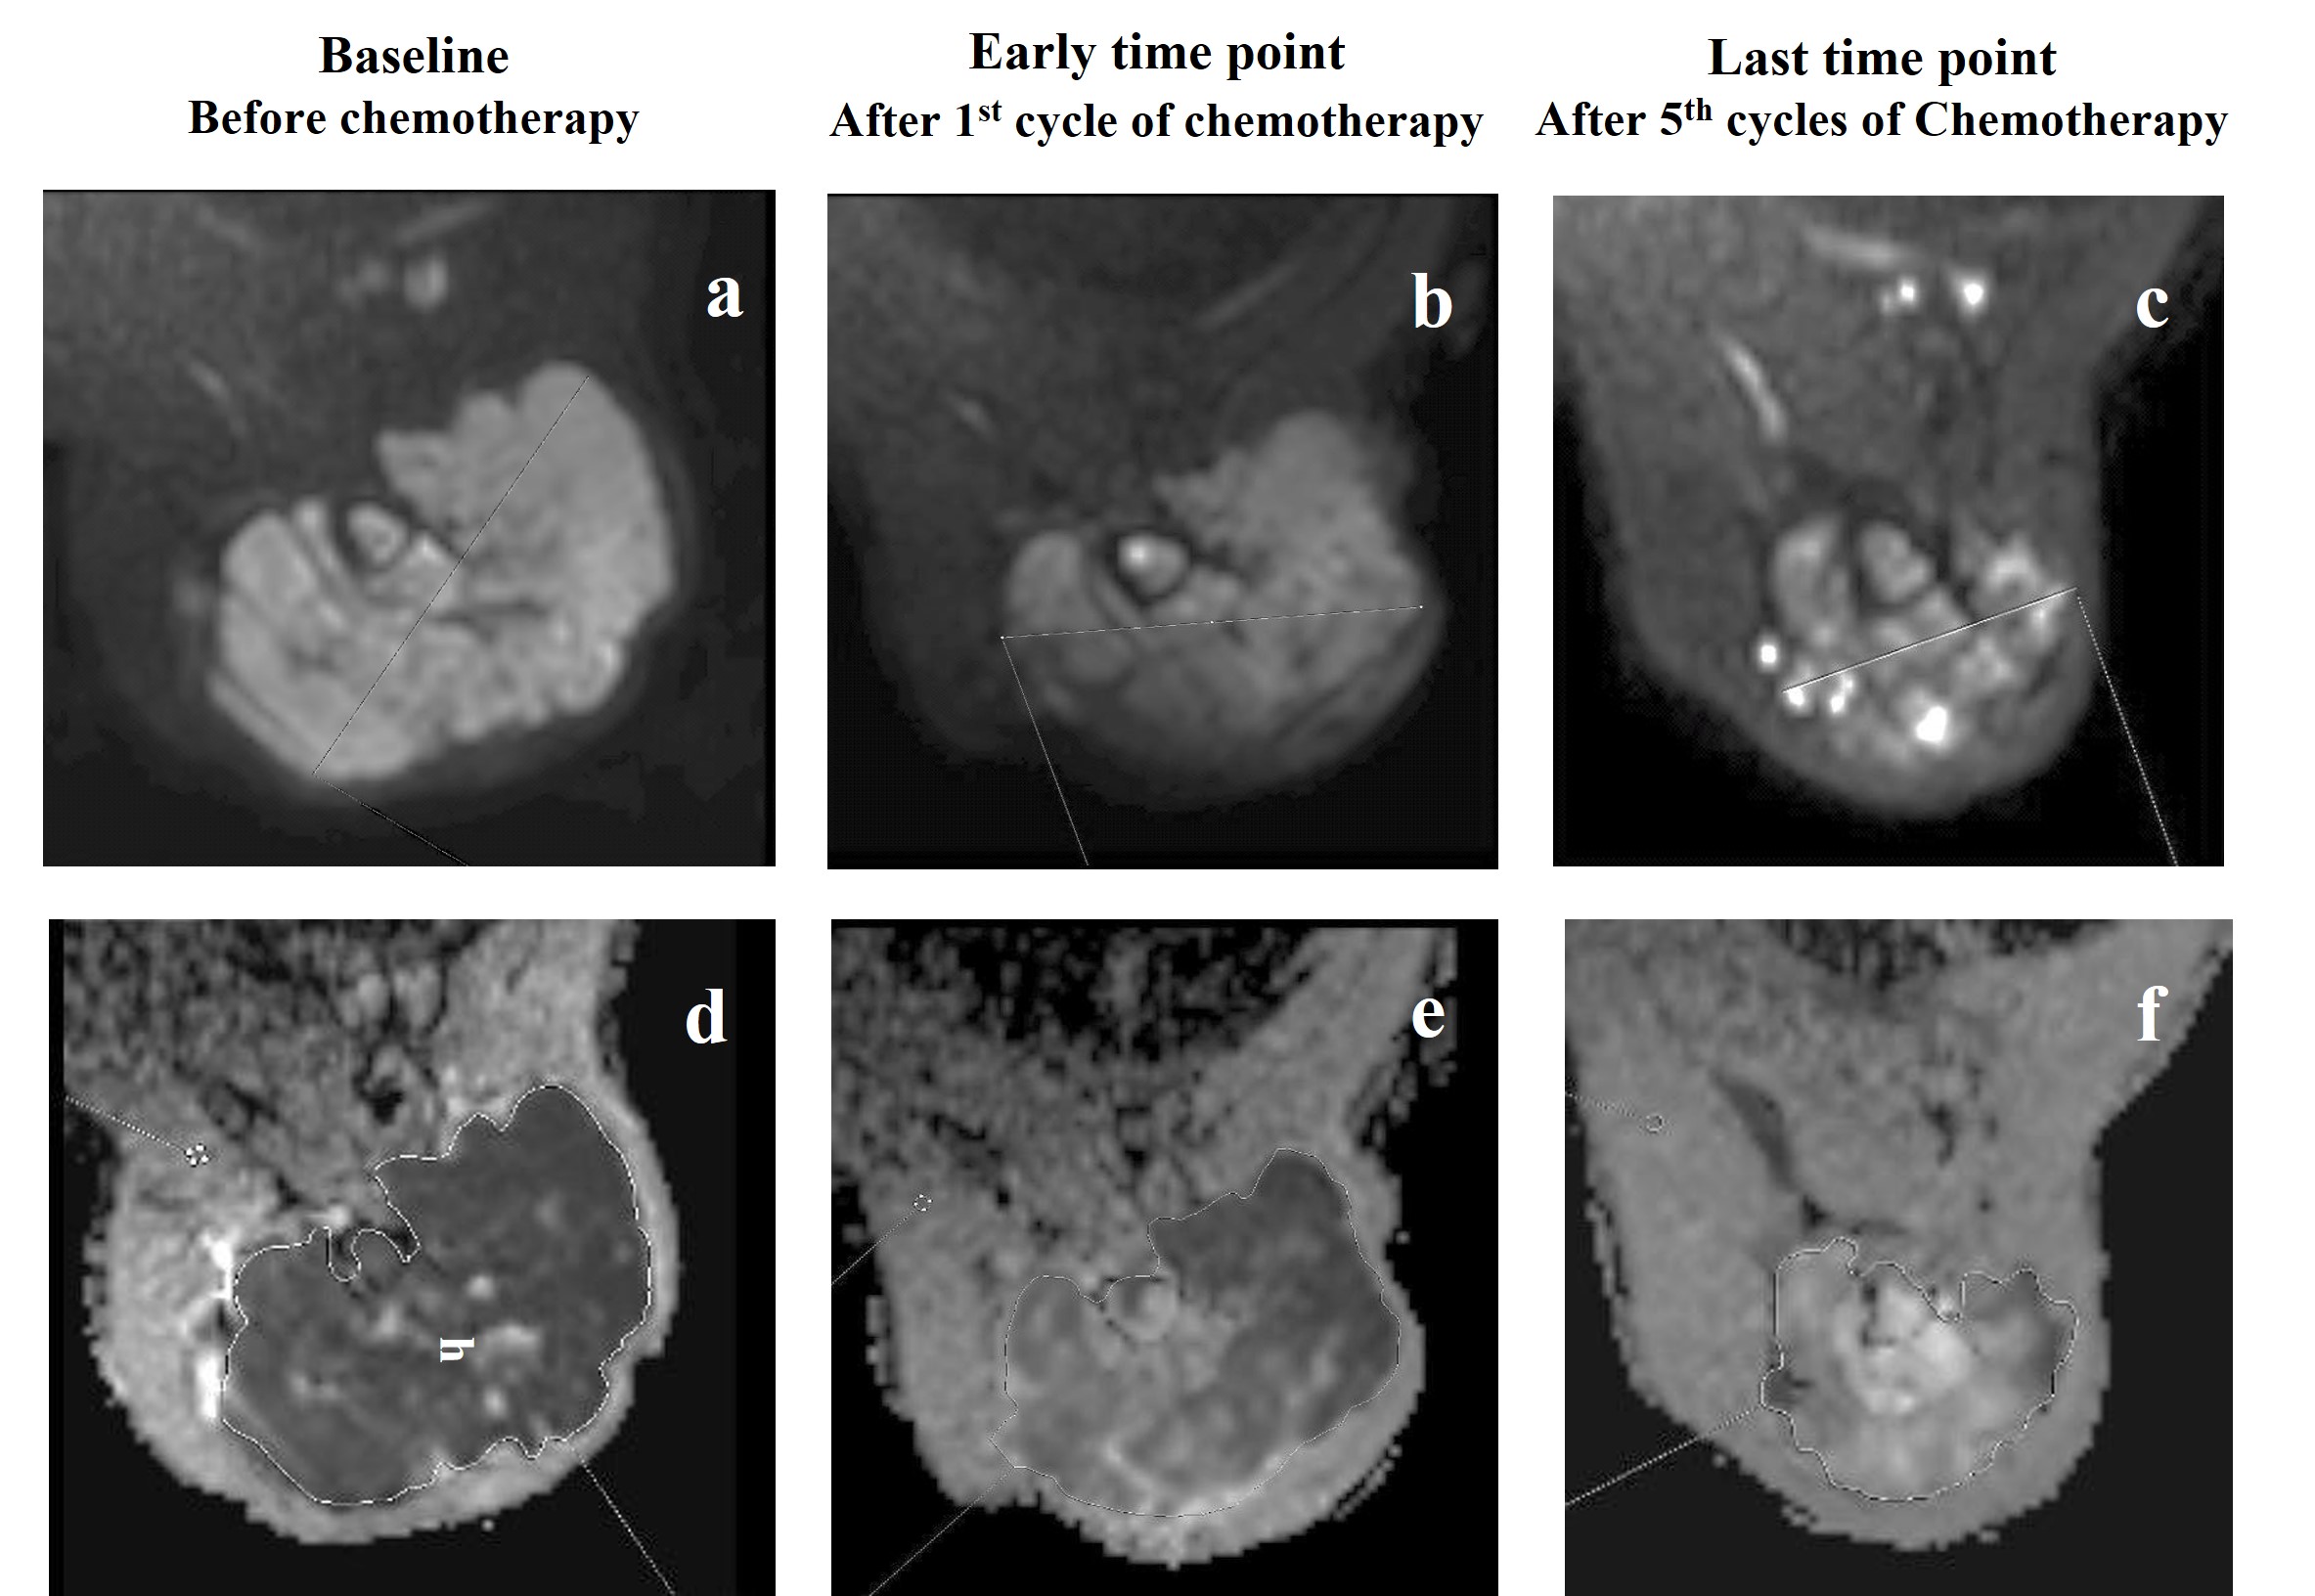
Figure 1: Images from a patient (Male, 22 years) with Ewing sarcoma in left humerus, who was a responder according to gold standard RECIST1.1 criteria. Diffusion weighted images (b=1000 s/mm2) (a,b,c) and corresponding ADC maps (d,e,f) at baseline, early and last time points showing increased diffusion in tumor and significant reduction in size of the primary mass (Partial response) after chemotherapy.
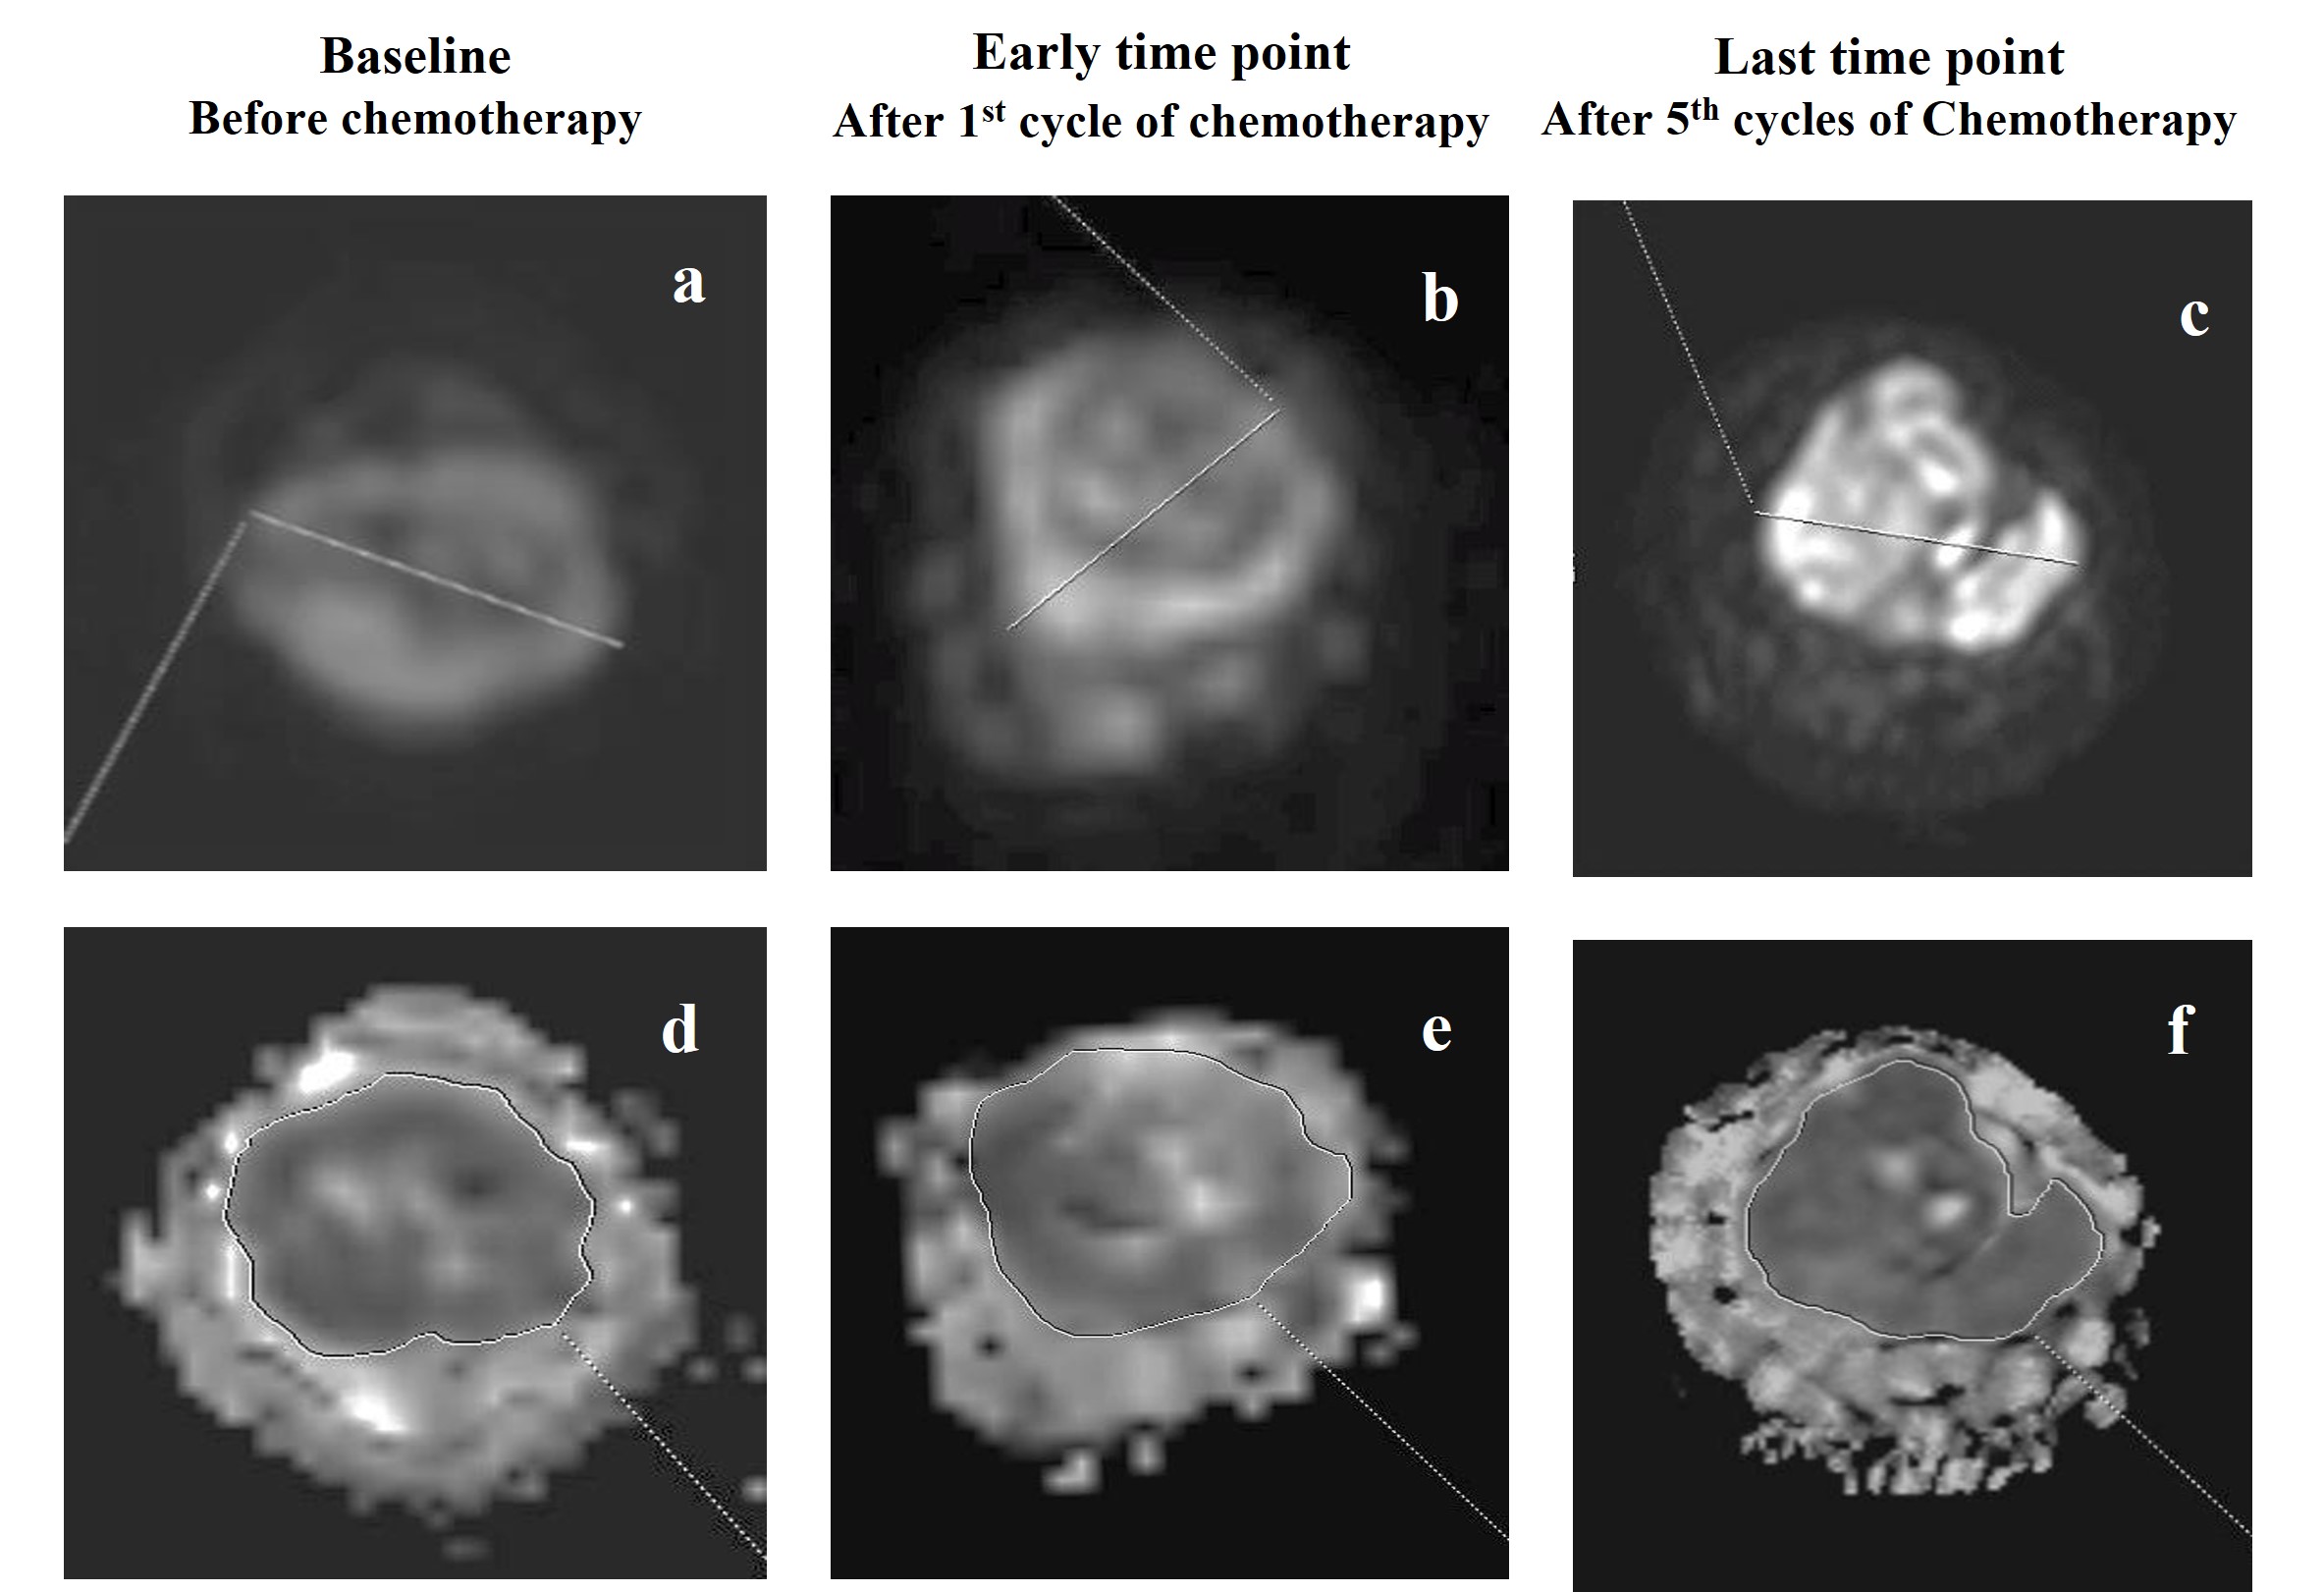
Figure 2: Images from a patient (Female, 13 years) with Ewing sarcoma in right ulna, who was a non-responder according to gold standard RECIST1.1 criteria. Diffusion weighted images (b=1000 s/mm2) (a,b,c) and corresponding ADC maps (d,e,f) at baseline, early and last time points showing no significant changes in diffusion in tumor and size of the primary mass (Stable disease) after chemotherapy.