0407
Deep learning super-resolution of MR images of the distal tibia improves image quality and assessment of bone microstructure1Radiology, University of Pennsylvania, Philadelphia, PA, United States, 2Bioengineering, University of Pennsylvania, Philadelphia, PA, United States
Synopsis
We apply a probabilistic deep learning model to perform image super-resolution on magnetic resonance (MR) images. Our results show that the model is capable of high performance in MR; we upsample low resolution images of the distal tibia to 2x initial spatial resolution–equivalent to capturing 4x fewer samples in K-space–with the goal of reconstructing details in the trabecular architecture. We validate our results by comparing trabecular bone microstructure metrics across high-resolution ground truth, model-reconstructed, and low-resolution input images. By drastically reducing scan time for high-resolution imaging, these methods have the potential to make MRI assessment of bone strength clinically viable.
Introduction
Assessment of the structural integrity of bone is clinically important for predicting risk of fracture. Dual energy absorptiometry (DXA) is the clinical gold-standard for evaluating bone mineral density. However, DXA has a high specificity and low sensitivity (<50%)1. The importance of establishing an effective screening tool for bone fragility cannot be understated - within one year of a hip fracture, 50% of patients cannot walk and 20-30% do not survive2, 3. Recent advances have used finite element analysis of cortical and trabecular bone to accurately assess mechanical competence from MR images4-7.Despite increased accuracy, these methods require high-resolution, long scan-time images, limiting clinical viability. Computational super-resolution presents a potential escape from the resolution–scan time tradeoff. Among deep learning super-resolution methods, convolutional neural networks (CNNs) and generative adversarial networks (GANs) dominate but suffer from a range of well documented drawbacks including texture-smoothing and mode collapse8, 9. We present an alternative probabilistic deep learning approach and investigate the feasibility of its application to super-resolution on undersampled images of the tibia. We evaluate model performance by comparing trabecular bone microstructural parameters across ground truth high-resolution, model, and low-resolution images4,5,7.
Methods
This study uses microstructural MR images of the distal tibia of 90 postmenopausal women (mean age = 65.1 ± 5.7 years) acquired on a 3T scanner (Siemens Tim Trio, Erlangen, Germany) using a 3D spin-echo sequence and 4-channel surface coil at 0.137 mm x 0.137 mm x 0.410 mm voxel size. We perform a bicubic downsample prior to training to obtain a 0.246 mm x 0.246 mm x 0.410 mm voxel size, which we consider ground truth resolution. We further downsample to ½ of ground truth spatial resolution to obtain our low resolution input.We employ a denoising diffusion probabilistic model for image generation. Diffusion probabilistic models have recently garnered attention for their application to image generation and for improvements in image quality10-12. In 2021, Saharia et al. showed excellent results applying denoising diffusion models to image upsampling on general image datasets13. We adapt this class of model to perform super-resolution on low resolution MR images.
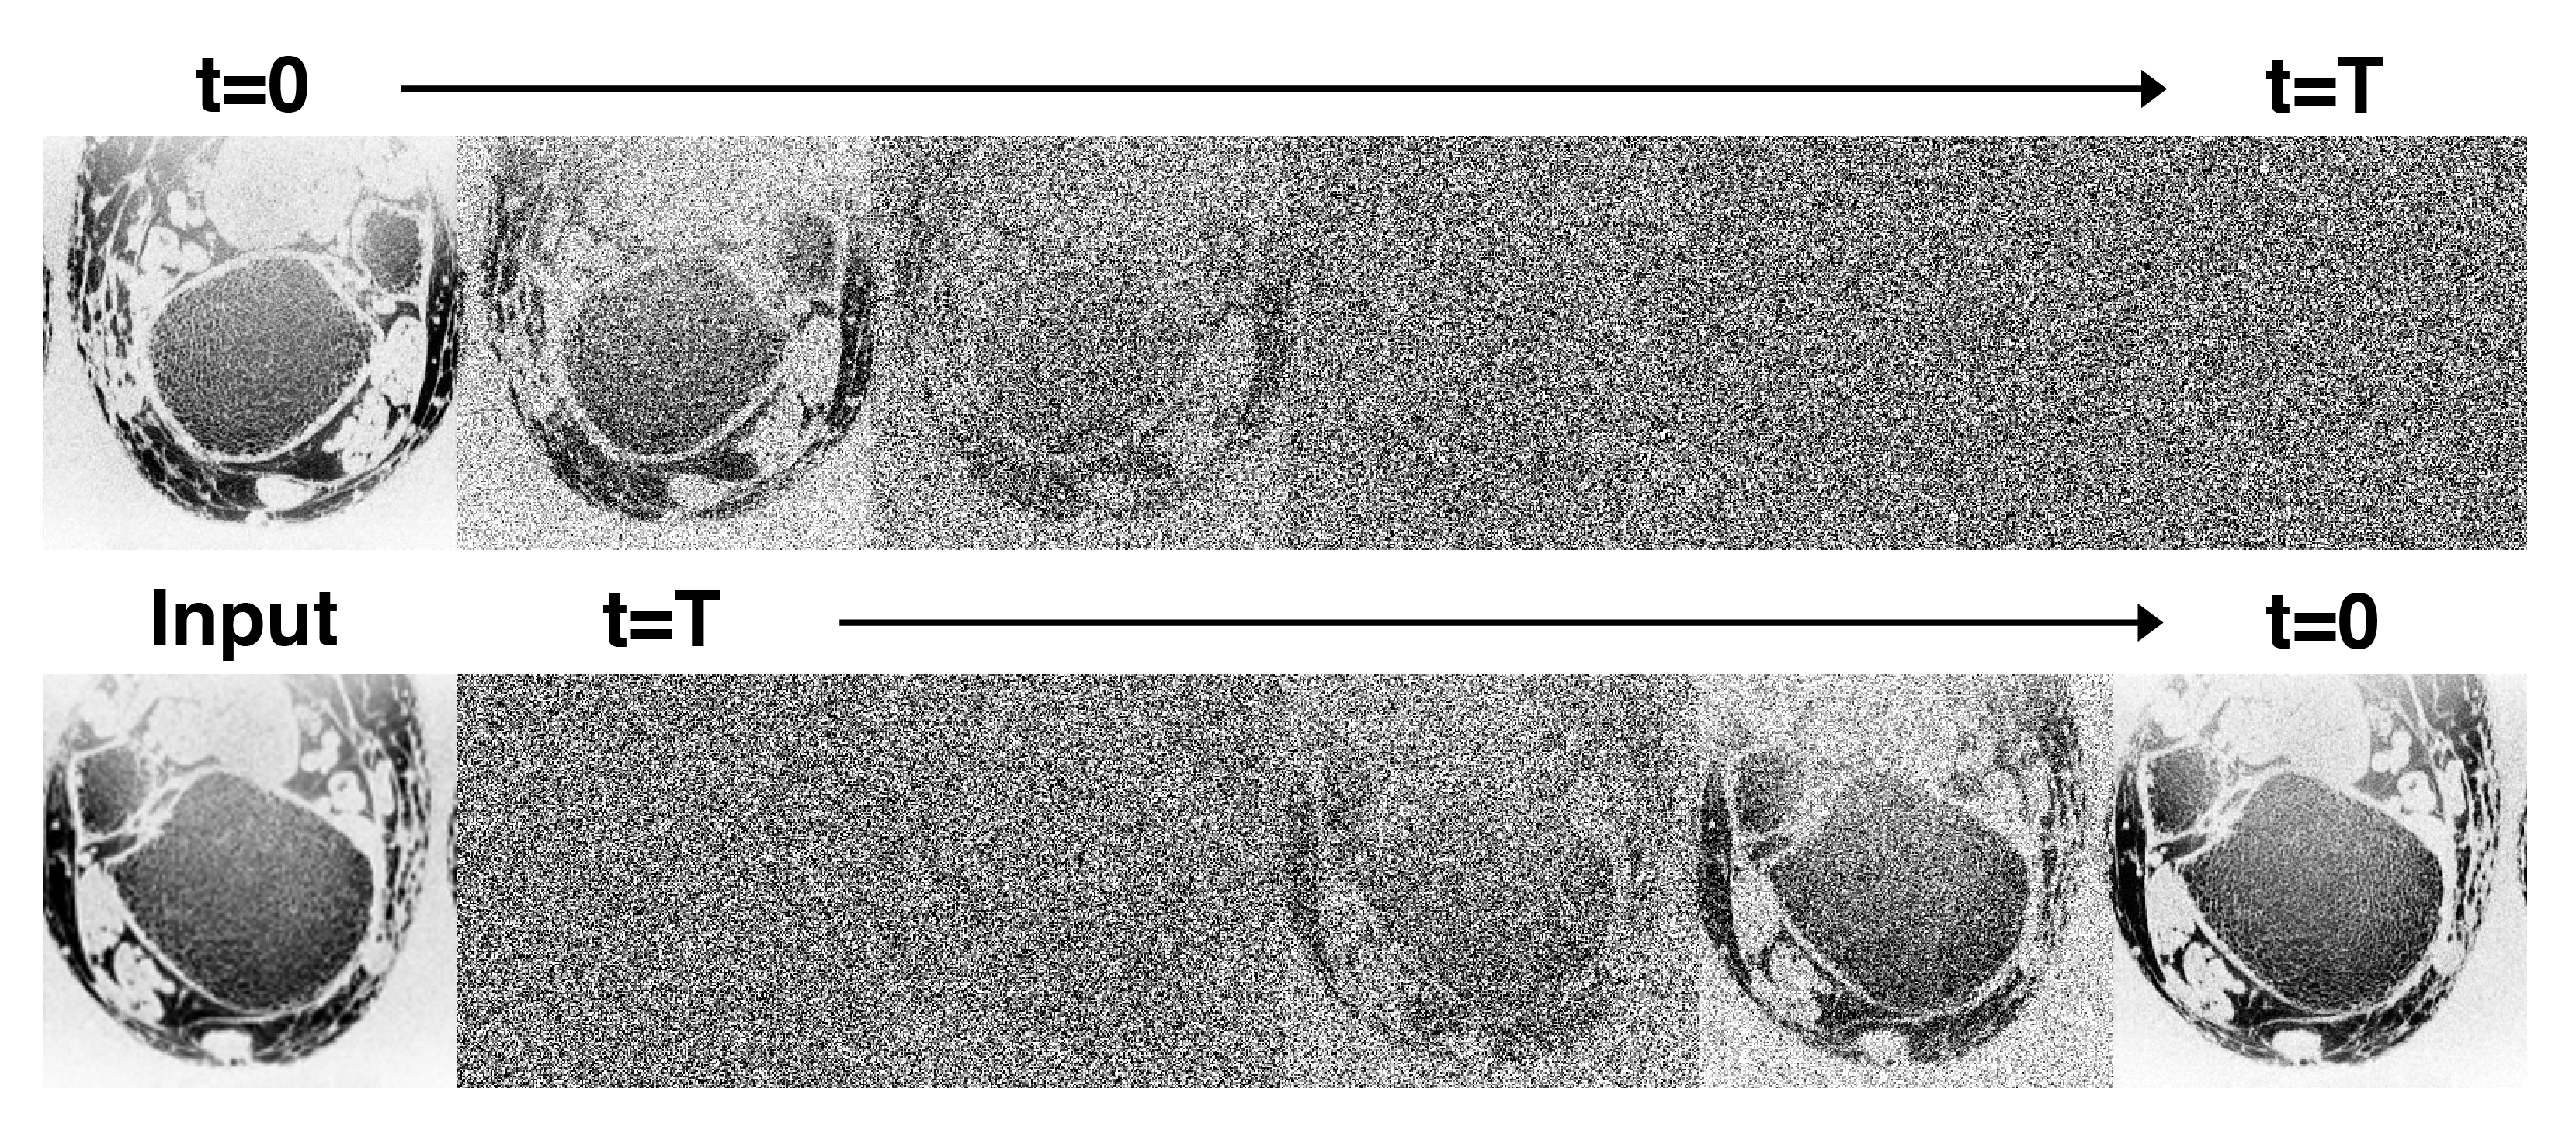
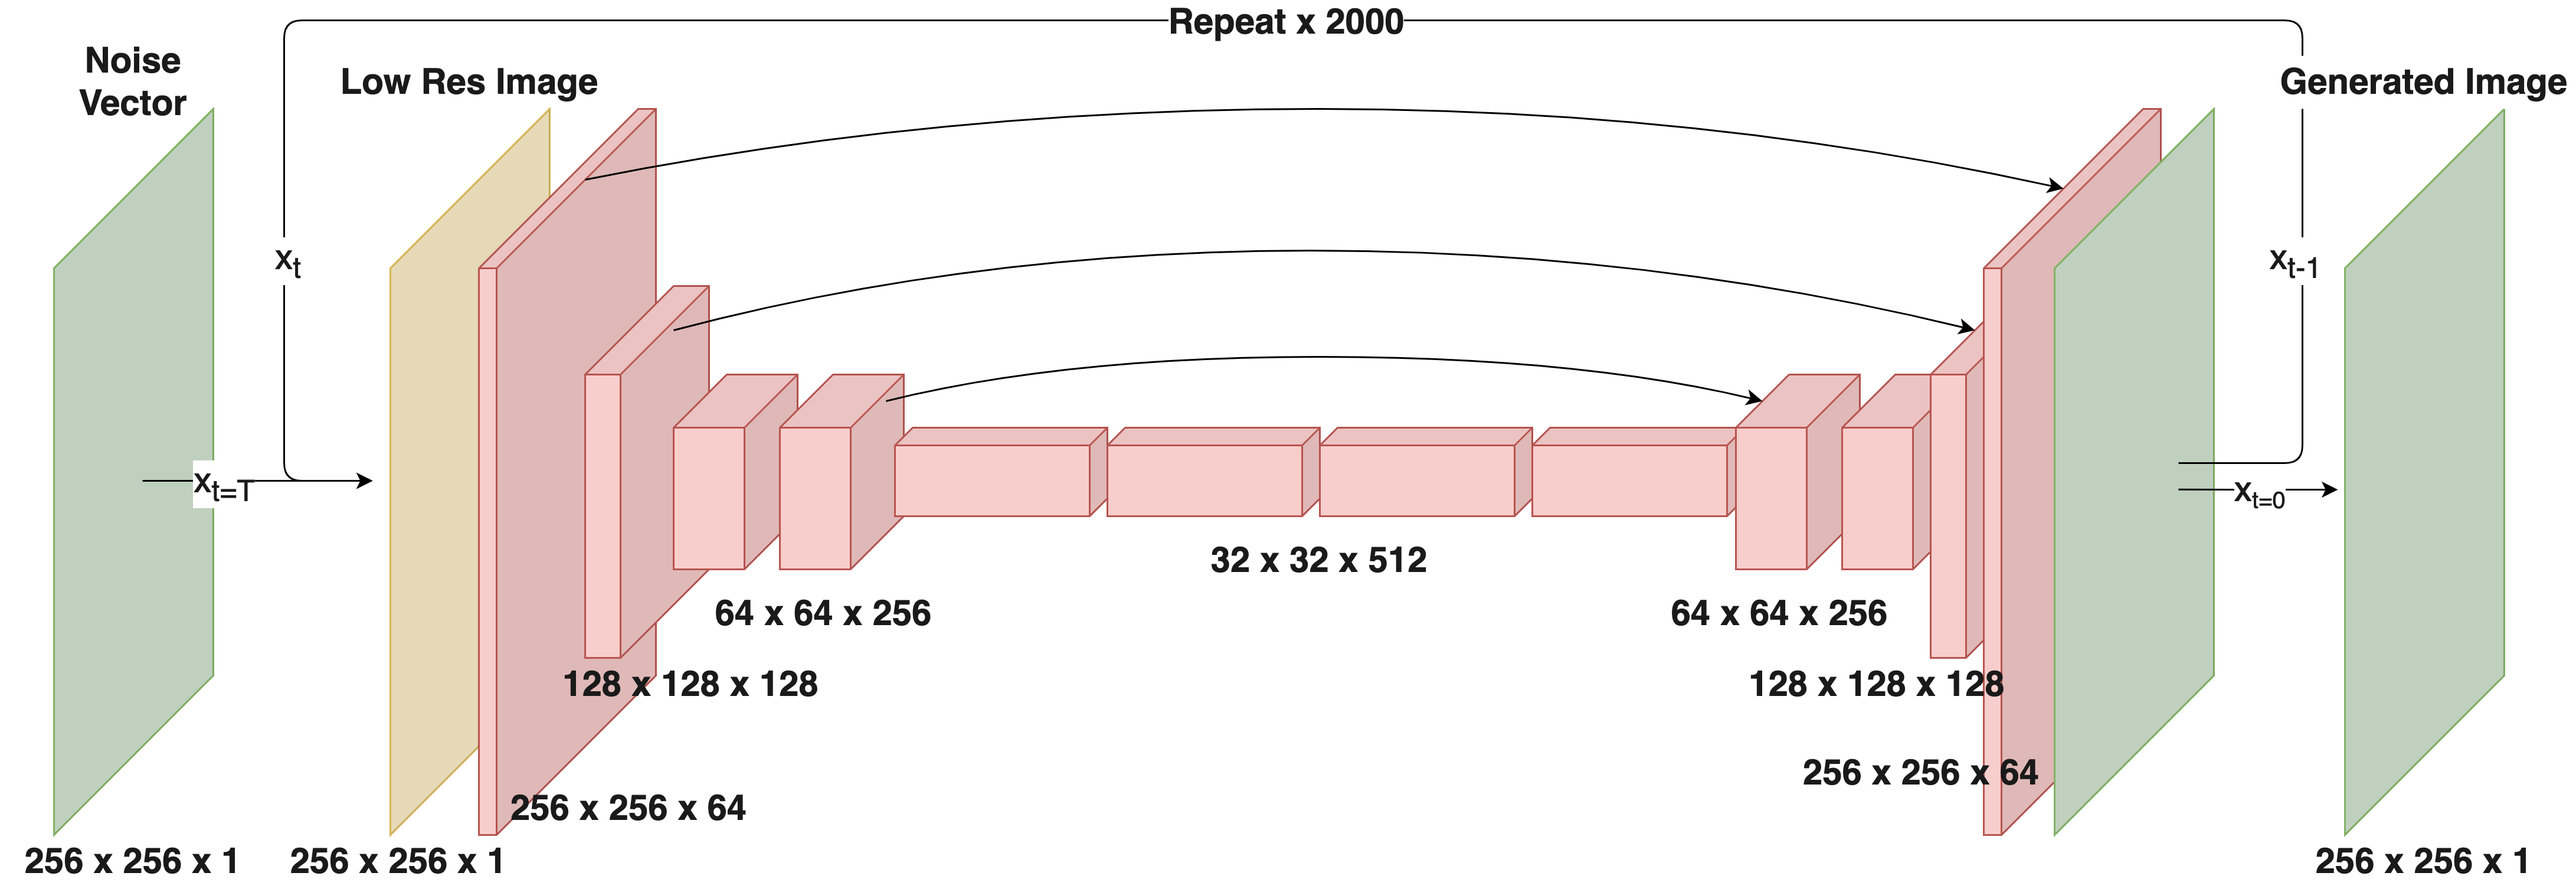
Creation of the diffusion model involves first defining a forward diffusion process of length $$$T$$$. Following Ho et al.10, we define the operation $$$q$$$ as the gradual addition of Gaussian noise to an image $$$x_0$$$:$$ q(x_{1:T}|x_0) := \prod_{t=1}^T q(x_t|x_{t-1}) $$where$$q(x_t|x_{t-1}) := \mathcal{N}(x_t;x_{t-1}\sqrt{1-\beta_t},\beta_t I)$$and $$$\beta_t$$$ is a parameter that controls noise variance and is defined from $$$0<t\leq T$$$. $$$T$$$ and $$$\beta$$$ are chosen such that $$$x_T$$$ is essentially complete Gaussian noise. Also note that $$$x_0$$$ is the original denoised image (Fig 1 top). Here, our goal is to learn a process $$$p_\theta$$$ that reverses the diffusion process $$$q$$$. As with the iterative process $$$q$$$, $$$p_\theta$$$ is broken into $$$T$$$ steps:$$ p_\theta(x_{0:T}) := p(x_T) \prod_{t=1}^T p_\theta(x_{t-1}|x_t) $$where$$ p_\theta(x_{t-1}|x_t) := \mathcal{N}(x_{t-1}; \mu_\theta(x_t, t), \sigma_\theta(x_t,t))$$A single step of this process $$$p_\theta(x_{t-1}|x_t)$$$ is modeled using a deep neural network (Fig 1 bottom). We adapt the SR3 architecture13 to model the process $$$p_\theta$$$. This model consists of a U-net encoder-decoder with a resnet backbone trained to remove a small, set amount of noise from an image. By repeating this process $$$T$$$ times ($$$T=2000$$$), and optionally adding a low-resolution image $$$y$$$ as model conditional information ($$$p_\theta(x_{t-1}|x_t, y)$$$) we can achieve both unconditional image generation and conditional image super-resolution (Fig 2).
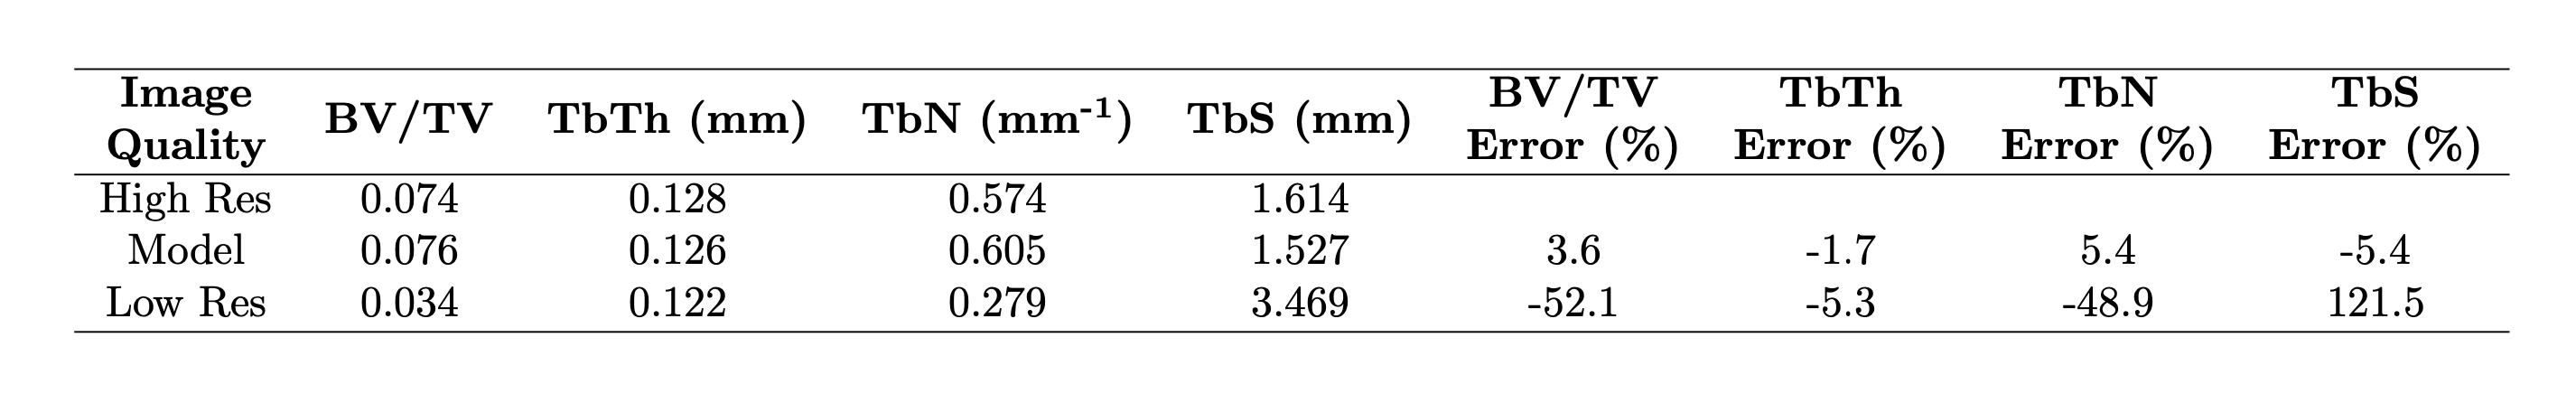
We additionally quantify the trabecular bone volume fraction (BV/TV), trabecular thickness (TbTh), trabecular number (TbN), and trabecular spacing (TbS) of one subject for three image types: high-resolution, model-reconstructed, and low-resolution images. We compute BV/TV and TbTh using a fuzzy distance transform algorithm and derive TbN and TbS following Saha et al.14, 15.
Results
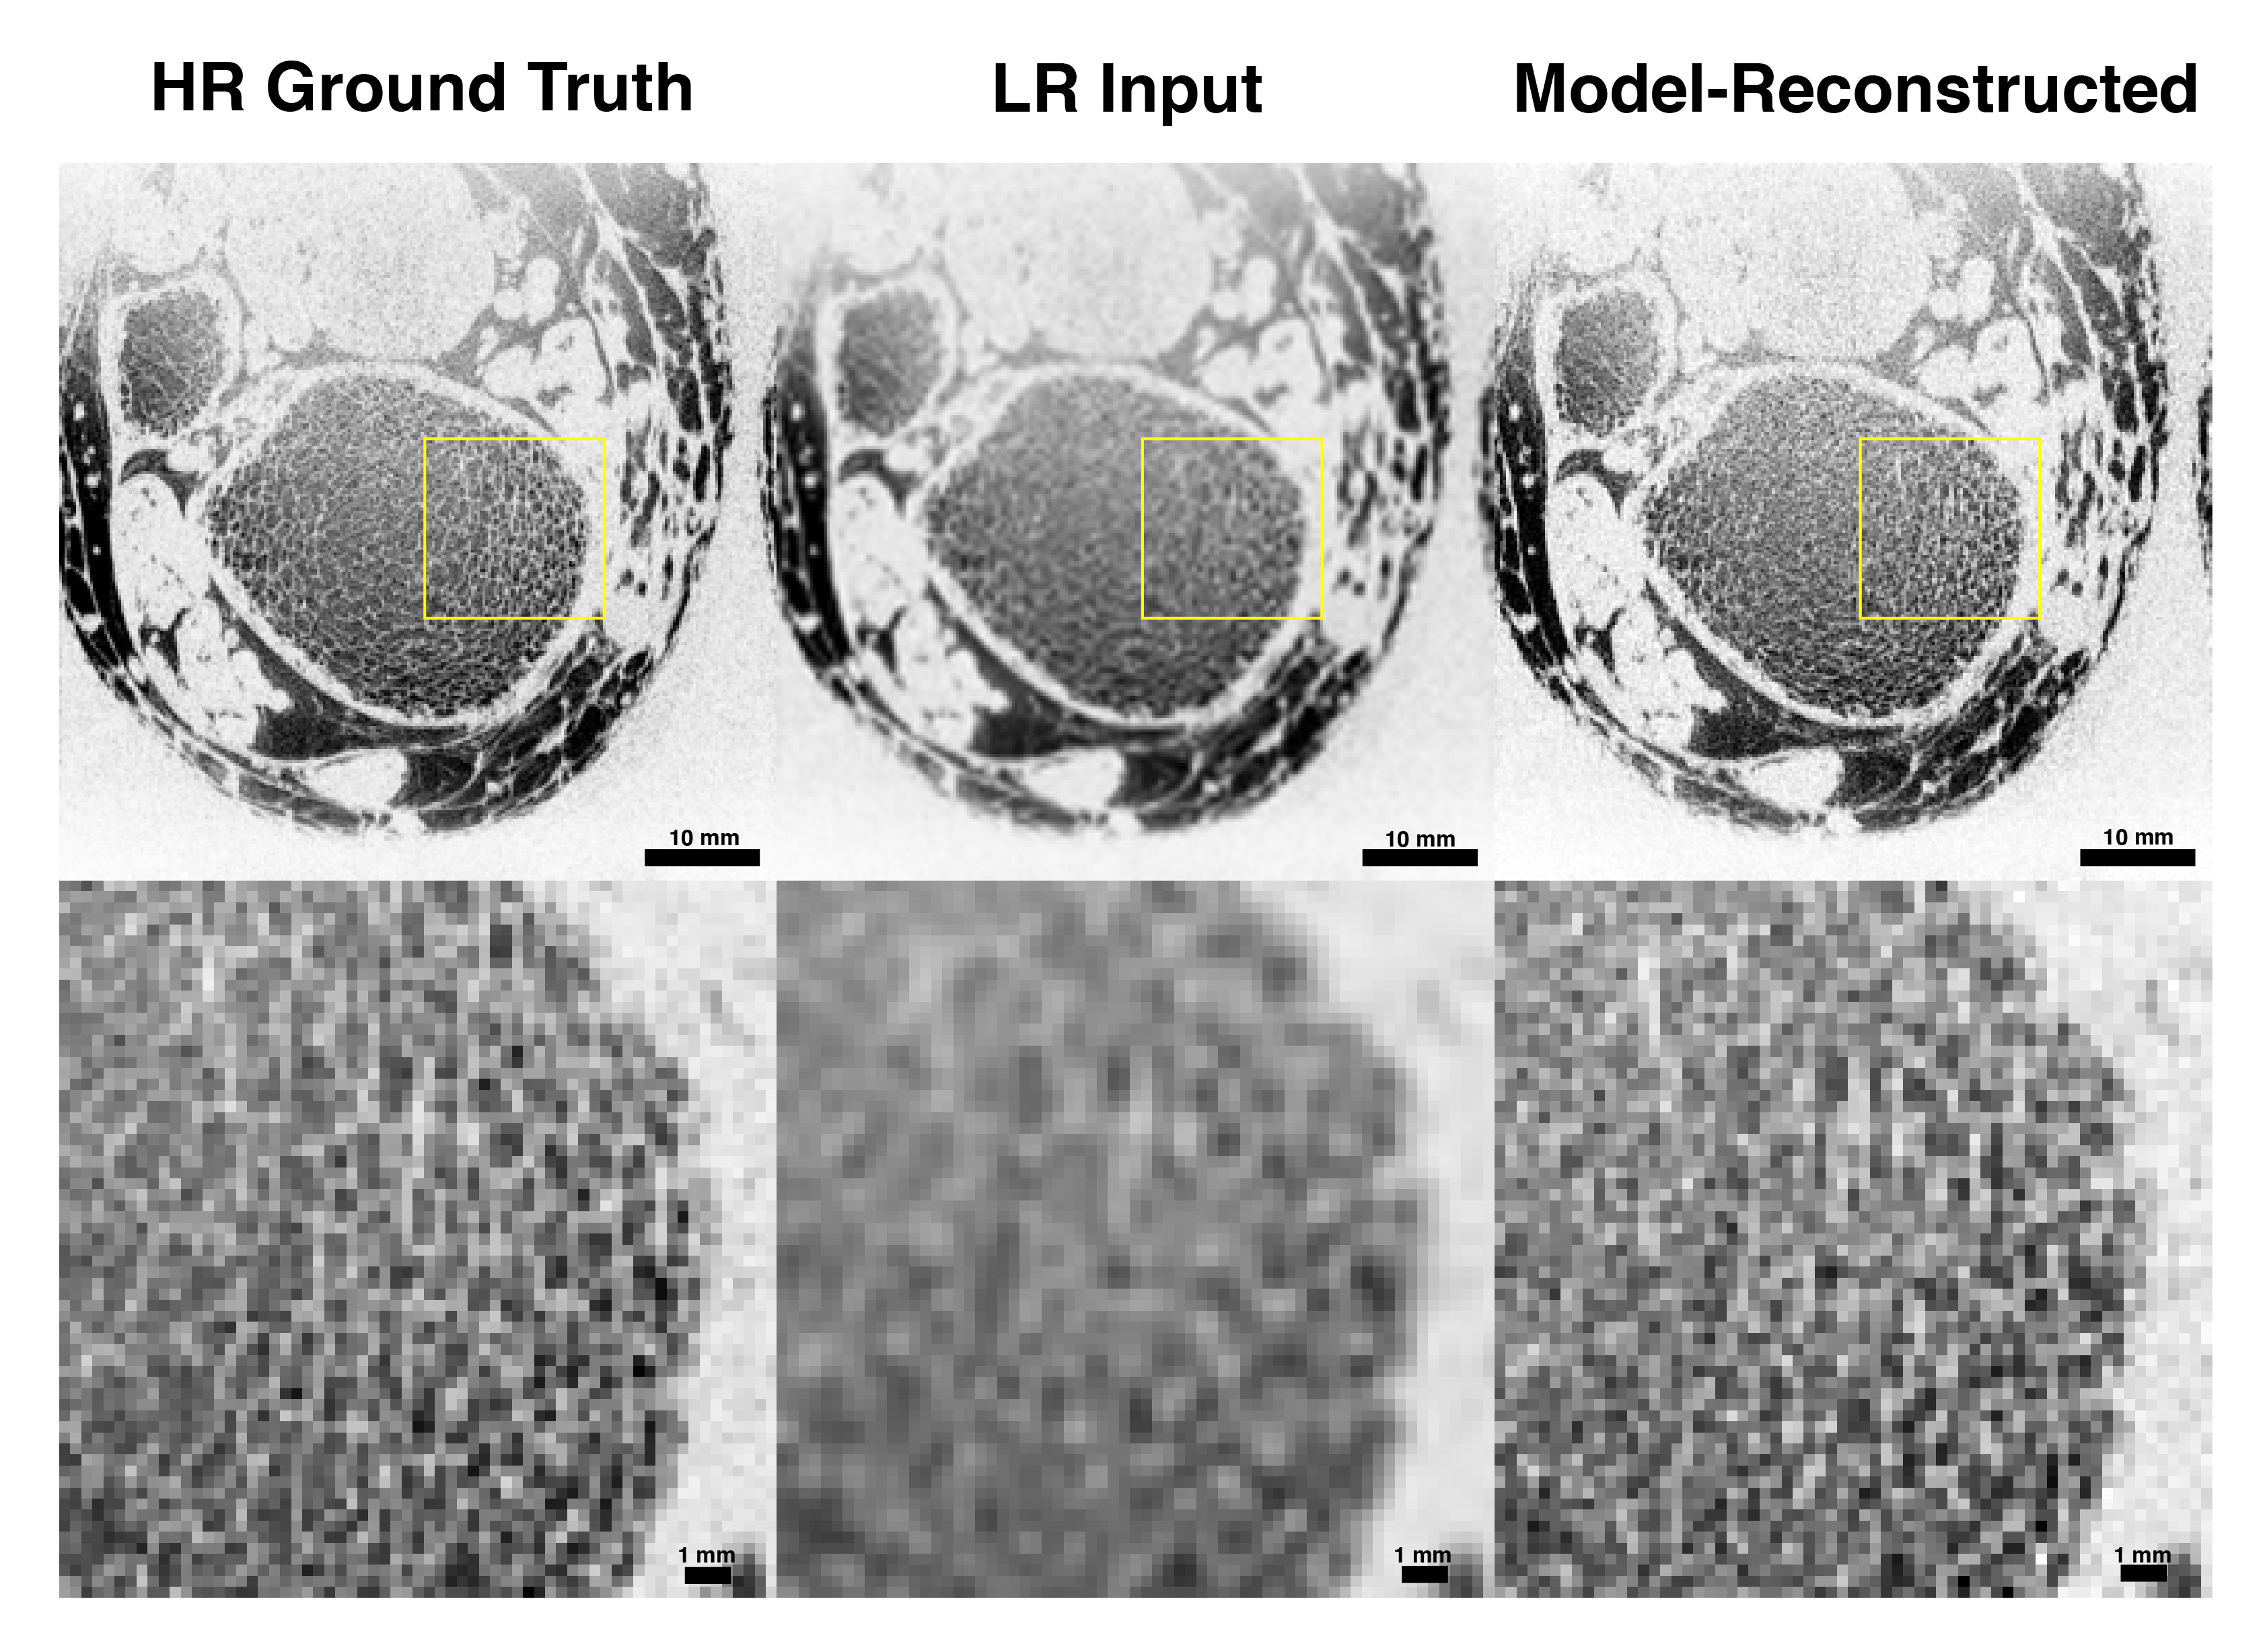
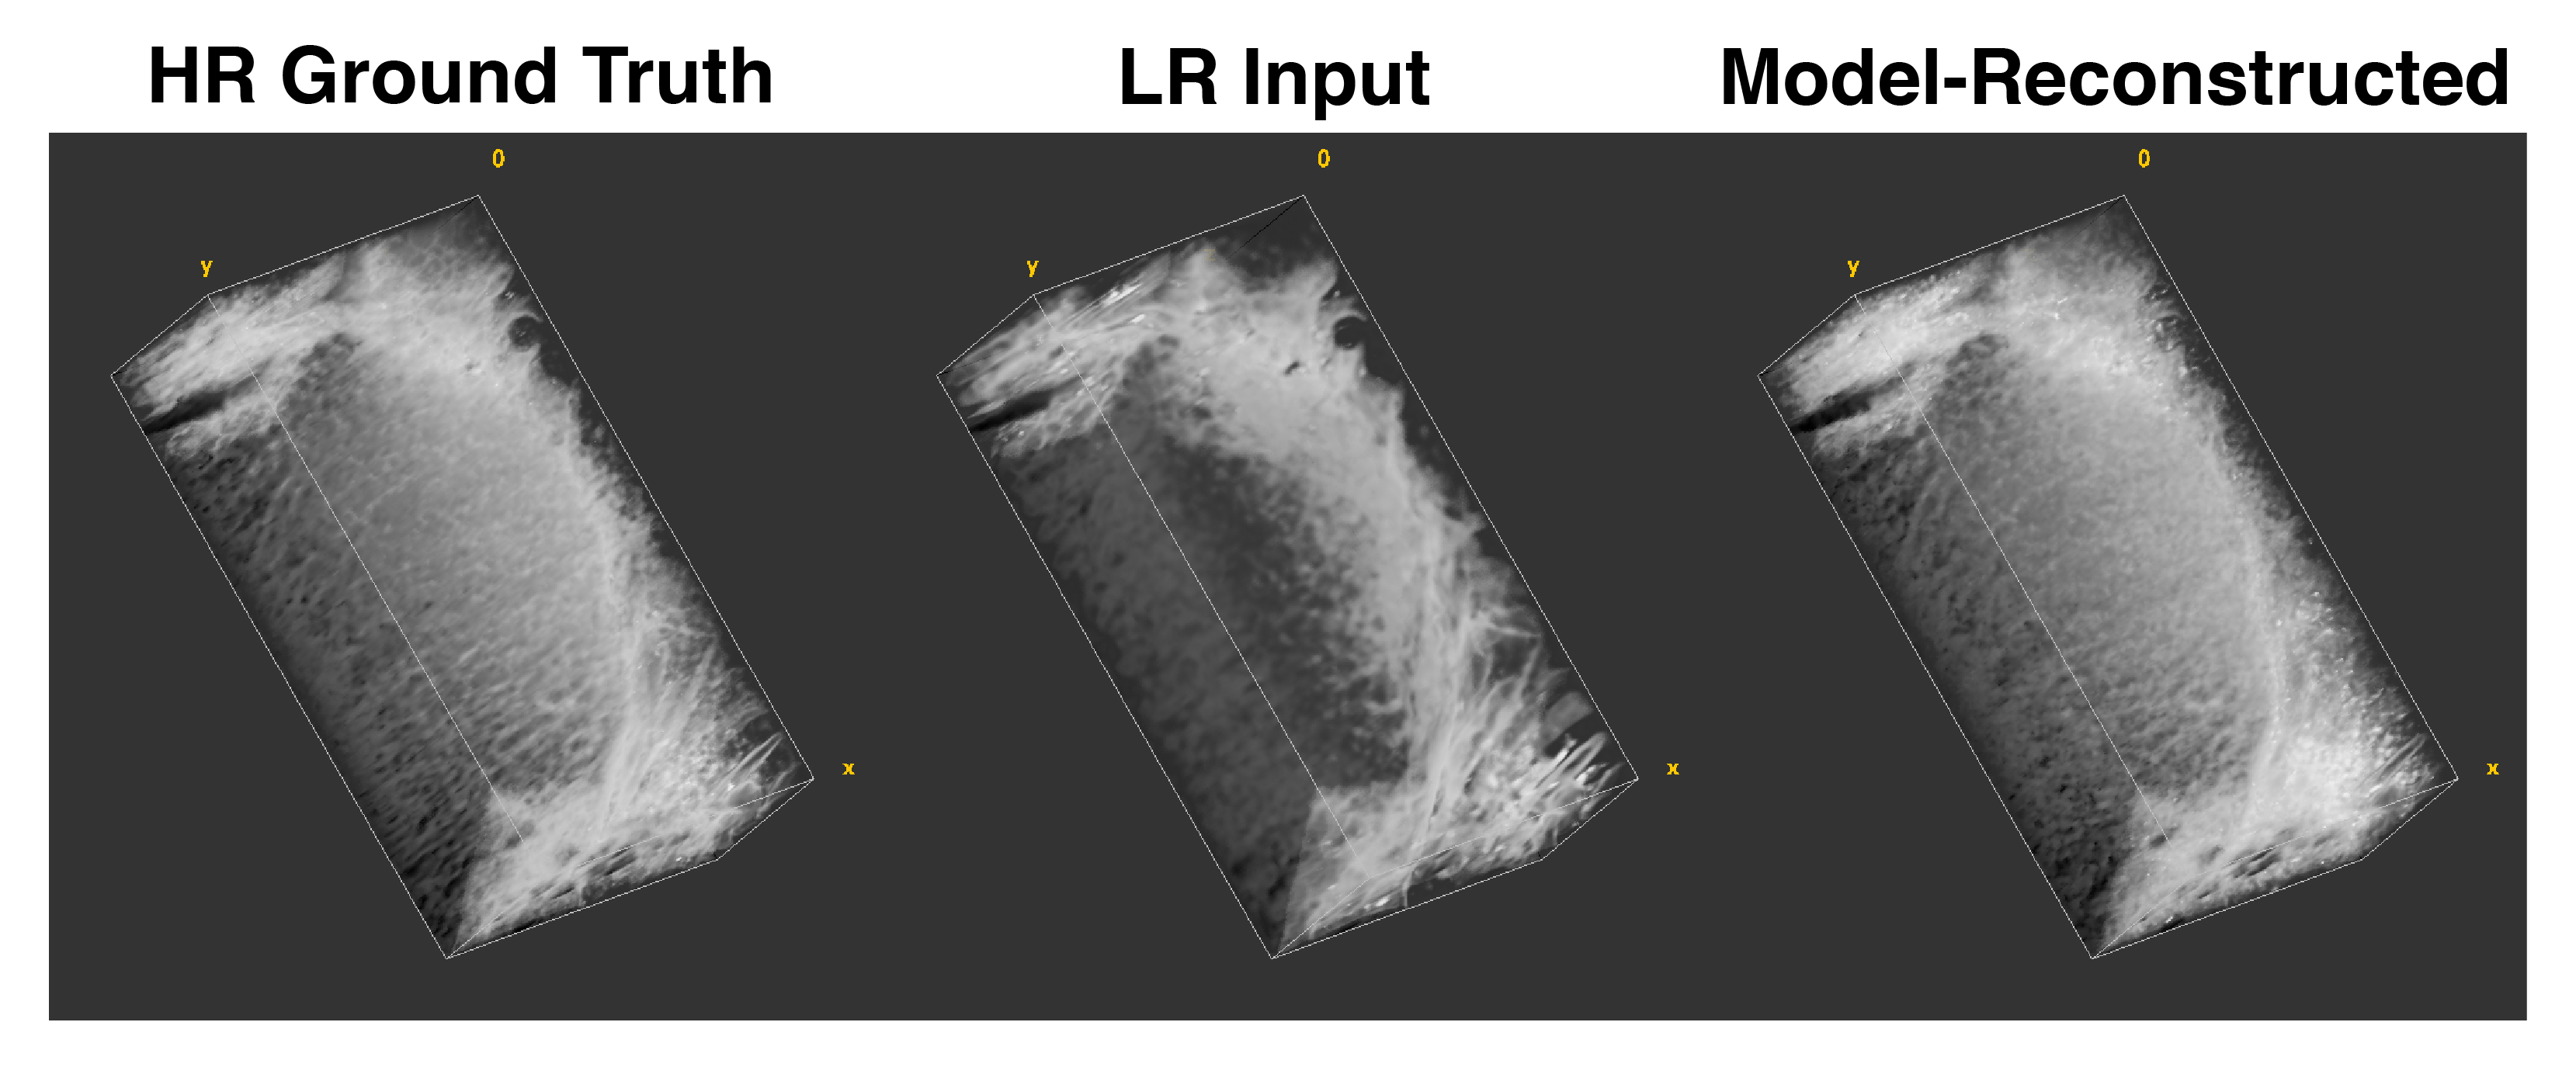
We evaluated model performance visually and quantitatively with a set of trabecular bone microstructural parameters, defined above. Figure 3 and Figure 4 compare high-resolution, model-reconstructed, and low-resolution images in 2D and 3D. Considering the high-resolution images as ground truth, we found a drastic reduction in error for model-reconstructed outputs compared to the low-resolution inputs across all metrics (Table 1).Discussion
We achieve promising results using a probabilistic deep learning model for MR super-resolution on undersampled tibia images. We evaluate reconstruction quality using four metrics of trabecular bone microstructure, which collectively serve as an indicator of bone strength. According to these measurements, the model-reconstructed images more closely match the ground truth images than do the low-resolution input images, indicating substantial improvement (Table 1).This model, like other data-driven models, is susceptible to bias introduced in the selection of training data. In order to assess the clinical value of these methods, future research must consider large, representative datasets comprising healthy and pathological images. Additionally, we perform our analysis in the image domain and not on raw frequency data. Future work will investigate the effect of alternate downsampling functions (i.e. a box filter imposed in the frequency domain), alternate noising functions (particularly Rician) and performing upsampling in the frequency domain on performance. Nevertheless, our results show promise for faithfully recovering the fine trabecular architecture from low-resolution scans. These findings suggest that computationally upsampled high-resolution MR images are a clinically viable method for the assessment of bone strength.
Acknowledgements
Use of the data in this research application has been approved by Internal Review Board. This work is funded by the following grants: NIH R01 AR076392, R01 AR068382, T32 EB009384, T32 EB020087. The authors have no conflicts of interest to declare. This research has not been and is not currently being considered for publication elsewhere.References
1. Marshall, D., O. Johnell, and H. Wedel, Meta-analysis of how well measures of bone mineral density predict occurrence of osteoporotic fractures. Bmj, 1996. 312(7041): p. 1254-9.
2. Brauer, C.A., M. Coca-Perraillon, D.M. Cutler, and A.B. Rosen, Incidence and mortality of hip fractures in the United States. Jama, 2009. 302(14): p. 1573-9.
3. Magaziner, J., L. Fredman, W. Hawkes, J.R. Hebel, S. Zimmerman, D.L. Orwig, and L. Wehren, Changes in functional status attributable to hip fracture: a comparison of hip fracture patients to community-dwelling aged. Am J Epidemiol, 2003. 157(11): p. 1023-31.
4. Krug, R., S. Banerjee, E.T. Han, D.C. Newitt, T.M. Link, and S. Majumdar, Feasibility of in vivo structural analysis of high-resolution magnetic resonance images of the proximal femur. Osteoporos Int, 2005. 16(11): p. 1307-14.
5. Han, M., K. Chiba, S. Banerjee, J. Carballido-Gamio, and R. Krug, Variable flip angle three-dimensional fast spin-echo sequence combined with outer volume suppression for imaging trabecular bone structure of the proximal femur. Journal of magnetic resonance imaging : JMRI, 2015. 41(5): p. 1300-1310.
6. Rajapakse, C.S., A. Hotca, B.T. Newman, A. Ramme, S. Vira, E.A. Kobe, R. Miller, S. Honig, and G. Chang, Patient-specific Hip Fracture Strength Assessment with Microstructural MR Imaging-based Finite Element Modeling. Radiology, 2017. 283(3): p. 854-861.
7. Rajapakse, C.S., A.R. Farid, D.C. Kargilis, B.C. Jones, J.S. Lee, A.J. Johncola, A.S. Batzdorf, S.S. Shetye, M.W. Hast, and G. Chang, MRI-based assessment of proximal femur strength compared to mechanical testing. Bone, 2020. 133: p. 115227.
8. Bau, D., J.Y. Zhu, J. Wulff, W. Peebles, H. Strobelt, B. Zhou, A. Torralba, Seeing What a GAN Cannot Generate. Proceedings of the IEEE/CVF International Conference on Computer Vision (ICCV), 2019. p. 4502-4511
9. Wang, X., K. Yu, C. Dong, C. C. Loy, Recovering Realistic Texture in Image Super-Resolution by Deep Spatial Feature Transform. Proceedings of the IEEE Conference on Computer Vision and Pattern Recognition (CVPR), 2018. p. 606-615
10. Ho J, Jain A, Abbeel P. Denoising diffusion probabilistic models. arXiv preprint arXiv:2006.11239. 2020
11. Nichol A, Dhariwal P. Improved denoising diffusion probabilistic models. arXiv preprint arXiv:2102.09672. 2021
12. Dhariwal P, Nichol A. Diffusion models beat gans on image synthesis. arXiv preprint arXiv:2105.05233. 2021
13. Saharia C, Ho J, Chan W, Salimans T, Fleet DJ, Norouzi M. Image super-resolution via iterative refinement. arXiv preprint arXiv:2104.07636. 2021
14. Saha PK, Wehrli FW. Measurement of trabecular bone thickness in the limited resolution regime of in vivo MRI by fuzzy distance transform. IEEE transactions on medical imaging. 2004 Jan 7;23(1):53-62.
15. Rajapakse CS, Leonard MB, Kobe EA, Slinger MA, Borges KA, Billig E, Rubin CT, Wehrli FW. The efficacy of low-intensity vibration to improve bone health in patients with end-stage renal disease is highly dependent on compliance and muscle response. Academic radiology. 2017 Nov 1;24(11):1332-42.
Figures