0406
Exploratory study of relationships between [18F] Sodium fluoride PET metabolic bone measures and MRI bone porosity index in the tibial tuberosity1Radiology, Stanford University, Stanford, CA, United States, 2Department of Clinical Physiology, Nuclear Medicine and PET, Rigshospitalet, Copenhagen University Hospital, Copenhagen, Denmark, 3Bioengineering, Stanford University, Stanford, CA, United States
Synopsis
Molecular information derived from dynamic [18F]NaF PET imaging holds promise to study bone remodeling in bone and joint disorders. The porosity index (PI), based on ultra-short echo-time (uTE) MRI, has been proposed to study bone porosity in clinically valuable acquisition times. We explored the association between bone metabolic and porosity information in the tibial tuberosity in a cohort of 10 subjects with knee OA using hybrid PET-MRI imaging. We found a moderate negative correlation between the metabolic bone remodeling (Ki) and the porosity index. These promising results may highlight a new tool to unveil unknown pathways in musculoskeletal disease pathophysiology.
Introduction
The semi-quantitative standardized uptake volume (SUV) and the quantitative total rate of fluoride clearance from plasma to the bone matrix (Ki) derived from [18F]sodium fluoride ([18F]NaF) positron emission tomography (PET) imaging have shown promise to study bone remodeling in bone and joint disorders1,2,3,4.With the development of ultra-short echo time (uTE) sequences, MRI may investigate cortical bone porosity in vivo by differentiating the fast-decaying signal coming from the water bound to collagen and the long-decaying signal coming from free water within pores5,6. Although absolute porosity evaluation remains currently clinically infeasible due to long scan times, the porosity index (PI) has been proposed as a proxy measure to study bone porosity in clinically viable acquisition times7,8,9.
Combining molecular and bone microstructural information may provide a unique methodology for studying, in vivo, how bone remodeling affects bone microstructure. This preliminary study explores the association between metabolic and porosity bone information in the tibial tuberosity (TT), an area of high loading stresses, in a cohort of subjects with knee OA using a hybrid PET-MRI system.
Methods
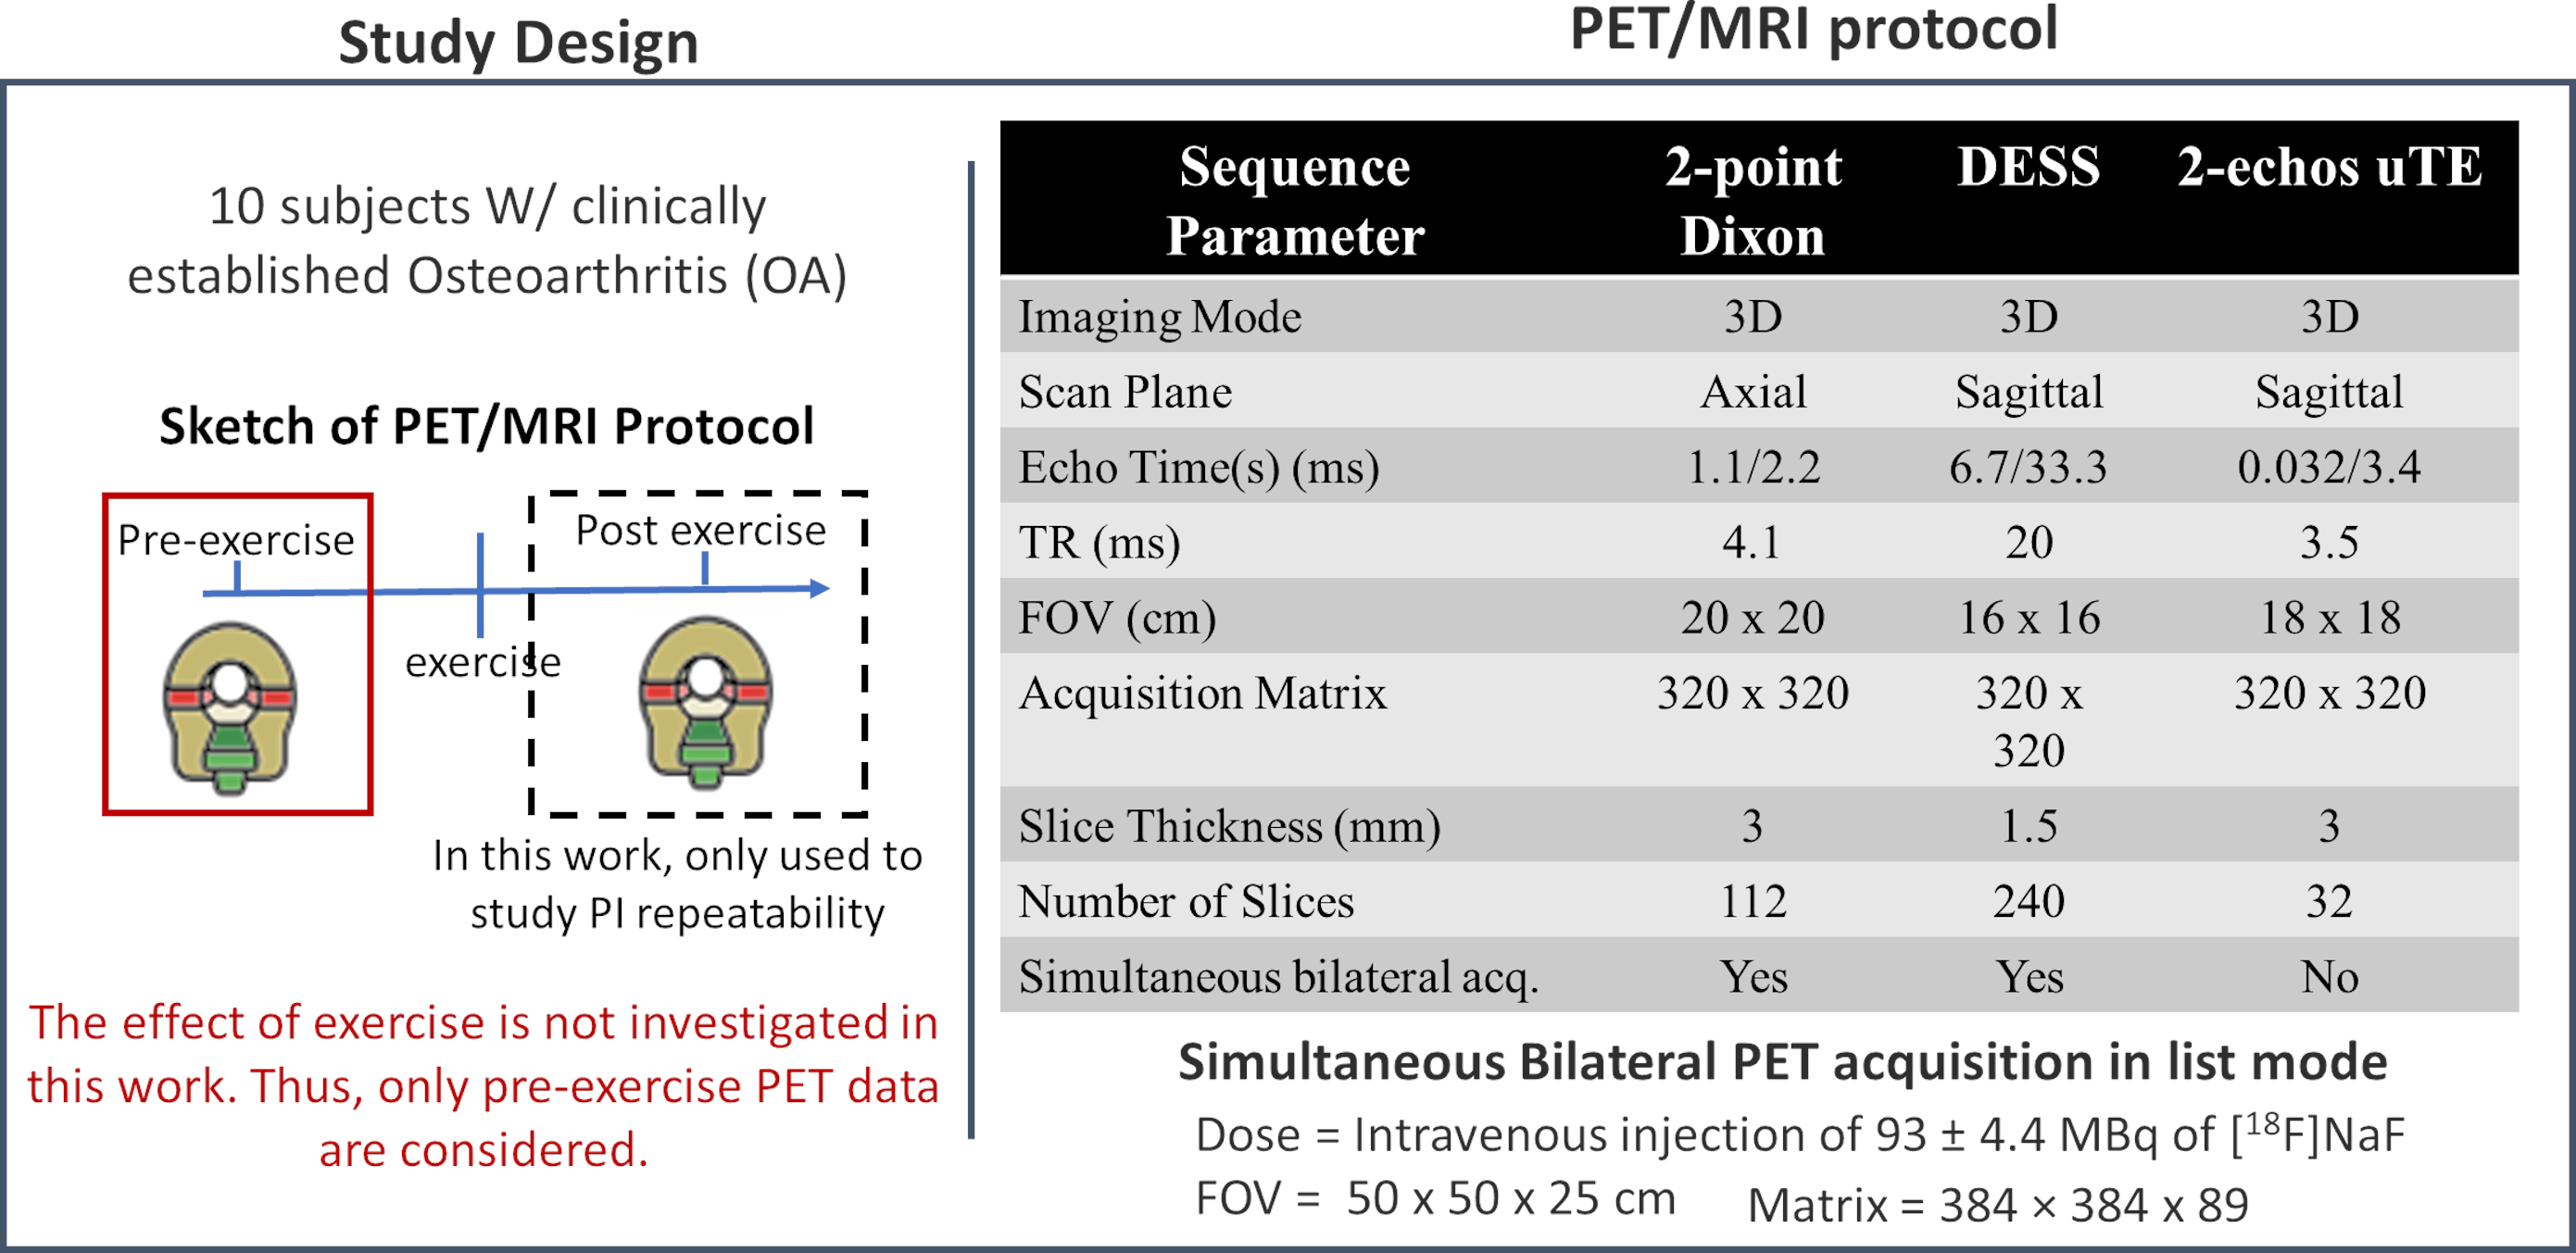
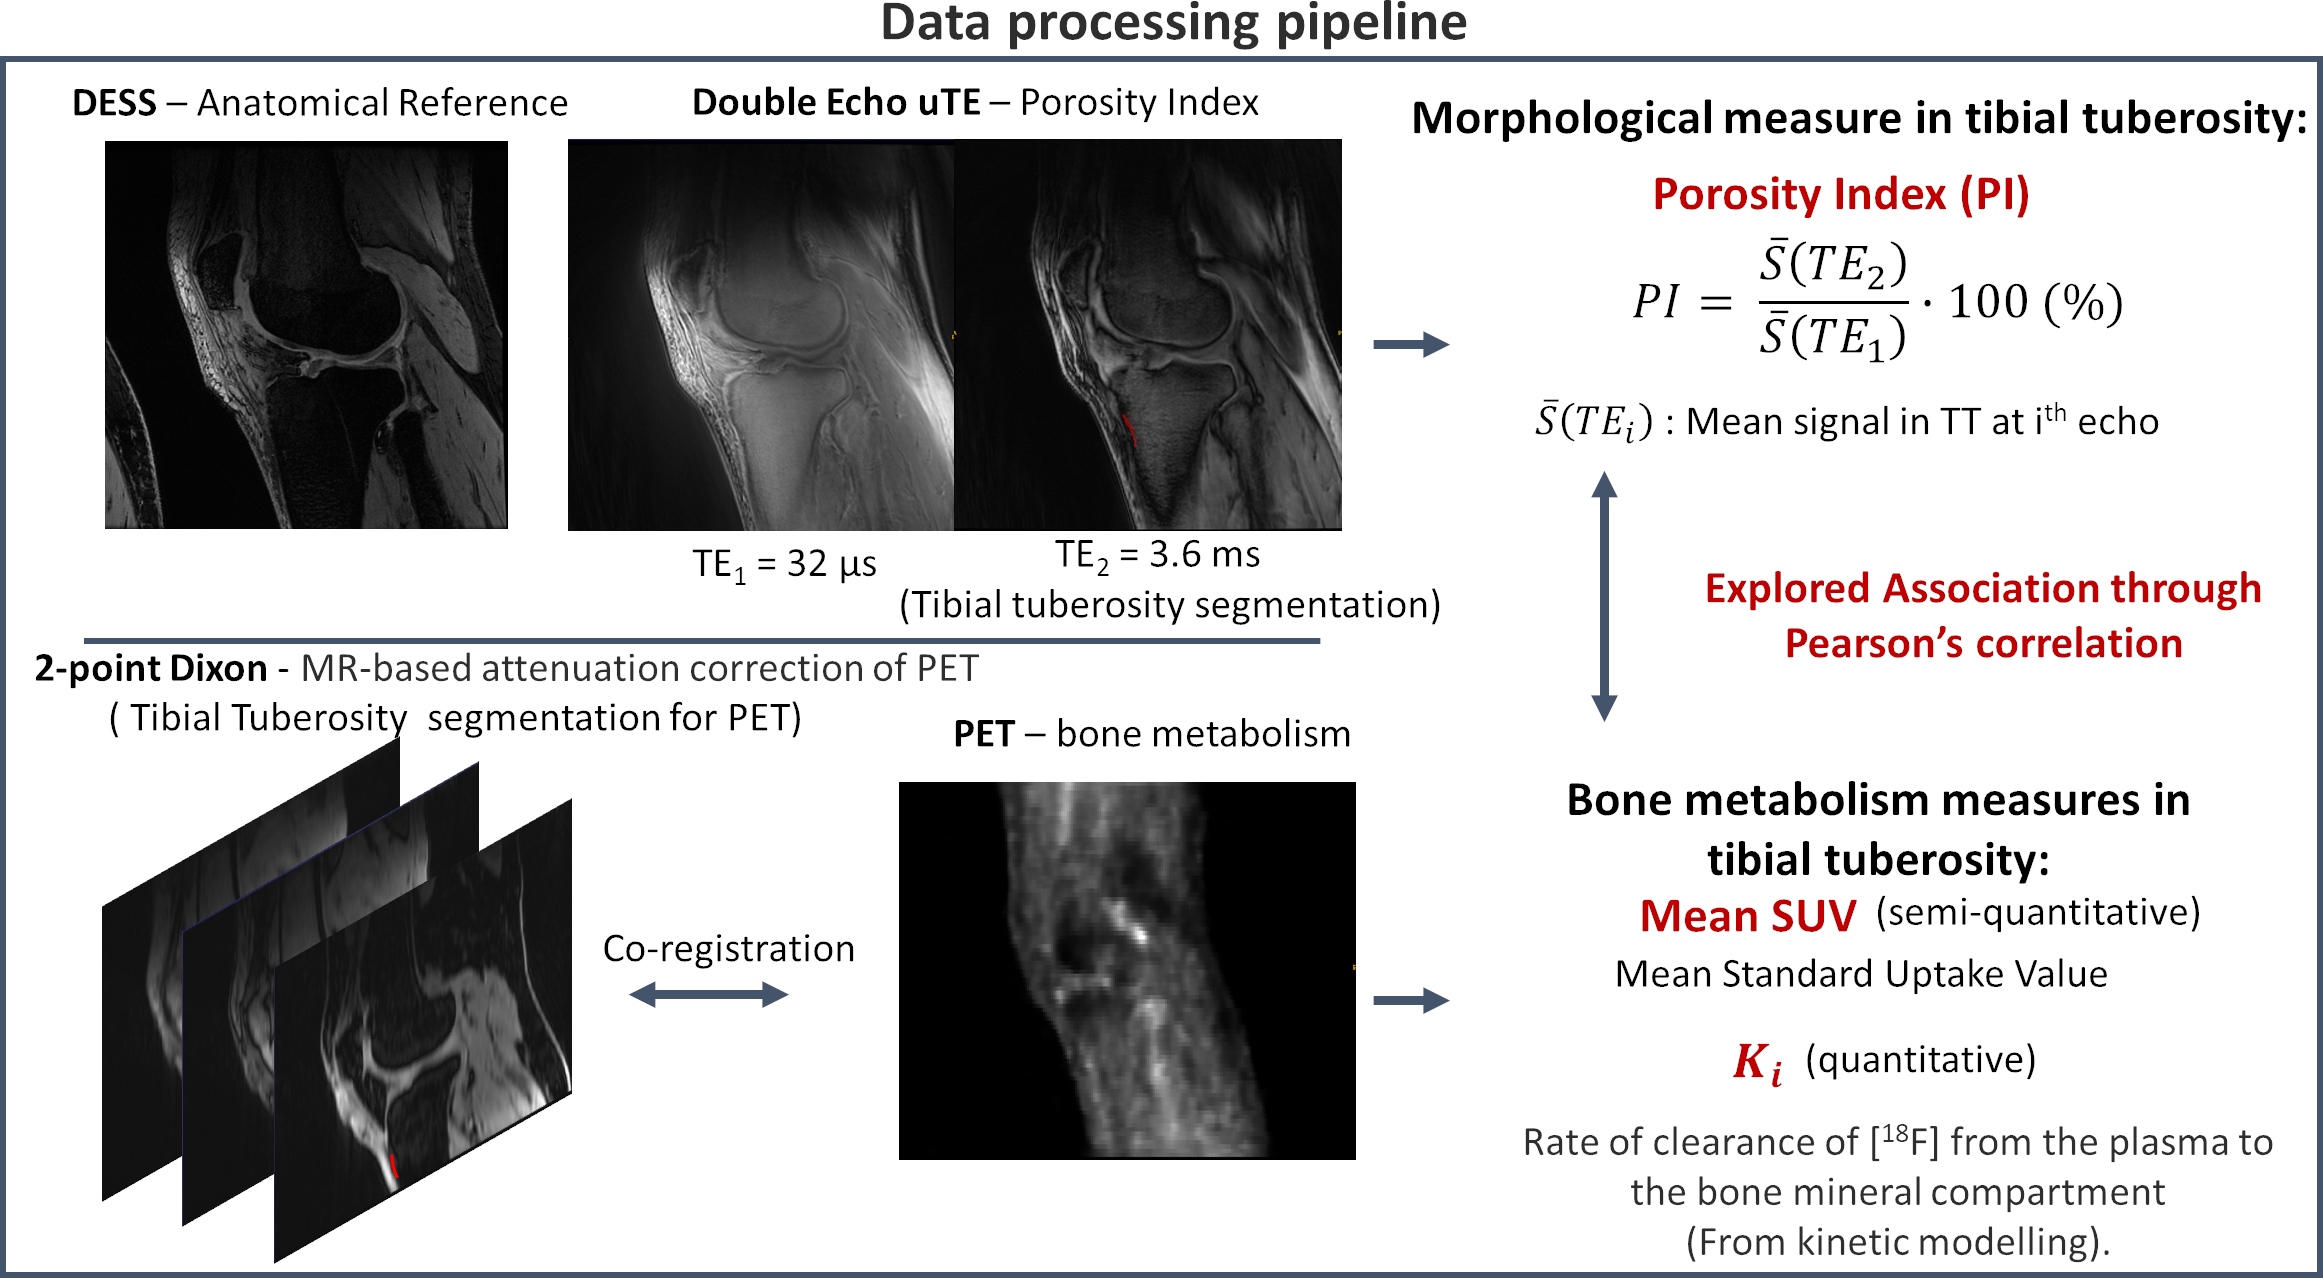
Both knees of ten subjects with clinically established OA were scanned, pre- and post-exercise, using a 3T whole-body time-of-flight hybrid PET/MRI system (GE SIGNA, GE Healthcare, Milwaukee WI) with two 16-channel flexible phased-array coils (NeoCoil, Pewaukee WI). MR imaging was performed simultaneously with PET acquisition. It included a double-echo-in-steady-state (DESS) sequence for anatomical reference, a 2-point Dixon fat/water sequence for MR-based attenuation correction for PET data, and a 2-echo uTE for porosity index estimation. Fig. 1 summarizes the parameters used for the acquisition.PET image frames were reconstructed from acquired list-mode data using a time-of-flight reconstruction. With reference to Fig. 2, the TT regions were segmented using water-only and fat-only Dixon images co-registered to PET. The mean SUV was calculated from the last frame of the dynamic PET acquisition, and Ki was evaluated using two-compartment kinetic modeling10,11. Since the work does not investigate the effect of exercise, only pre-exercise PET data were considered.
For PI evaluation, TT was directly segmented using the second echo of uTE images. The average first and second echo intensities within the TT (\(\overline{S}(TE_{1})\) and \(\overline{S}(TE_{2})\)) were used to compute PI according to equation 1.
\[PI = \frac{\overline{S}(TE_{2})}{\overline{S}(TE_{1})}\cdot100\:(\%) \:\:\:\:\:(1)\]
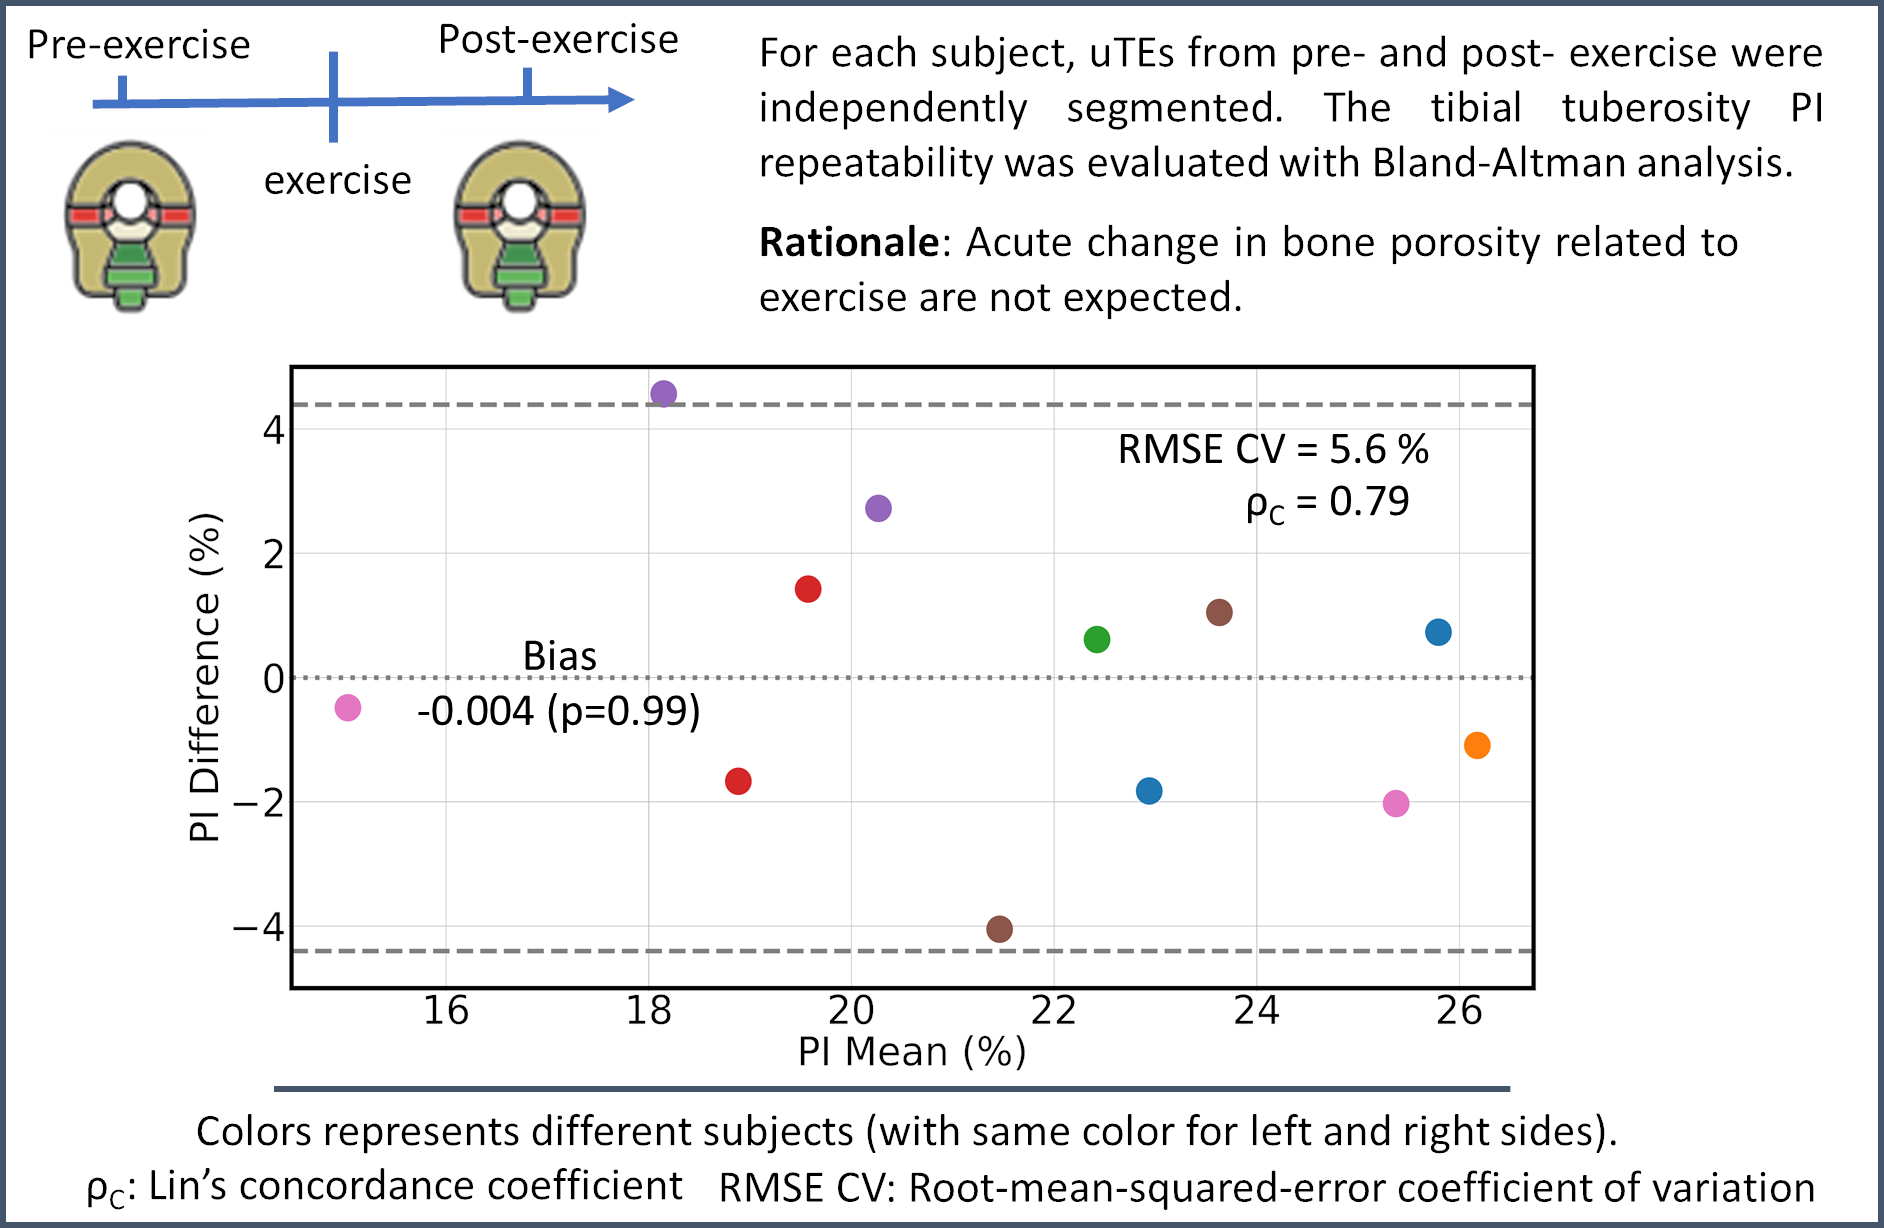
PIs from the post-exercise scans were also computed for repeatability as PI was not expected to acutely change due to exercise. A Bland-Altmann (BA) analysis was used to assess PI repeatability. Lin’s concordance coefficient (ρc) and the root-mean-square error (RMSE) coefficient variation percentage (CV) were evaluated.
Associations between PI and PET parameters (mean SUV and Ki) were investigated by means of Pearson’s coefficients (ρ). Out of 20 total data points, 7 data points were discarded before comparison either because of artifacts in uTE images (6) or failed PET estimation in TT (1). No correction for multiple comparisons was applied due to the exploratory nature of the study.
Results
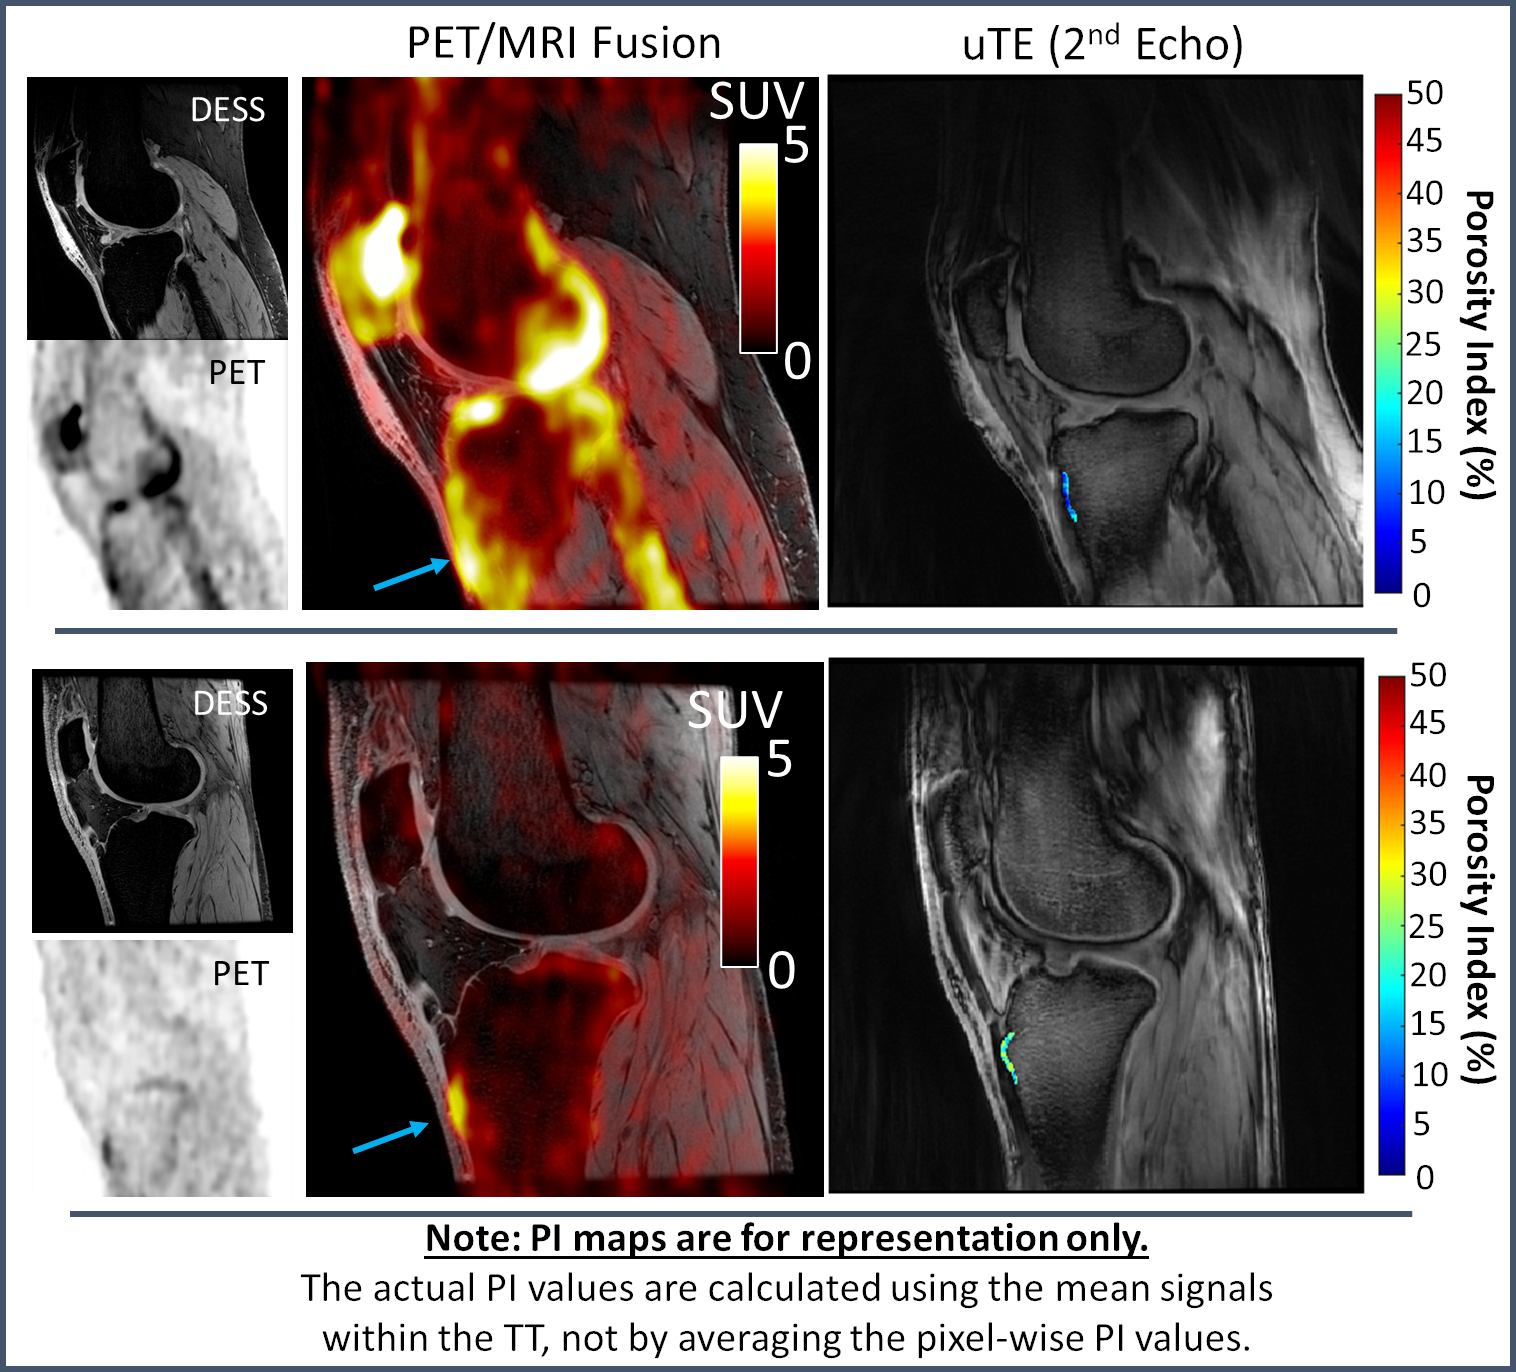
Overall, a good agreement between repeated measurements of PIs was found as shown in the BA plot of Fig. 3 (bias=0, ρc = 0.79, RMSE CV = 5.6 %, Limits-of-agreement = ±4.4%).Representative PET/MRI fused data and pixel-wise PI maps are reported in Fig. 4 for two subjects that presented opposite outcomes. The subject displayed on the top panel presented a higher SUV in the TT than the subject on the bottom panel (see arrows in Fig. 4). However, PI values in the TT region were higher for the latter subject than the first one.
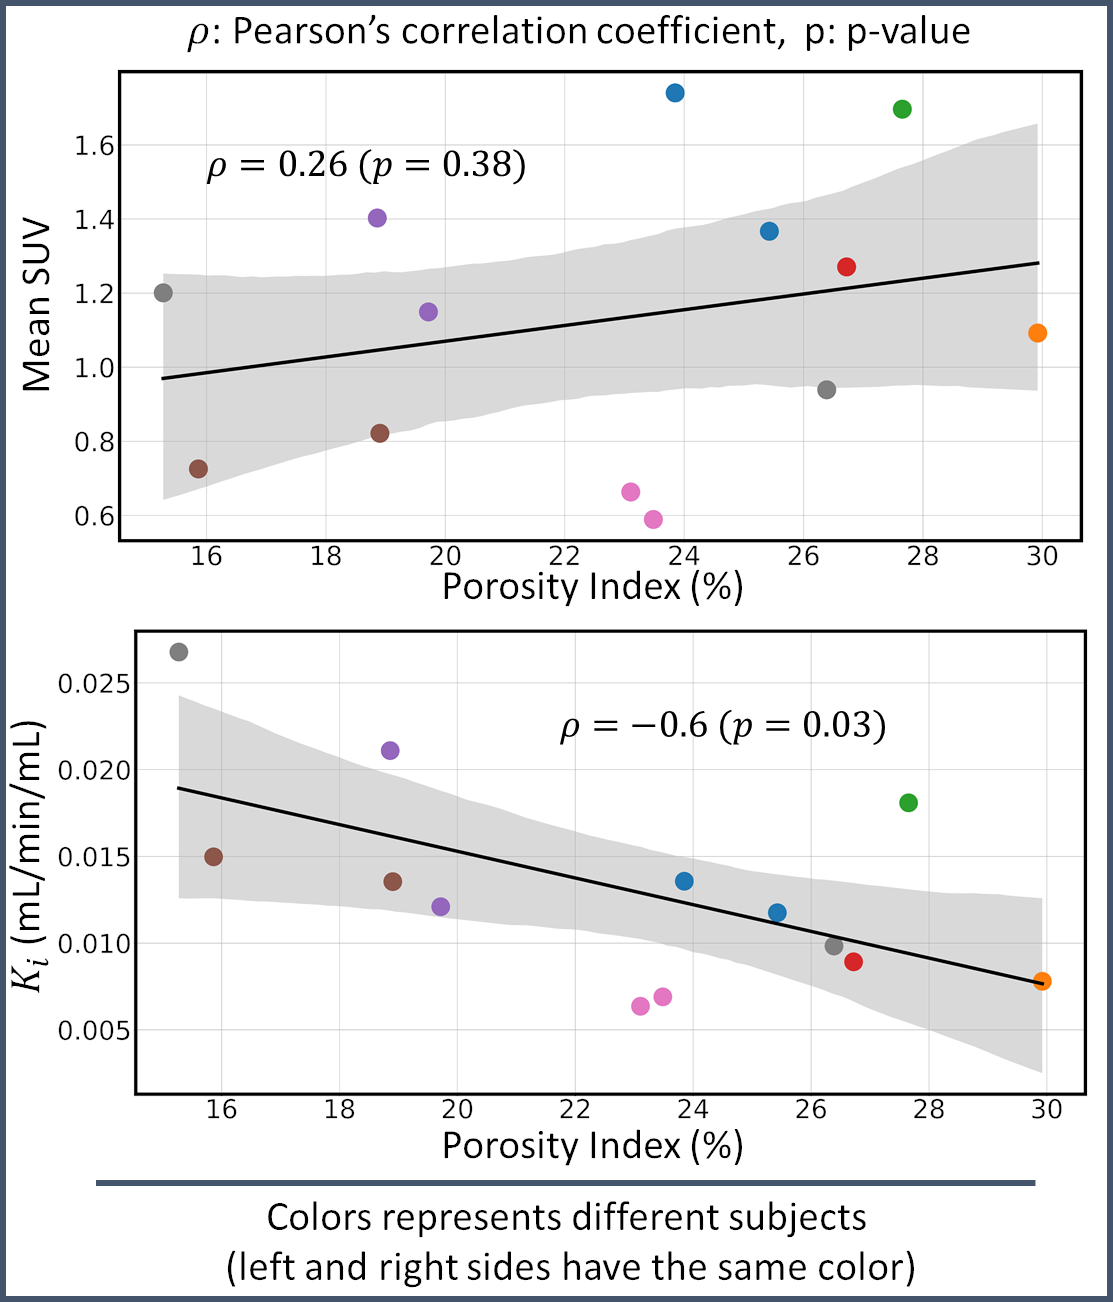
The association study between PI and PET parameters is reported in Fig. 5. The PI ranged between 15 and 30 % among subjects. No statistically significant correlation was found between PI and mean SUV values (p=0.38), whereas a statistically significant moderate negative correlation (ρ = -0.6, p=0.03) was found between PI and Ki values.
Discussion
The negative correlation between Ki and PI may be explained considering that [18F]NaF uptake is strongly related to bone formation activity. Bone porosity increases when bone resorption outperforms bone formation, which could explain the decrease in bone formation activity measured by Ki. Interestingly, this association was not present when only mean SUV values were considered. This may be due to patient differences in tracer distribution and remarks the importance of conducting dynamic PET studies to obtain fully quantitative metrics of bone metabolism.Although we found a statistically significant correlation in this small feasibility study, there are several limitations. Although care was taken to assess the repeatability of the PI values, which was reasonably good, partial volume effects with trabecular bone and tendons might have affected the PI estimation. In future studies, uTEs should be acquired in the axial plane. Furthermore, only the tibial tuberosity was investigated. Unfortunately, cortical bone in the knee joint is much thinner than long bones. Therefore, higher resolution is needed to limit partial volume effects.
Conclusion
Despite the exploratory nature of the work, we demonstrated the feasibility of investigating the relationship between bone metabolism activity and bone porosity using [18F]NaF PET-MRI. We found a moderate negative correlation between the PET parameter Ki and the porosity index. These promising results may highlight a new tool to unveil unknown pathways in musculoskeletal disease pathophysiology in vivo.Acknowledgements
This work was supported by research support from GE Healthcare and NIH Grants R00EB022634 and R01AR074492. * The authors contributed equally to the work.References
1. Jadvar H, Desai B, Conti PS. Sodium 18 F-Fluoride PET/CT of Bone, Joint, and Other Disorders. doi: 10.1053/j.semnuclmed.2014.07.008.
2. Kogan F, Fan AP, Monu U, Iagaru A, Hargreaves Y Z X BA, Gold Y Z K GE. Quantitative imaging of bone-cartilage interactions in ACL-injured patients with PET-MRI. 2018 doi: 10.1016/j.joca.2018.04.001.
3. Savic D, Pedoia V, Seo Y, et al. Imaging Bone-Cartilage Interactions in Osteoarthritis Using [ 18 F]-NaF PET-MRI. doi: 10.1177/1536012116683597.
4. Watkins L, Mackay J, Haddock B, et al. Assessment of quantitative [ 18 F]Sodium fluoride PET measures of knee subchondral bone perfusion and mineralization in osteoarthritic and healthy subjects. 2021 doi: 10.1016/j.joca.2021.02.563.
5. Horch RA, Nyman JS, Gochberg DF, Dortch RD, Does MD. Characterization of 1 H NMR signal in human cortical bone for magnetic resonance imaging. Magn. Reson. Med. 2010;64:680–687 doi: 10.1002/mrm.22459.
6. Wehrli FW. Magnetic resonance of calcified tissues. J. Magn. Reson. 2013 doi: 10.1016/j.jmr.2012.12.011.
7. Rajapakse CS, Bashoor-Zadeh M, Li C, Sun W, Wright AC, Wehrli FW. Volumetric cortical Bone Porosity assessment with Mr imaging: Validation and Clinical Feasibility 1. Radiol. n Radiol. 2015;276 doi: 10.1148/radiol.15141850.
8. Hong AL, Ispiryan M, Padalkar V, et al. MRI-derived bone porosity index correlates to bone composition and mechanical stiffness. 2019 doi: 10.1016/j.bonr.2019.100213.
9. Jones BC, Jia S, Lee H, et al. MRI-derived porosity index is associated with whole-bone stiffness and mineral density in human cadaveric femora. Bone 2021;143:115774 doi: 10.1016/j.bone.2020.115774.
10. Hawkins RA, Choi Y, Huang S-C, et al. Evaluation of the Skeletal Kinetics of Fluorine-18-Fluoride Ion with PET. J. Nucl. Med. 1992;33.
11. Haddock B, Fan AP, Jørgensen NR, Suetta C, Gold GE, Kogan F. Kinetic [18F]-Fluoride of the Knee in Normal Volunteers. Clin. Nucl. Med. 2019;44:377–385 doi: 10.1097/RLU.0000000000002533.
Figures