0401
Resting state fluctuations in BOLD fMRI might not systematically reflect measures of cerebrovascular physiology between or within subjects1Basque Center on Cognition, Brain and Language, Donostia, Spain, 2NIMH/NIH/HHS, Bethesda, MD, United States, 3Physical Therapy and Human Movement Sciences, Feinberg School of Medicine, Northwestern University, Chicago, IL, United States, 4Biomedical Engineering, McCormick School of Engineering, Northwestern University, Evanston, IL, United States
Synopsis
Resting State Fluctuations (RSF) metrics are frequently associated with vascular and physiological factors, to the point of being suggested as alternative estimates of cerebrovascular reactivity (CVR) and as tools for fMRI data calibration. Using a densely sampled fMRI dataset, we demonstrate high individual variability in the inter-session relationships between RSF metrics and CVR. Moreover, while physiological factors such as blood pressure show a significant relationship with CVR, they do not with common RSF metrics. These results indicate that RSF parameters might not be suitable alternatives for CVR, and may not properly account for inter-individual physiological variations in BOLD fMRI data.
Introduction
In BOLD fMRI imaging, Resting State (RS) fluctuations (RSF) are frequently used to map intrinsic brain activations and functional networks, as they are driven by neuronal activity. However, RSF are also influenced by physiological factors, such as respiratory, blood gas, and cardiac pulse changes1. This has led to the idea of using certain RSF metrics, such as the Amplitude of Low Frequency Fluctuations (ALFF)2 and the RS fluctuation amplitude (RSFA)3, to calibrate task-induced activations within and between subjects3-8. ALFF and RSFA have also been used as low-cost metrics of vascular health, specifically as estimates of Cerebrovascular Reactivity (CVR)9, which typically requires a complex experimental setup and/or high subject compliance to perform breathing tasks10. Instead, RS scans have minimal requirements and RSF may provide comparable information to CVR3,11-14. However, these studies use limited sample sizes, with inconsistent observations12,15. This study investigates: (1) the relationship between RSF and Breathhold (BH)-based CVR estimation over repeated scan sessions, (2) the inter-subject variability of this relationship, and (3) the impact of other factors, such as blood pressure (BP), pulse, and sex, on both RSF and CVR, leveraging a dense mapping dataset of Multi-Echo (ME) BOLD fMRI16. Our goal is to better determine how RSF metrics relate to other known measures of vascular physiology in healthy individuals over time.Method
7 subjects underwent a weekly BOLD fMRI scan consisting of a RS (10 minutes) and a BH task (8 minutes) over the course of 10 weeks. Mean Arterial Pressure (MAP) and Pulse Pressure (PP) were acquired before each session after 5 minutes of rest in supine poistion, once for each arm, then averaged. Pulse was also recorded. Details about ME-fMRI17 and physiological data acquisition, and computation of BH-induced CVR maps (OC-MPR model) are described in 16. RS data were preprocessed similarly, except that ME-ICA regressors obtained with tedana18 were also added for nuisance regression. RSFA, ALFF, and fractional ALFF (fALFF)19 were computed in the 0.1-0.01 Hz range using AFNI. Both CVR and RSF maps were then smoothed (5mm FWHM) and normalised to the MNI template.A Linear Mixed Effect (LME) model20 was used to assess the voxelwise relationship between RSF and CVR as: $$$ RSF ∼ CVR + (CVR|ses) + (CVR|subj) $$$. The same model was applied on the average grey matter (GM) CVR and each RSF metric. Similar LME models were used to assess the effects of non-imaging measures of vascular physiology (MAP, PP, and pulse) on CVR and the RSF metric as follows: $$$ metric ∼ sex * (MAP+PP+pulse) + (1|ses) + [(MAP+PP+pulse)|subj) $$$, where metric is either CVR or a RSF map.
Results
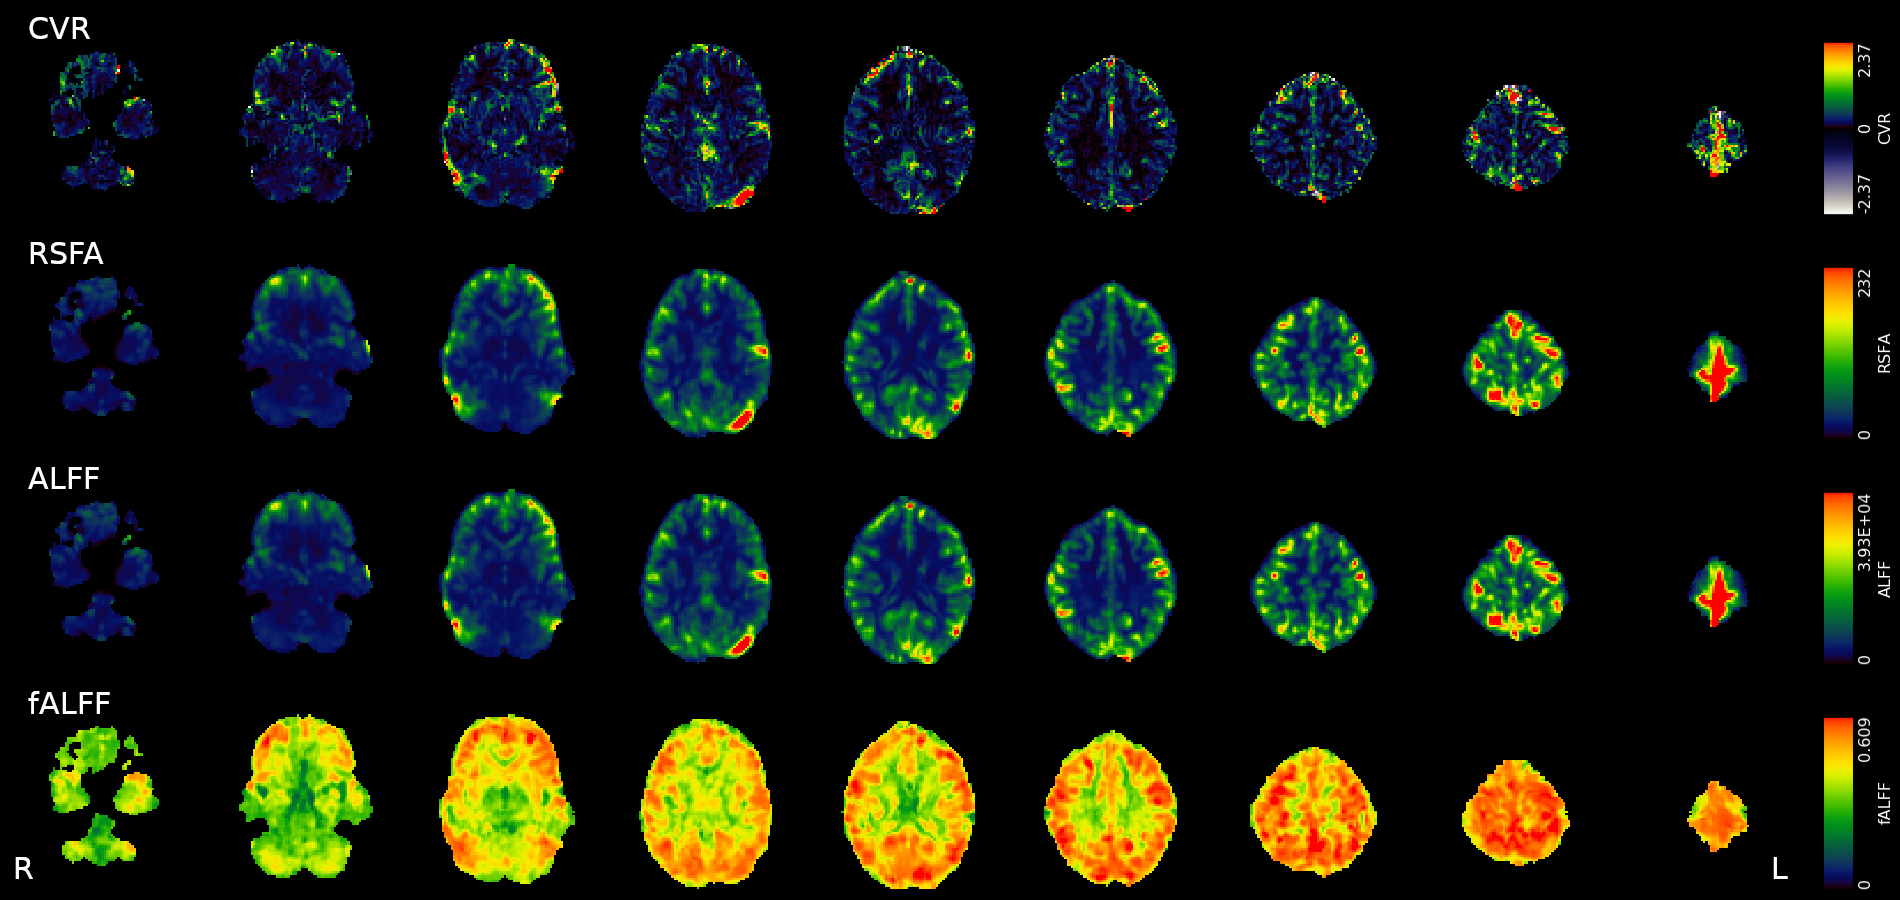
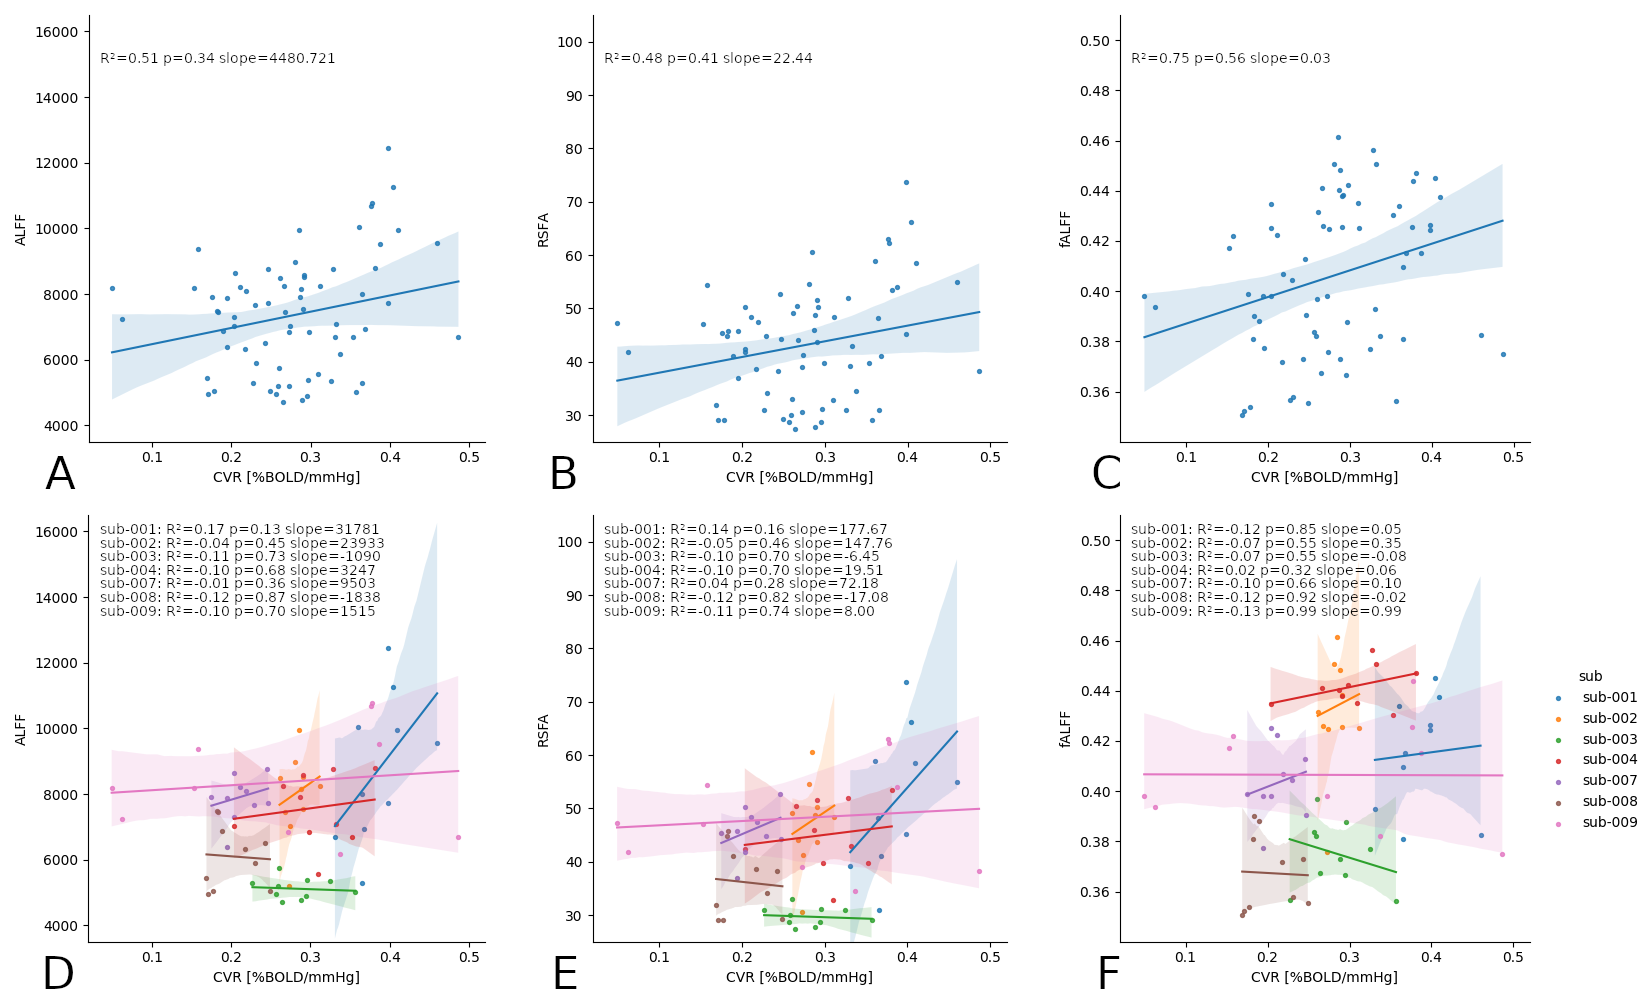
While RSFA and ALFF maps are qualitatively identical, and bear similarities with the CVR map, they show relatively higher GM values compared to CVR, whereas fALFF maps show completely different patterns (Fig1).While considering all subjects and sessions together seems to reveal a stable relationship between CVR and RSF metrics (in agreement with the literature) (Fig2, top), the high between-subject variability becomes evident when considering each subject individually (Fig2, bottom) where the within-subject (inter-session) relationship between CVR and RSF varies greatly across subjects. No subject-specific relationship was found significant (p=0.05).
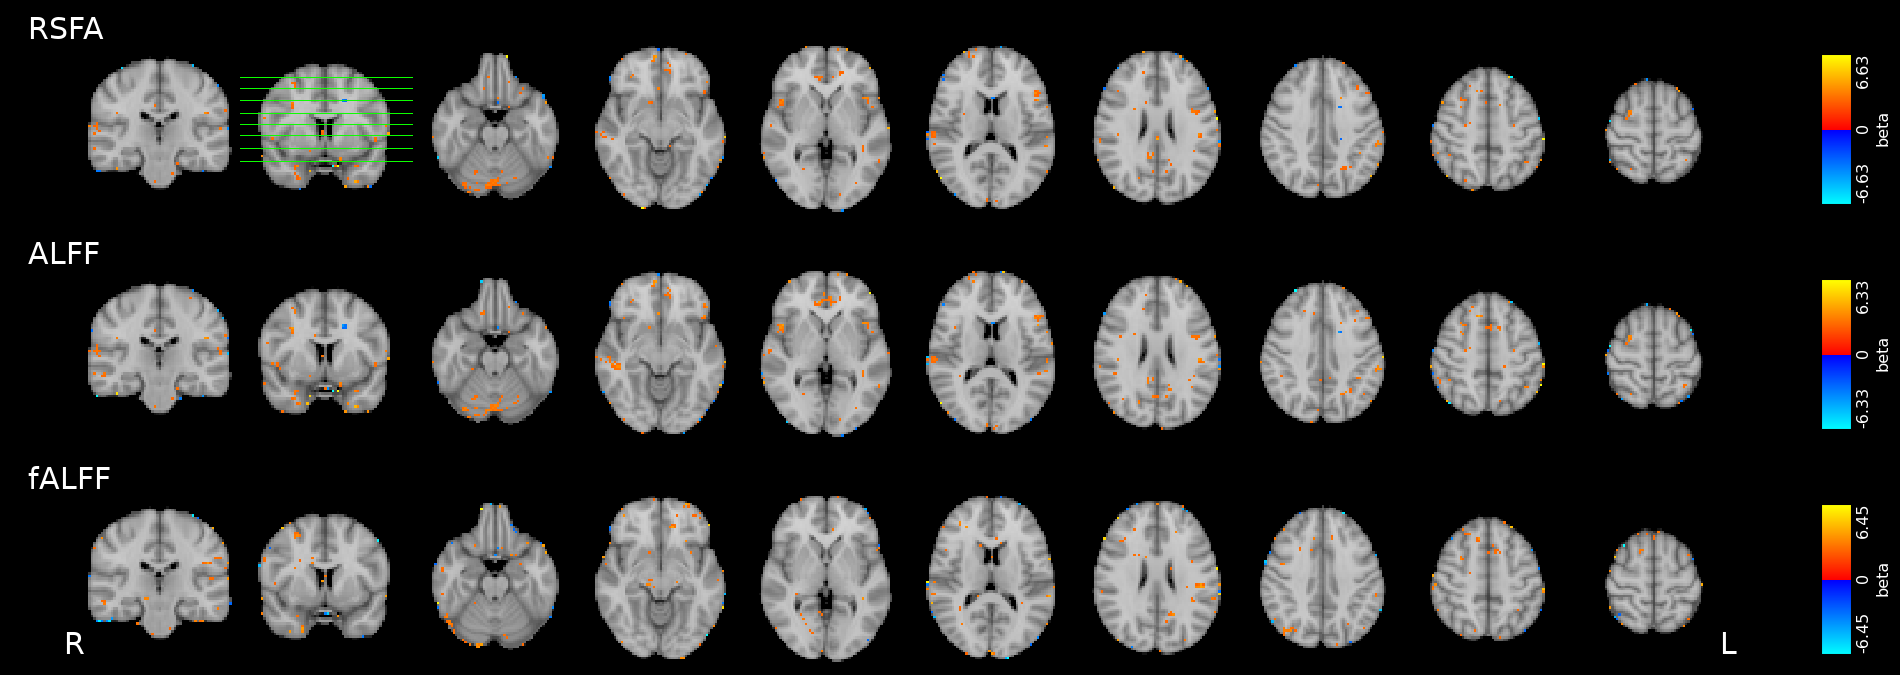
In voxelwise modeling, very few areas bear a significant relationship between CVR and RSF (p=0.001, uncorrected; no voxels achieved significance at FDR-corrected q=0.05) (Fig3).
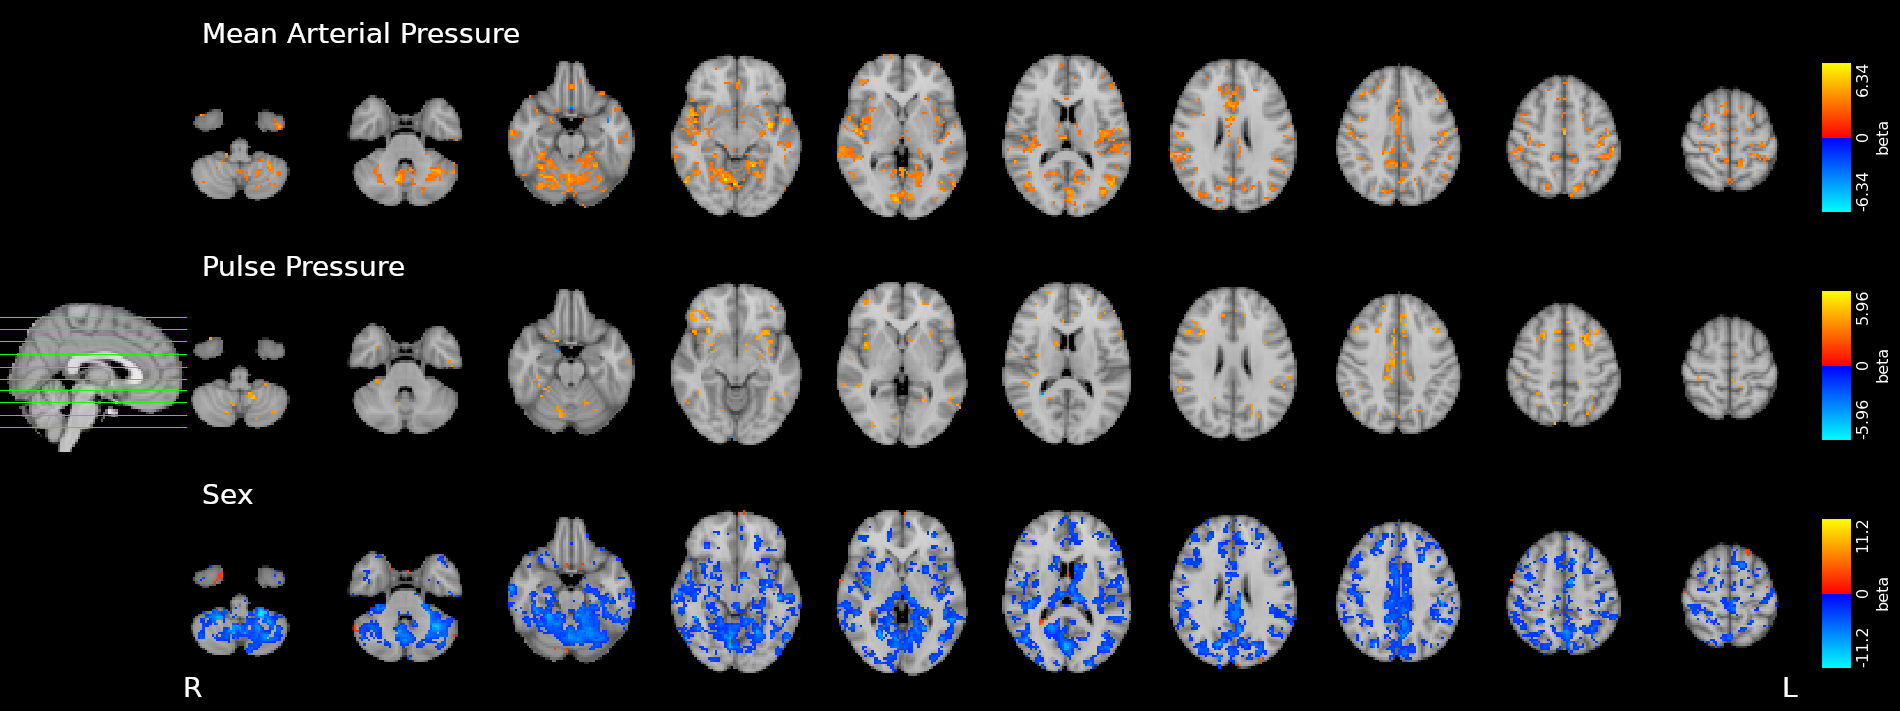
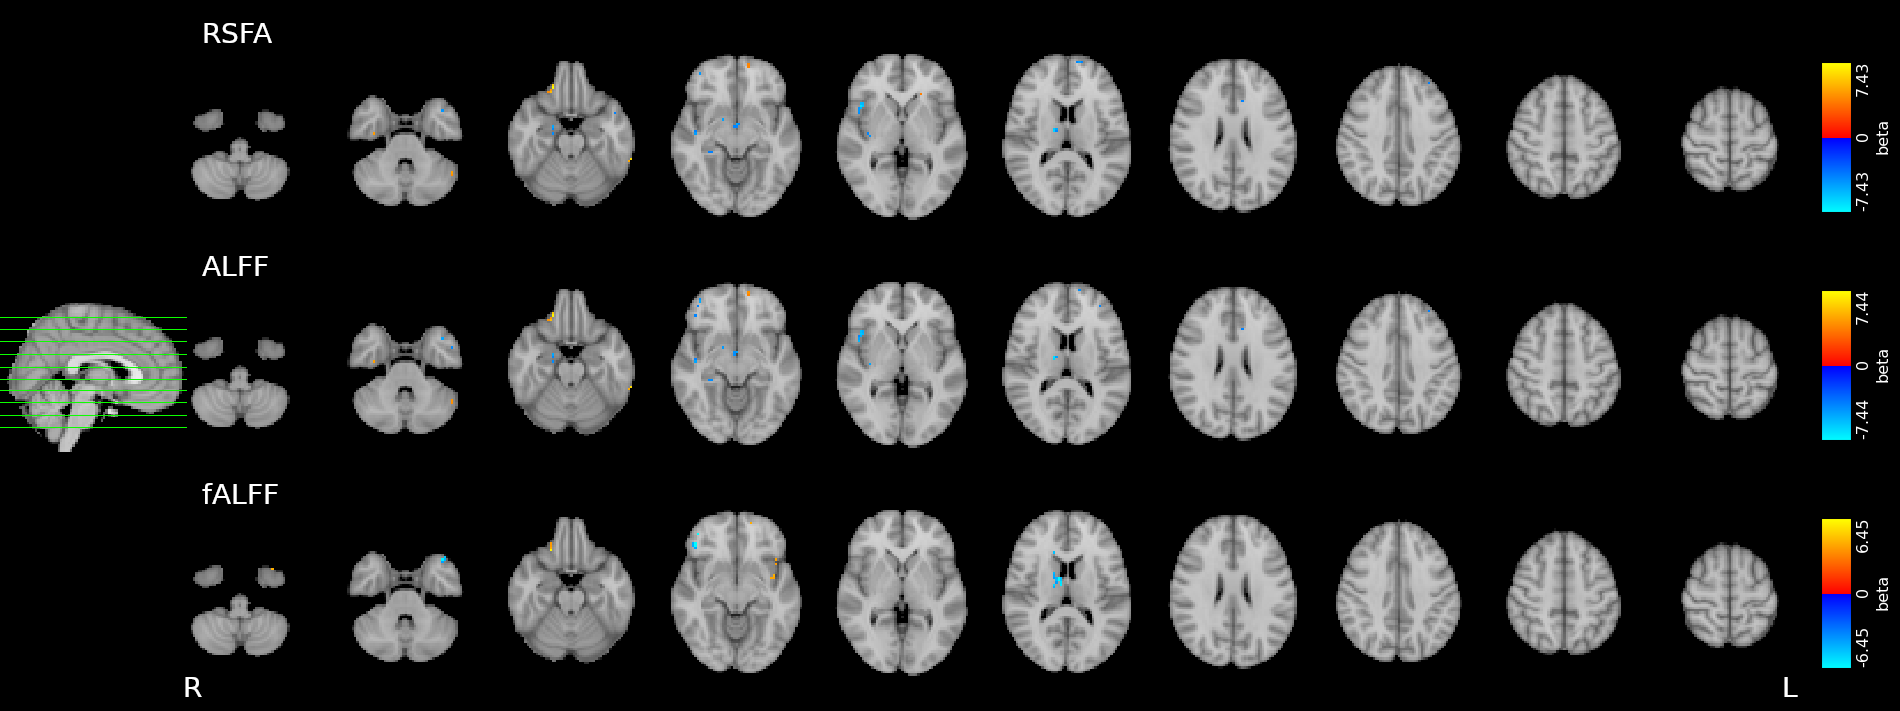
We observed widespread effects of MAP, PP, and sex on CVR (FDR-corrected q=0.05, Fig4), but only very focal effects of sex on all RSF metrics (FDR-corrected q=0.05, Fig5). No significant result was found for the effect of MAP, PP, or pulse on any RSF metric.
Discussion & Conclusions
These results suggest that RSF metrics are not driven by the same physiological mechanisms reflected in CVR, and are not significantly related to external physiological measures. Furthermore, if a relationship with CVR does exist, our dense mapping experiment highlights that it varies greatly among subjects.While the use of a BH task to estimate CVR might be less accurate than CO2 gas challenge approaches, we are confident that we are capturing meaningful physiologic information across scan sessions. Specifically, we successfully observe a significant relationship between BH-derived CVR and externally measured physiological factors such as blood pressure. Conversely, because we observe that RSF metrics do not significantly correspond to these inter-session physiological factors and do not show a consistent within-subject relationship with CVR maps, we proffer that they predominantly reflect different neural or vascular properties of the brain.
Overall, while we cannot rule out a relationship between CVR and RSF metrics, we suggest caution in interpreting RSF parameter maps as CVR estimates or predominantly “physiological” maps when studying inter-subject or inter-session effects. In particular, using RSF metrics to calibrate fMRI might not be the most adequate solution, not only because the driving factor of RSF might be only partially vascular in nature, but also because RSF metrics’ relationship with vascular factors, such as CVR, greatly varies between subjects. A deeper understanding of the impact of physiological factors on RSF, and the subject-specificity of these relationships, is required.
Acknowledgements
The authors would like to thank Vicente Ferrer for collaborating in data acquisition.
This research was supported by the European Union’s Horizon 2020 research and innovation program (Marie Skłodowska-Curie grant agreement No. 713673), a fellowship from La Caixa Foundation (ID 100010434, fellowship code LCF/BQ/IN17/11620063), the Spanish Ministry of Economy and Competitiveness (Ramon y Cajal Fellowship, RYC-2017- 21845), the Spanish State Research Agency (BCBL “Severo Ochoa ” excellence accreditation, SEV- 2015-490), the Basque Government (BERC 2018-2021 and PIBA_2019_104), and the Spanish Ministry of Science, Innovation and Universities (MICINN; PID2019-105520GB-100 and FJCI-2017-31814).
References
1. Power JD, Plitt M, Laumann TO, Martin A. Sources and implications of whole-brain fMRI signals in humans. Neuroimage. 2017;146(September 2016):609-625. doi:10.1016/j.neuroimage.2016.09.038
2. Zang Y-F, He Y, Zhu C-Z, et al. Altered baseline brain activity in children with ADHD revealed by resting-state functional MRI. Brain Dev. 2007;29(2):83-91. doi:10.1016/j.braindev.2006.07.002
3. Kannurpatti SS, Biswal BB. Detection and scaling of task-induced fMRI-BOLD response using resting state fluctuations. Neuroimage. 2008;40(4):1567-1574. doi:10.1016/j.neuroimage.2007.09.040
4. Kazan SM, Mohammadi S, Callaghan MF, et al. Vascular autorescaling of fMRI (VasA fMRI) improves sensitivity of population studies: A pilot study. Neuroimage. 2016;124:794-805. doi:10.1016/j.neuroimage.2015.09.033
5. Kazan SM, Huber L, Flandin G, Ivanov D, Bandettini P, Weiskopf N. Physiological basis of vascular autocalibration (VasA): Comparison to hypercapnia calibration methods. Magn Reson Med. 2017;78(3):1168-1173. doi:10.1002/mrm.26494
6. Tsvetanov KA, Henson RNA, Tyler LK, et al. The effect of ageing on fMRI: Correction for the confounding effects of vascular reactivity evaluated by joint fMRI and MEG in 335 adults. Hum Brain Mapp. 2015;36(6):2248-2269. doi:10.1002/hbm.22768
7. Kalcher K, Boubela RN, Huf W, et al. RESCALE: Voxel-specific task-fMRI scaling using resting state fluctuation amplitude. Neuroimage. 2013;70:80-88. doi:10.1016/j.neuroimage.2012.12.019
8. Di X, Kannurpatti SS, Rypma B, Biswal BB. Calibrating BOLD fMRI activations with neurovascular and anatomical constraints. Cereb Cortex. 2013;23(2):255-263. doi:10.1093/cercor/bhs001
9. Pinto J, Bright MG, Bulte DP, Figueiredo P. Cerebrovascular reactivity mapping without gas challenges: A Methodological Guide. Front Physiol. 2021;11:1711. doi:10.3389/fphys.2020.608475
10. Kastrup A, Krüger G, Neumann-Haefelin T, Moseley ME. Assessment of cerebrovascular reactivity with functional magnetic resonance imaging: Comparison of CO2 and breath holding. Magn Reson Imaging. 2001;19(1):13-20. doi:10.1016/S0730-725X(01)00227-2
11. De Vis JB, Bhogal AA, Hendrikse J, Petersen ET, Siero JCW. Effect sizes of BOLD CVR, resting-state signal fluctuations and time delay measures for the assessment of hemodynamic impairment in carotid occlusion patients. Neuroimage. 2018;179(June):530-539. doi:10.1016/j.neuroimage.2018.06.017
12. Golestani AM, Wei LL, Chen JJ. Quantitative mapping of cerebrovascular reactivity using resting-state BOLD fMRI: Validation in healthy adults. Neuroimage. 2016;138:147-163. doi:10.1016/j.neuroimage.2016.05.025
13. Kannurpatti SS, Motes MA, Biswal BB, Rypma B. Assessment of unconstrained cerebrovascular reactivity marker for large age-range fMRI studies. PLoS One. 2014;9(2). doi:10.1371/journal.pone.0088751
14. Wang J, Chen H, Liang H, et al. Low-frequency fluctuations amplitude signals exhibit abnormalities of intrinsic brain activities and reflect cognitive impairment in leukoaraiosis patients. Med Sci Monit. 2019;25:5219-5228. doi:10.12659/MSM.915528
15. Lipp I, Murphy K, Caseras X, Wise RG. Agreement and repeatability of vascular reactivity estimates based on a breath-hold task and a resting state scan. Neuroimage. 2015;113:387-396. doi:10.1016/j.neuroimage.2015.03.004
16. Moia S, Termenon M, Uruñuela E, et al. ICA-based denoising strategies in breath-hold induced cerebrovascular reactivity mapping with multi echo BOLD fMRI. Neuroimage. 2021;233:117914. doi:10.1016/j.neuroimage.2021.117914
17. Moeller S, Yacoub E, Olman CA, et al. Multiband multislice GE-EPI at 7 tesla, with 16-fold acceleration using partial parallel imaging with application to high spatial and temporal whole-brain FMRI. Magn Reson Med. 2010;63(5):1144-1153. doi:10.1002/mrm.22361
18. DuPre E, Salo T, Markello R, Kundu P, Whitaker K, Handwerker D. ME-ICA/tedana: 0.0.6. February 2019. doi:10.5281/ZENODO.2558498
19. Zou QH, Zhu CZ, Yang Y, et al. An improved approach to detection of amplitude of low-frequency fluctuation (ALFF) for resting-state fMRI: Fractional ALFF. J Neurosci Methods. 2008;172(1):137-141. doi:10.1016/j.jneumeth.2008.04.012
20. Chen G, Saad ZS, Britton JC, Pine DS, Cox RW. Linear mixed-effects modeling approach to FMRI group analysis. Neuroimage. 2013;73:176-190. doi:10.1016/j.neuroimage.2013.01.047
Figures