0400
Molecular-enriched functional connectivity in the human brain using multi-band multi-echo simultaneous ASL/BOLD fMRI1Department of Neuroimaging, Institute of Psychiatry, Psychology and Neuroscience, King's College London, London, United Kingdom, 2Department of Radiology, Medical College of Wisconsin, Milwaukee, WI, United States, 3GE Healthcare, Waukesha, WI, United States, 4GE Healthcare, Menlo Park, CA, United States
Synopsis
This work is a proof of concept for the integration of ASL fMRI and molecular imaging using REACT, a novel analytical strategy that enriches functional data with the molecular information on the neurotransmitter distribution density. We applied REACT to high-resolution, whole-brain simultaneous ASL/BOLD data to estimate BOLD- and perfusion-weighted (PW)-based functional connectivity maps related to specific molecular systems and compared the results from the two fMRI modalities, showing very similar patterns of molecular-enriched functional connectivity. Our findings show that the PW signal is as informative as BOLD in terms of detection of functional circuits associated to specific molecular pathways.
Introduction
Understanding the relationship between the microscale molecular processes of the human brain and its macroscale functional architecture has attracted considerable attention in the neuroimaging community over the years. Fuelled by cutting-edge technological and analytical advances and global data-sharing initiatives, the use of multimodal approaches integrating information from different imaging modalities has transformed the amount of information one can derive from conventional imaging techniques when studying the brain function.One of the most recent analytical strategies to integrate functional magnetic resonance imaging (fMRI) and molecular imaging is REACT1, a method exploiting the temporal dynamics of the fMRI signal to identify functional circuits associated with specific molecular systems. So far, REACT has been applied to BOLD fMRI data to characterize distinctive patterns of functional alterations associated with brain disorders and uncover the mechanisms underlying the effects of pharmacological treatment. However, BOLD signal is an indirect measure of neuronal activity, and results from the combination of changes in cerebral blood flow (CBF) and volume (CBV), and oxygen consumption2. Thus, inferring neuronal dynamics directly from the BOLD signal is not straightforward.
Arterial Spin Labelling (ASL) offers a potentially interesting alternative to BOLD since it allows for a more specific measure of the CBF changes associated with neuronal activity. A novel multi-band and multi-echo (MB-ME) ASL/BOLD sequence that provides high-resolution, whole-brain simultaneous ASL/BOLD data to study the brain’s functional connectivity3 has recently contributed to overcome some of the classical technical limitations of the standard single-shot ASL techniques.
In this work, we determined the feasibility of integrating ASL fMRI and molecular imaging. We applied REACT to high-resolution, whole-brain simultaneous ASL/BOLD data to estimate perfusion-weighted (PW)-based functional connectivity (FC) maps related to specific molecular systems and compared them to the ones derived from BOLD fMRI.
Methods
Twenty-nine healthy volunteers (mean age = 28.0y, M/F: 9/20) were scanned on a 3T GE Premier scanner. Subjects underwent a resting-state fMRI scan using a MBME ASL/BOLD EPI sequence3 (TR/TE=3500/11,30,49,67ms, labeling time = 1.5s, post-labeling delay = 1s, FOV=24cm, matrix size=80x80 with slice thickness = 3mm, 3x3x3mm voxel size, 11 slices with multiband factor=4 (44 total slices), FA=90°, partial Fourier factor=0.85, in-plane acceleration=2). A T1-weighted MPRAGE anatomical image was also collected to aid with coregistration.Data were analyzed using AFNI4 and FSL5. First, the anatomical MPRAGE image was coregistered to Montreal Neurological Institute (MNI) space. Each dataset was then volume registered to the first volume using mcflirt. For the BOLD analysis, the four echoes were combined using the -weighted approach6. The data was then denoised using multi-echo independent component analysis (ME-ICA) and the open source python script tedana.py version 0.0.10 (https://tedana.readthedocs.io/en/latest/)7-9, registered to MNI space using the anatomical transformations computed previously, smoothed using a 6mm FWHM Gaussian kernel, and high-pass filtered with fc=0.01Hz. A PW time series was also computed using the first echo by surround subtracting label and control images10.
Six in vivo molecular templates of the transporters of dopamine (DAT), noradrenaline (NAT), serotonin (SERT) and vescicular acetylcholine (VAChT), and GABA-A (alpha 5 sub-unit) and NMDA receptors from an internal data bank of PET templates were used as spatial priors to enrich the fMRI analysis of the BOLD and ASL data and estimate the BOLD- and ASL-based functional circuits associated with every molecular system using the react-fmri package11. We then ran voxel-wise one-sample t-tests in Randomise12 to estimate population inferences for each system and fMRI modality. After transforming the resulting t-stat maps into z-score images and down-sampling them at 4 mm3, we assessed the correlation of each of the molecular-enriched FC maps estimated with the two fMRI modalities using spatial permutation testing (spin test) implemented in the brainSMASH platform13, to account for the inherent spatial autocorrelation of the imaging data.
Results
Figure 1 shows the molecular atlases of the DAT, NAT, SERT, VAChT, and GABA-A and NMDA receptors, and the corresponding t-stat BOLD and CBF maps of molecular-enriched FC from the one sample t-tests. We found moderate positive correlations between voxel-wise spatial distribution of the molecular-enriched FC maps derived from the BOLD data and those derived from the ASL data in the same subjects (range of Pearson’s r: 0.47-0.69, pspin<0.001; Figure 2).Discussion
Our findings demonstrate the feasibility of using high-resolution, whole-brain ASL data to estimate molecular-enriched FC maps using REACT. The spatial patterns of molecular-enriched FC estimated using BOLD and ASL are largely similar, despite the typical lower signal-to-noise ratio of ASL. Except for the GABA-A-enriched maps, the ASL-derived FC maps show more widespread positive FC patterns and reduced areas of negative connectivity, but this observation will be further investigated using quantitative similarity measures.Conclusion
This work is a proof of concept for the integration of ASL fMRI and molecular imaging using REACT. Ongoing work is exploring potential differences between the two modalities in terms of intra-subject reliability and signal-to-noise ratio, which might inform the selection of one modality over the other for future applications. Given the tighter link between ASL fMRI and neuronal activity, this new integrative approach is likely to become a valuable asset in clinical studies investigating functional alterations in patients with brain disorders or neuropharmacological studies investigating the effects of new or existent compounds on the brain.Acknowledgements
The authors wish to thank the National Institute for Health Research (NIHR) Biomedical Research Centre at South London and Maudsley NHS Foundation Trust and King’s College London for their ongoing support of our research. The views expressed are those of the authors and not necessarily those of the NHS, the NIHR or the Department of Health and Social Care.References
1 Dipasquale, O. et al. Receptor-Enriched Analysis of functional connectivity by targets (REACT): A novel, multimodal analytical approach informed by PET to study the pharmacodynamic response of the brain under MDMA. Neuroimage 195, 252-260, doi:10.1016/j.neuroimage.2019.04.007 (2019).
2 Buxton, R. B., Uludag, K., Dubowitz, D. J. & Liu, T. T. Modeling the hemodynamic response to brain activation. Neuroimage 23 Suppl 1, S220-233, doi:10.1016/j.neuroimage.2004.07.013 (2004).
3 Cohen, A. D., Nencka, A. S., Lebel, R. M. & Wang, Y. Multiband multi-echo imaging of simultaneous oxygenation and flow timeseries for resting state connectivity. PloS one 12, e0169253, doi:10.1371/journal.pone.0169253 (2017).
4 Cox, R. W. AFNI: software for analysis and visualization of functional magnetic resonance neuroimages. Comput Biomed Res 29, 162-173 (1996).
5 Jenkinson, M., Beckmann, C. F., Behrens, T. E., Woolrich, M. W. & Smith, S. M. Fsl. NeuroImage 62, 782-790, doi:10.1016/j.neuroimage.2011.09.015 (2012).
6 Posse, S. et al. Enhancement of BOLD-contrast sensitivity by single-shot multi-echo functional MR imaging. Magn Reson Med 42, 87-97 (1999).
7 Kundu, P. et al. Integrated strategy for improving functional connectivity mapping using multiecho fMRI. Proceedings of the National Academy of Sciences 110, 16187-16192, doi:10.1073/pnas.1301725110 (2013).
8 Kundu, P., Inati, S. J., Evans, J. W., Luh, W. M. & Bandettini, P. A. Differentiating BOLD and non-BOLD signals in fMRI time series using multi-echo EPI. NeuroImage 60, 1759-1770, doi:10.1016/j.neuroimage.2011.12.028 (2012).
9 DuPre, E. et al. ME-ICA/tedana: 0.0.6: https://doi.org/10.5281/zenodo.2558498, <https://doi.org/10.5281/zenodo.2558498> (2019).
10 Wong, E. C., Buxton, R. B. & Frank, L. R. Implementation of quantitative perfusion imaging techniques for functional brain mapping using pulsed arterial spin labeling. NMR in biomedicine 10, 237-249 (1997).
11 Dipasquale, O. & Frigo, M. REACT-fMRI Python package. Zenodo, doi:10.5281/zenodo.4730558 (2021).
12 Winkler, A. M., Ridgway, G. R., Webster, M. A., Smith, S. M. & Nichols, T. E. Permutation inference for the general linear model. Neuroimage 92, 381-397, doi:10.1016/j.neuroimage.2014.01.060 (2014).
13 Burt, J. B., Helmer, M., Shinn, M., Anticevic, A. & Murray, J. D. Generative modeling of brain maps with spatial autocorrelation. Neuroimage 220, 117038, doi:10.1016/j.neuroimage.2020.117038 (2020).
Figures
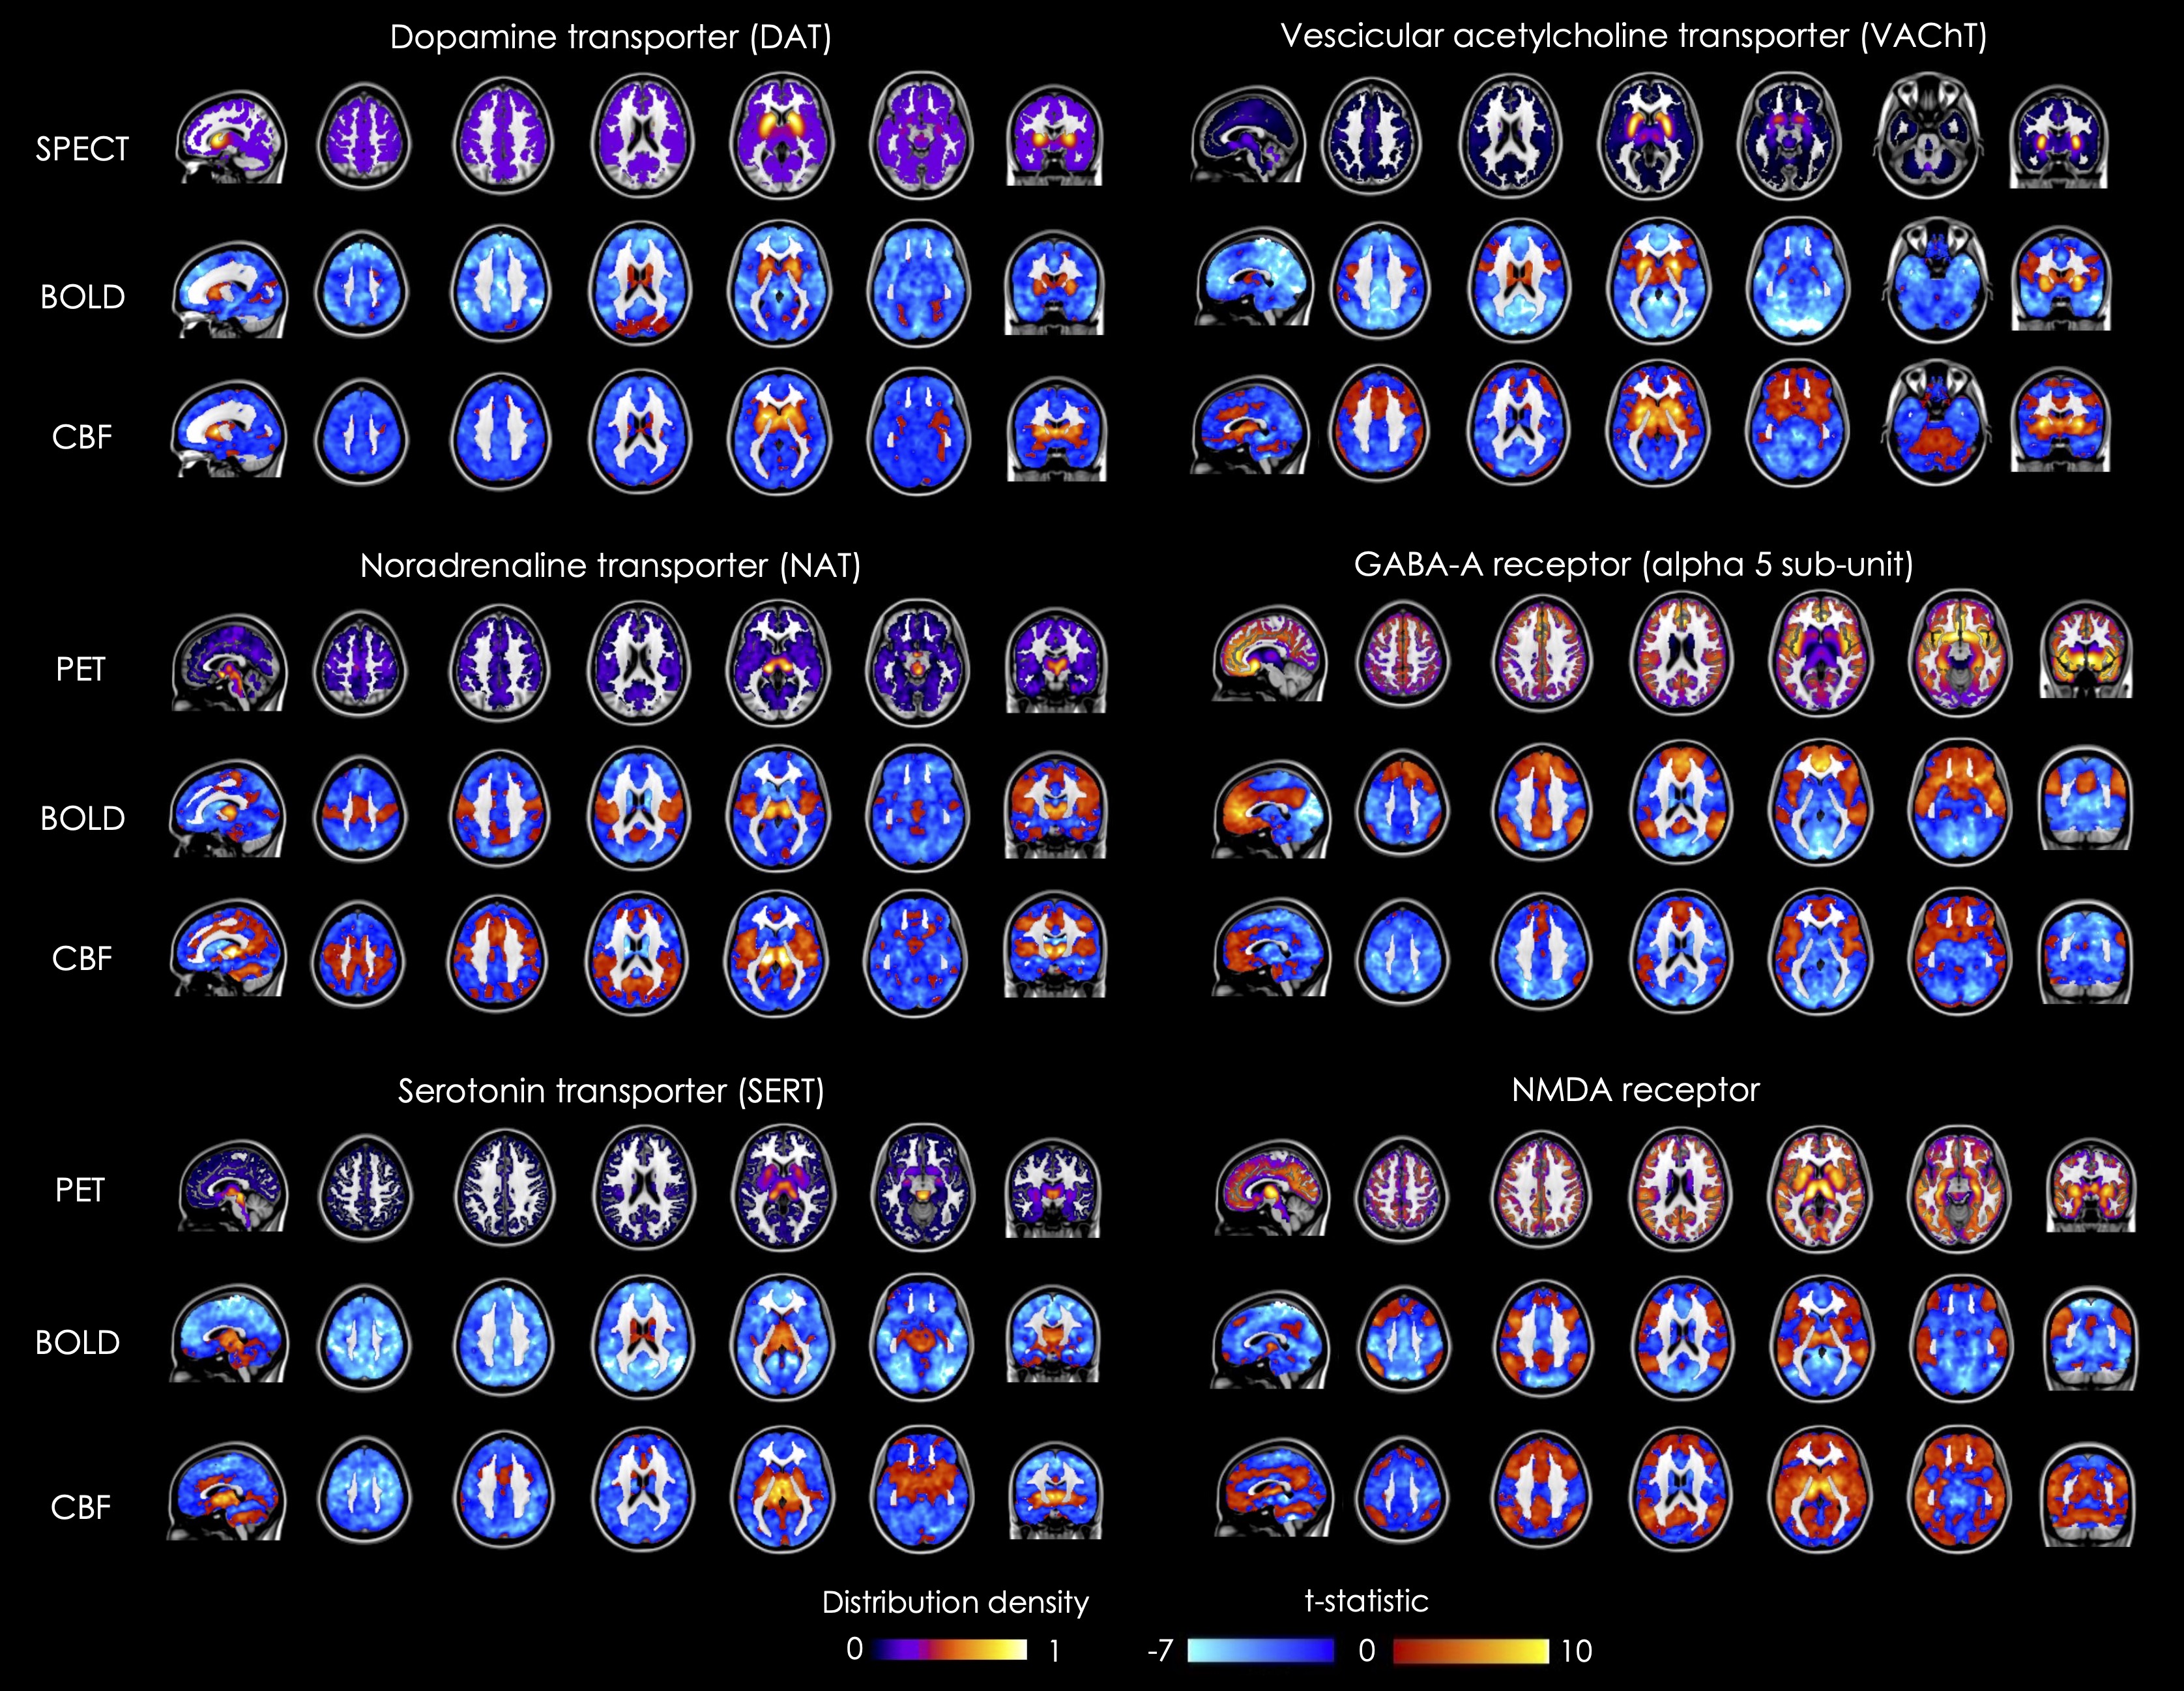

Figure 2 – Voxel-wise spatial correlation of the molecular-enriched FC maps estimated with BOLD and ASL data. The 2D histograms show the relationships between the BOLD- and ASL-based molecular-enriched FC maps in terms of spatial distribution across the brain.