0399
Deep Learning Methods for Reversible Cerebral Vasoconstriction Syndrome Classification Based on Resting-state fMRI Images1Department of Radiology, Taipei Veterans General Hospital, Taipei, Taiwan, 2Integrated PET/MR Imaging Center, Taipei Veterans General Hospital, Taipei, Taiwan, 3Department of Biomedical Imaging and Radiological Sciences, National Yang-Ming Chiao Tung University, Taipei, Taiwan, 4School of Medicine, College of Medicine, National Yang-Ming Chiao Tung University, Taipei, Taiwan, 5Institute of Clinical Medicine, National Yang-Ming Chiao Tung University, Taipei, Taiwan, 6Department of Neurology, Neurological Institute, Taipei Veterans General Hospital, Taipei, Taiwan, 7Brain Research Center, National Yang-Ming Chiao Tung University, Taipei, Taiwan, 8Division of Translational Research, Taipei Veterans General Hospital, Taipei, Taiwan
Synopsis
Reversible cerebral vasoconstriction syndrome (RCVS) is a reversible segmental and multifocal vasoconstriction of the cerebral arteries and is believed to relate to autonomic network over-activity. We used Long Short-Term Memory networks (LSTMs), a type of deep neural network designed to handle time sequence data, to learn directly from the rs-fMRI time-series for classification of individuals with RCVS and healthy controls based on the regions in autonomic and other functional networks. These results provide methodological implications for rs-fMRI data of RCVS patients involved in the analysis and are a key element in future studies.
Purpose
Reversible cerebral vasoconstriction syndrome (RCVS) is a reversible segmental and multifocal vasoconstriction of the cerebral arteries. A reversible disorder of intracranial arterial tension is thought to be the common underlying mechanism shared by processes that trigger RCVS and is believed to relate to autonomic network over-activity1. Resting-state functional magnetic resonance imaging (rs-fMRI) has the correspondence between low-frequency blood oxygen level-dependent (BOLD) signals and neuronal excitation. Since the rs-fMRI data represents dynamic brain activity, we hypothesize that the time series will carry more useful information than single, static functional connectivity measures. We used Long Short-Term Memory networks (LSTMs), a type of deep neural network designed to handle time sequence data2, to learn directly from the rs-fMRI time-series for classification of individuals with RCVS and healthy controls (HC) based on autonomic and other functional networksMethods
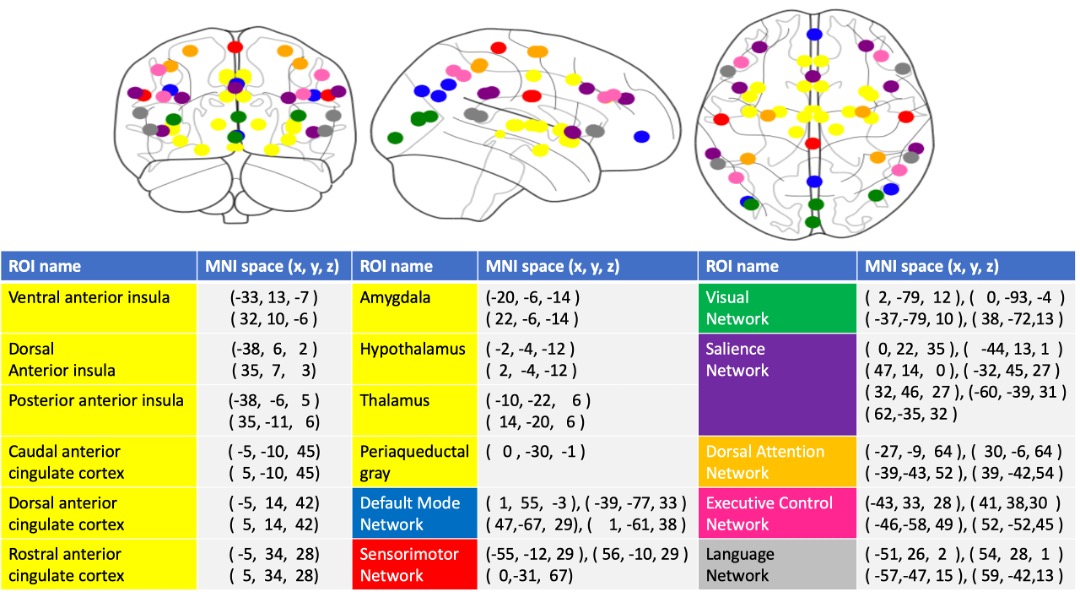
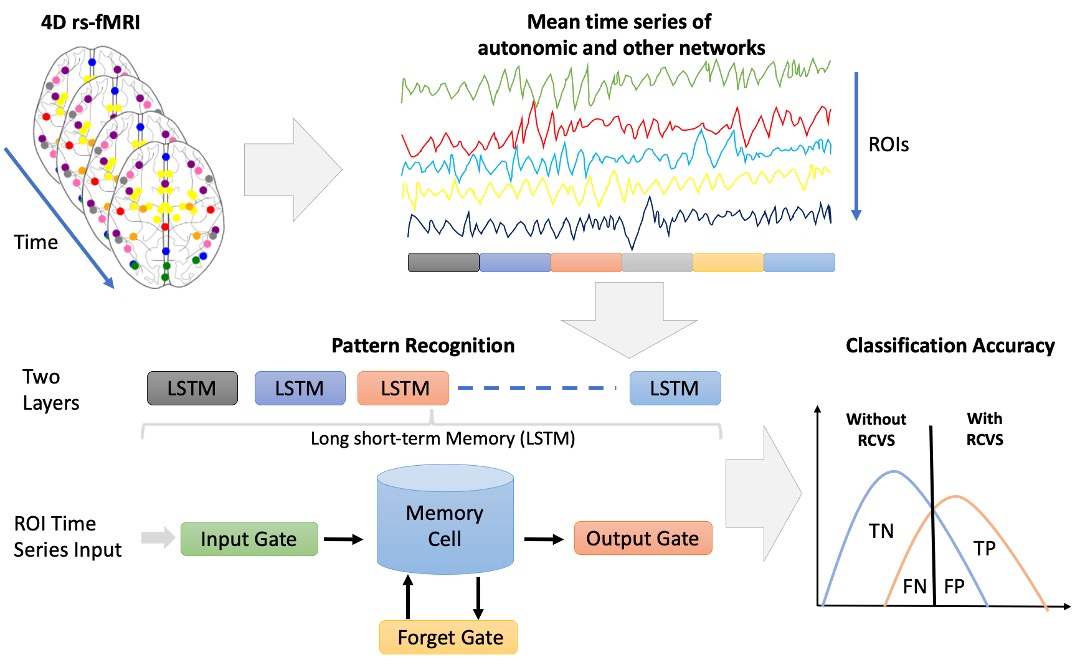
We collected 216 subjects, RCVS (M/F=52/62, age=40.47±8.09) and HC (M/F=35/67, age=39.28±9.02) based on their clinical evaluations for this study. All MR data were acquired using a 3.0 Discovery MR750, General Electric with 8 channel head coil. Rs-fMRI were collected using a gradient echo-planar pulse imaging (EPI) sequence with the following parameters: TR = 2500 ms; TE = 30 ms; flip angle = 90°; FOV = 240 mm × 240 mm; matrix = 64 × 64; 45 slices and slice thickness = 3.5 mm. 3D T1-weighted image for the co-registration and normalization of the rs-fMRI using the following parameters: axial acquisition, TR = 7.8 ms; TE = 3.0 ms; TI = 450 ms; flip angle, 13°; FOV = 256 mm × 256 mm; matrix = 256 × 256; 180 slices and slice thickness = 1.0 mm. The rs-fMRI and T1 data were preprocessed with the Data Processing Assistant for rs-fMRI toolbox3. The first 5 volumes were excluded for the adaption of the subjects and magnetization stabilization. Slice-timing correction and realignment were performed to remove timing differences and head movement, respectively. The rs-fMRI were co-registered to the structural images and spatially normalized to the MNI template, and each voxel was resampled to 2 × 2 × 2 mm3. Subsequently, the resampled images were smoothed with a 6-mm FWHM isotropic Gaussian kernel, and a linear trend and a bandpass filter were applied thereafter to remove the effects of high-frequency noise. Finally, six motion parameters, the WM and the CSF signal were extracted as covariates to reduce the nonneural signal. We selected 49 atlas regions of the autonomic4 and other functional networks5 (Figure 1). These time signals of preprocessing rs-fMRI data are used as input into the LSTM. LSTMs are a special type of recurrent neural network. We assumed that the 49 ROI of time series reflected independent components of brain network activation and therefore discarded the spatial properties of the data. The LSTM model is learned by the neural network itself and detail described in Figure 2. Our data consist of two separate classes: the RCVS and HC. Therefore, a binary classification process was carried out. To calculate the model’s significance, we used bootstrapping to evaluate the performance of models. Lastly, we presented the results using the receiver operating characteristic (ROC) curve. The ROC curve reflects the sensitivity and specificity of the model. To measure the importance of our ROIs in autonomic and other networks, for each ROI we'll perturb the variable by a random normal distribution centered at 0 with a scale of 10 and compute a new prediction. We'll measure the effect this perturbation has by computing the Root Mean Square difference between the original and new prediction. A larger Root Mean Square difference means that feature is "more important".Results
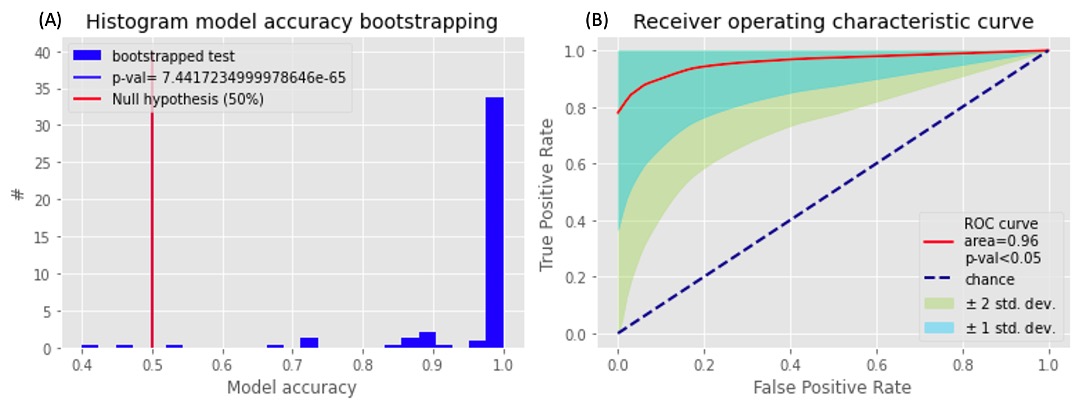
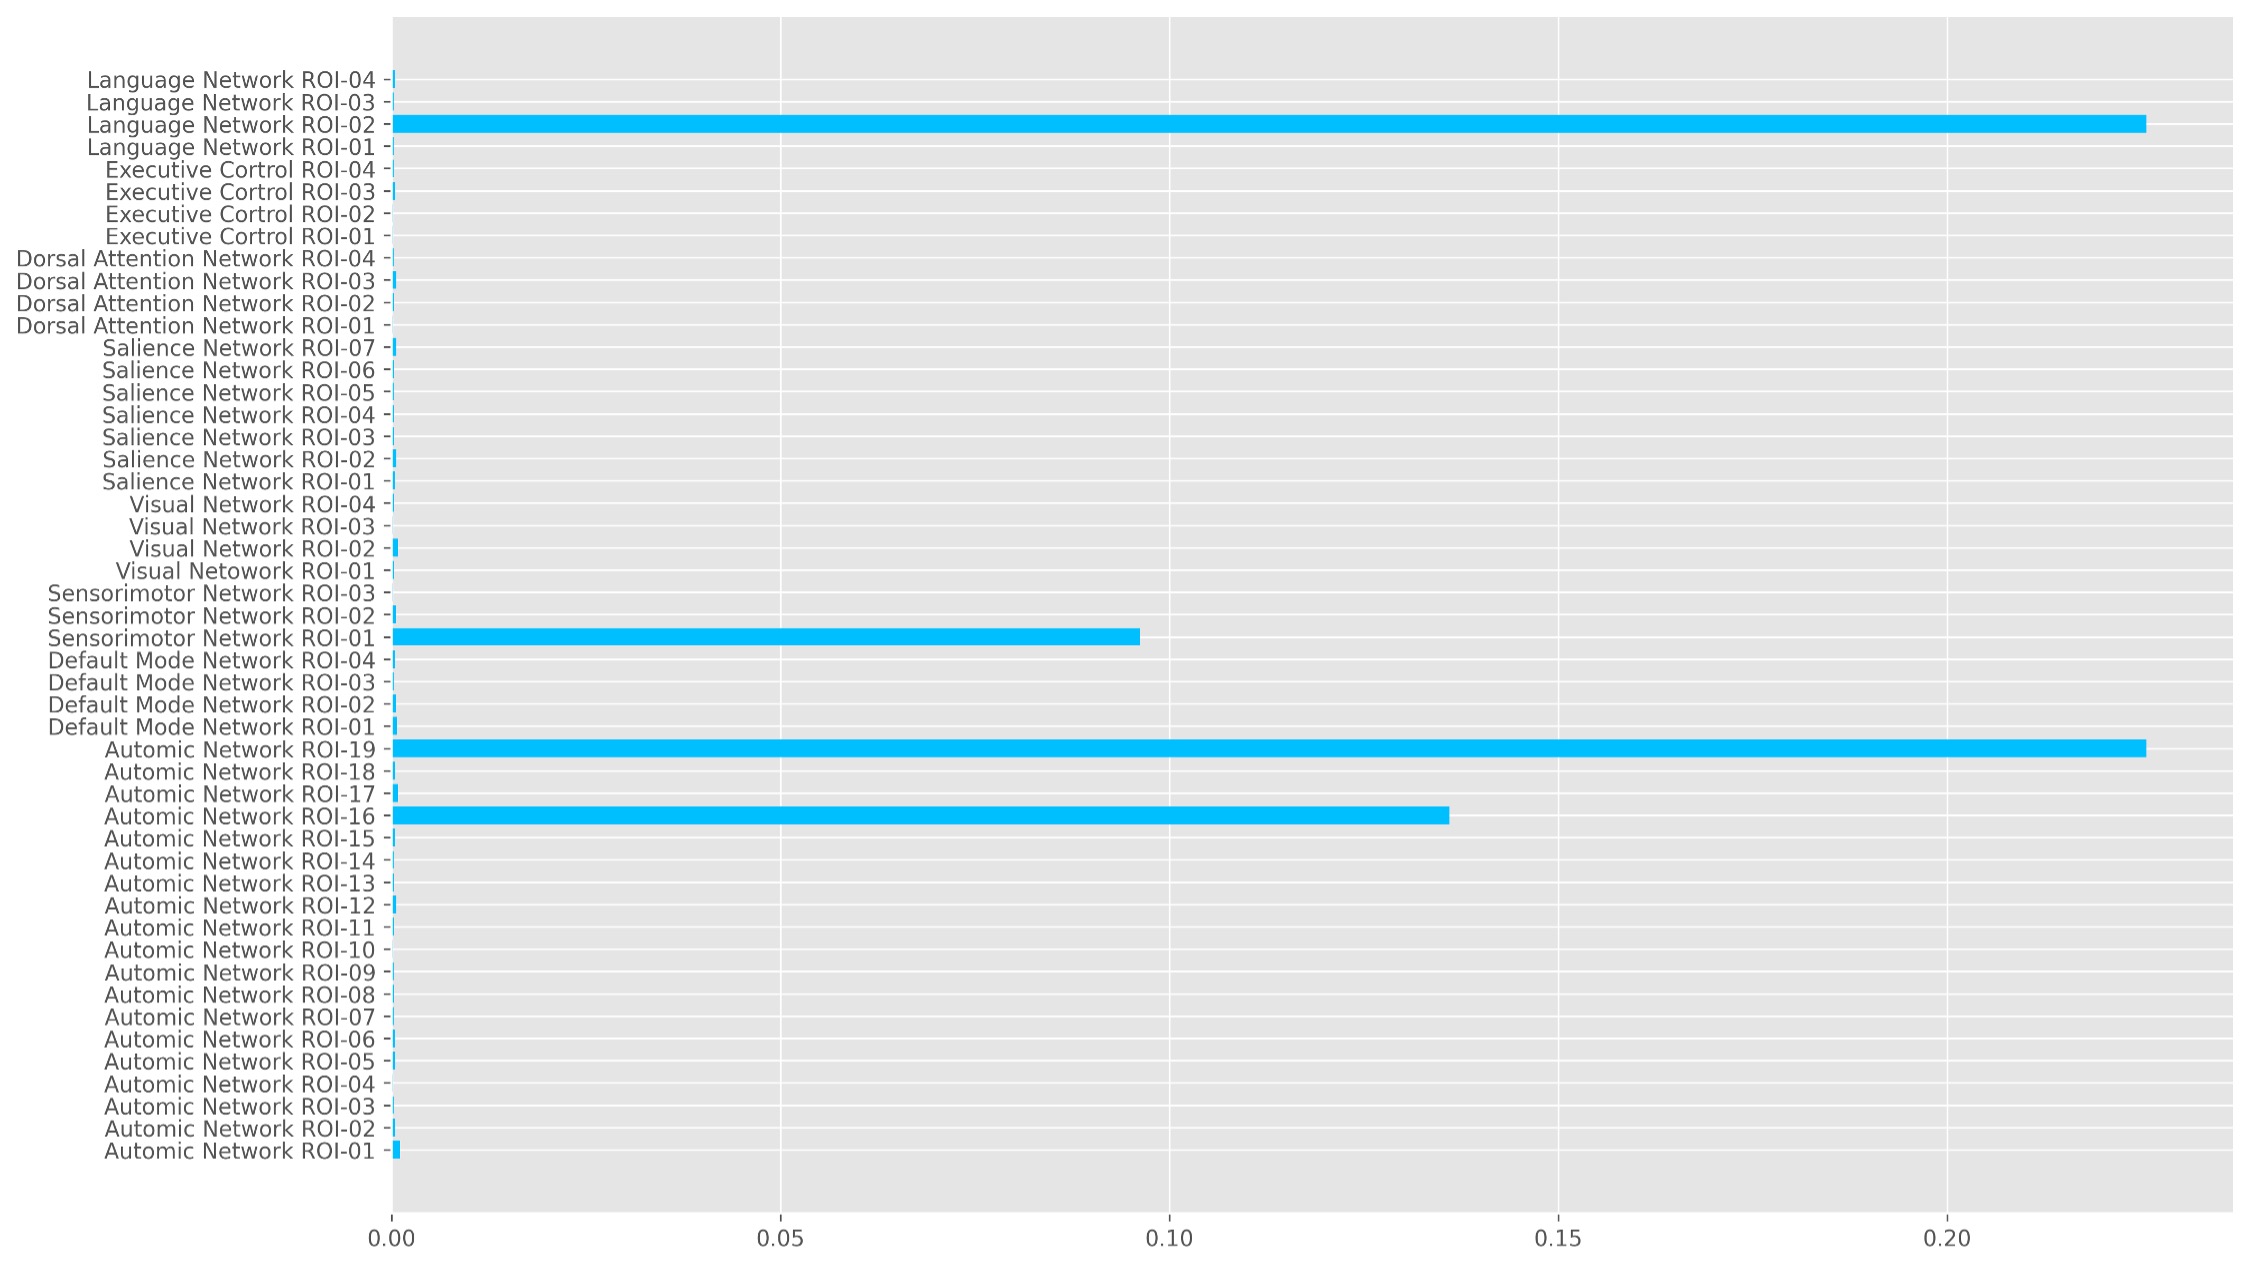
We plot the distribution of the model accuracy with the bootstrapped 100 times results in Figure 3A. Most model accuracy is larger than the probability 50%. We also show the results using the ROC curve in Figure 3B. The ROC curve shows a significant above-average classification capacity. We see that the mean value, as well as one SD around it, is fully placed above the chance diagonal. The 95% confidence intervals (presented by 2 SD around the mean ROC curve) expands are all above the chance diagonal. This means that the model is more likely to express higher sensitivity and specificity and the area under the curve of ROC is 0.96. The key importance of our ROIs in autonomic and other networks to classify RCVS patients and healthy controls is shown in Figure 4. There ROIs are the hypothalamus, periaqueductal gray, lateral sensorimotor cortex, and inferior frontal gyrus. The first two are autonomic networks, and the last two are sensorimotor and language networks.Discussion and Conclusion
The rs-fMRI data provide information about brain functions in temporal and spatial domains. Accordingly, the performances of LSTM (RNN-based models), which are very successful in detecting temporal relations between data. We have built a LSTM model to classify RCVS from HC via rs-fMRI data. The key to classify the RCVS and HC are the hypothalamus, periaqueductal gray, lateral sensorimotor cortex, and inferior frontal gyrus. Two ROIs are related to the autonomic network. These results provide methodological implications for rs-fMRI data of RCVS involved in the analysis and are a key element in future studies.Acknowledgements
No acknowledgement found.References
1. Arrigan, M., M. Heran, and J. Shewchuk, Reversible cerebral vasoconstriction syndrome: an important and common cause of thunderclap and recurrent headaches. Clinical radiology, 2018. 73(5): p. 417-427.
2. Hochreiter, S. and J. Schmidhuber, Long short-term memory. Neural computation, 1997. 9(8): p. 1735-1780.
3. Yan, C.-G., et al., DPABI: data processing & analysis for (resting-state) brain imaging. Neuroinformatics, 2016. 14(3): p. 339-351.
4. Sturm, V.E., et al., Network architecture underlying basal autonomic outflow: evidence from frontotemporal dementia. Journal of Neuroscience, 2018. 38(42): p. 8943-8955.
5. Whitfield-Gabrieli, S. and A. Nieto-Castanon, Conn: a functional connectivity toolbox for correlated and anticorrelated brain networks. Brain connectivity, 20
Figures