0396
Neptune: a toolbox for spinal cord functional MRI data processing and quality assurance1Athinoula A. Martinos Center for Biomedical Imaging, Massachusetts General Hospital, Harvard Medical School, Boston, MA, United States, 2Harvard-Massachusetts Institute of Technology Division of Health Sciences & Technology, Cambridge, MA, United States
Synopsis
Spinal cord fMRI data analysis involves niche pre- and post-processing steps due to the cord’s unique anatomy and higher distortions/physiological noise in fMRI data, requiring extensive and careful quality control (QC). However, there is paucity of open-source tools tailored to this need. Building upon 10 years of research and development, we present Neptune, a user-interface-based MATLAB toolbox. It can perform an array of tailored pre- and post-processing steps, including functional connectivity and statistics. It generates extensive QC plots and presents them to view in an elegant webpage format. We demonstrate the utility of Neptune on a 7T dataset.
Introduction
Functional MRI (fMRI) of the spinal cord has revealed functional impairments in neurological diseases such as multiple sclerosis [1] and pain [2]. It is an emerging field with both fundamental and clinical advancements made over the past decade (e.g., [3]-[9]). The cord differs from the brain in both anatomy and fMRI data quality. It is a narrow cylindrical structure surrounded by bone and moving organs (tongue, throat, heart, lungs), and has considerably higher physiological noise and distortions arising from dynamic B0 inhomogeneities [10]. Spinal cord fMRI data processing is thus highly challenging, requiring extensive data quality assessment at every stage of processing, with a unique blend of pre- and post-processing steps. Despite this niche requirement, most researchers continue to adopt brain fMRI tools because there is paucity of publicly available specialized processing software for cord fMRI.Building upon a decade of software development, we present Neptune, a MATLAB- and AFNI- based [11] open-source research toolbox. The foundation for Neptune was laid in 2012 to process the first ever 7T resting-state (rs) cord fMRI dataset [4]. The pipeline was further refined as a 15-step procedure in 2016 [6]. Neptune builds on this by adding new steps and including a post-processing pipeline to estimate within- and between-slice functional connectivity (FC) and rs-fMRI amplitude (fALFF [12]) along with statistical analysis. More importantly, Neptune has been developed to optimize user experience; it is fully user-interface-based and does not require MATLAB/programming knowledge (command-line options are available). Neptune generates an extensive array of quality control (QC) outputs and presents them to the user in an elegant interface. Here, we briefly present the toolbox and provide FC results from the analysis of a 7T dataset.
Methods
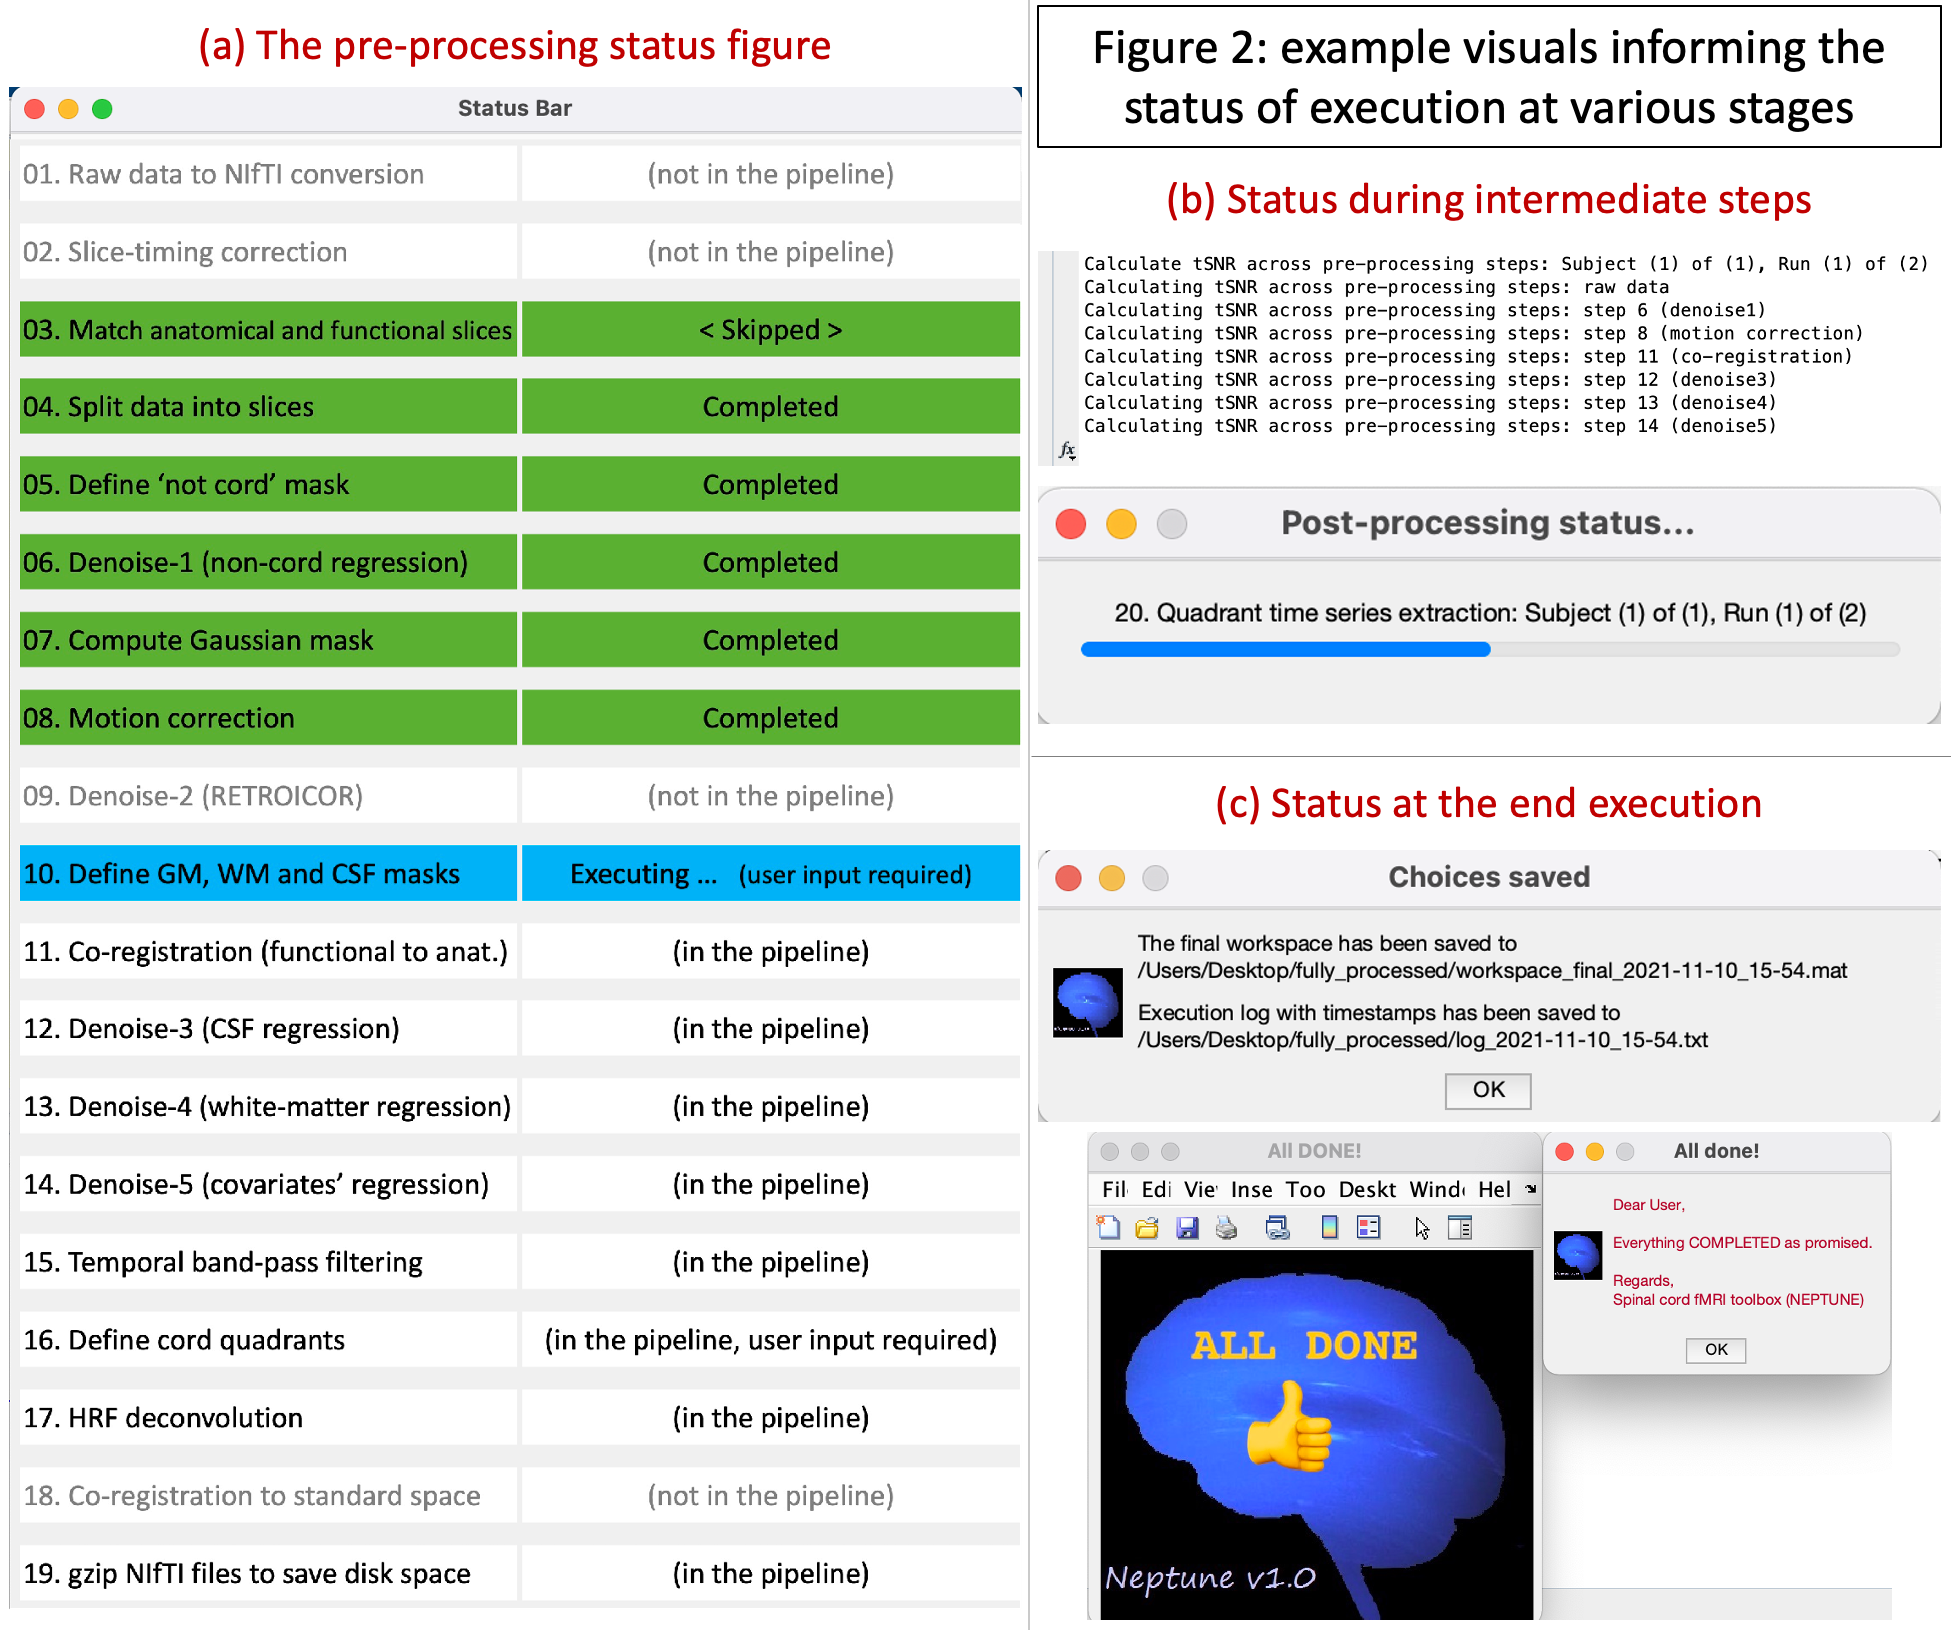
Neptune, a software platform with 31850 lines of in-house MATLAB code, builds upon our published pipeline [6] in the following six ways.(1) It has a 19-step pre-processing pipeline (Fig.2a) that now includes options for dicom-to-NIfTI conversion, slice-timing correction, matching functional and anatomical slices by reslicing, automated estimation of Gaussian cord mask for motion correction, regressing out additional covariates (such as motion parameters and their derivatives, scrubbing variables and user-defined covariates), HRF deconvolution [13]-[14], temporal signal-to-noise ratio (tSNR) computation across pre-processing steps, and lastly reducing disk space usage.
(2) Neptune has a new 4-step post-processing pipeline (Fig.1b) for estimating time series from cord quadrants, estimating Pearson’s or partial correlation-based FC within and between spinal levels, estimating fALFF across the cord and simple statistical analysis.
(3) Neptune is user-interface based, asking the user whenever choices are to be made (Fig.1c), for instance, when the home directory is to be chosen or a bandpass filtering cutoff is required.
(4) Neptune informs the user of processing status (Fig.2) with a novel status bar and command-line outputs. Additionally, Neptune automatically logs every stage of processing and saves it, so the user knows exactly which choices were made, what steps were started and ended at what time, and where files were saved.
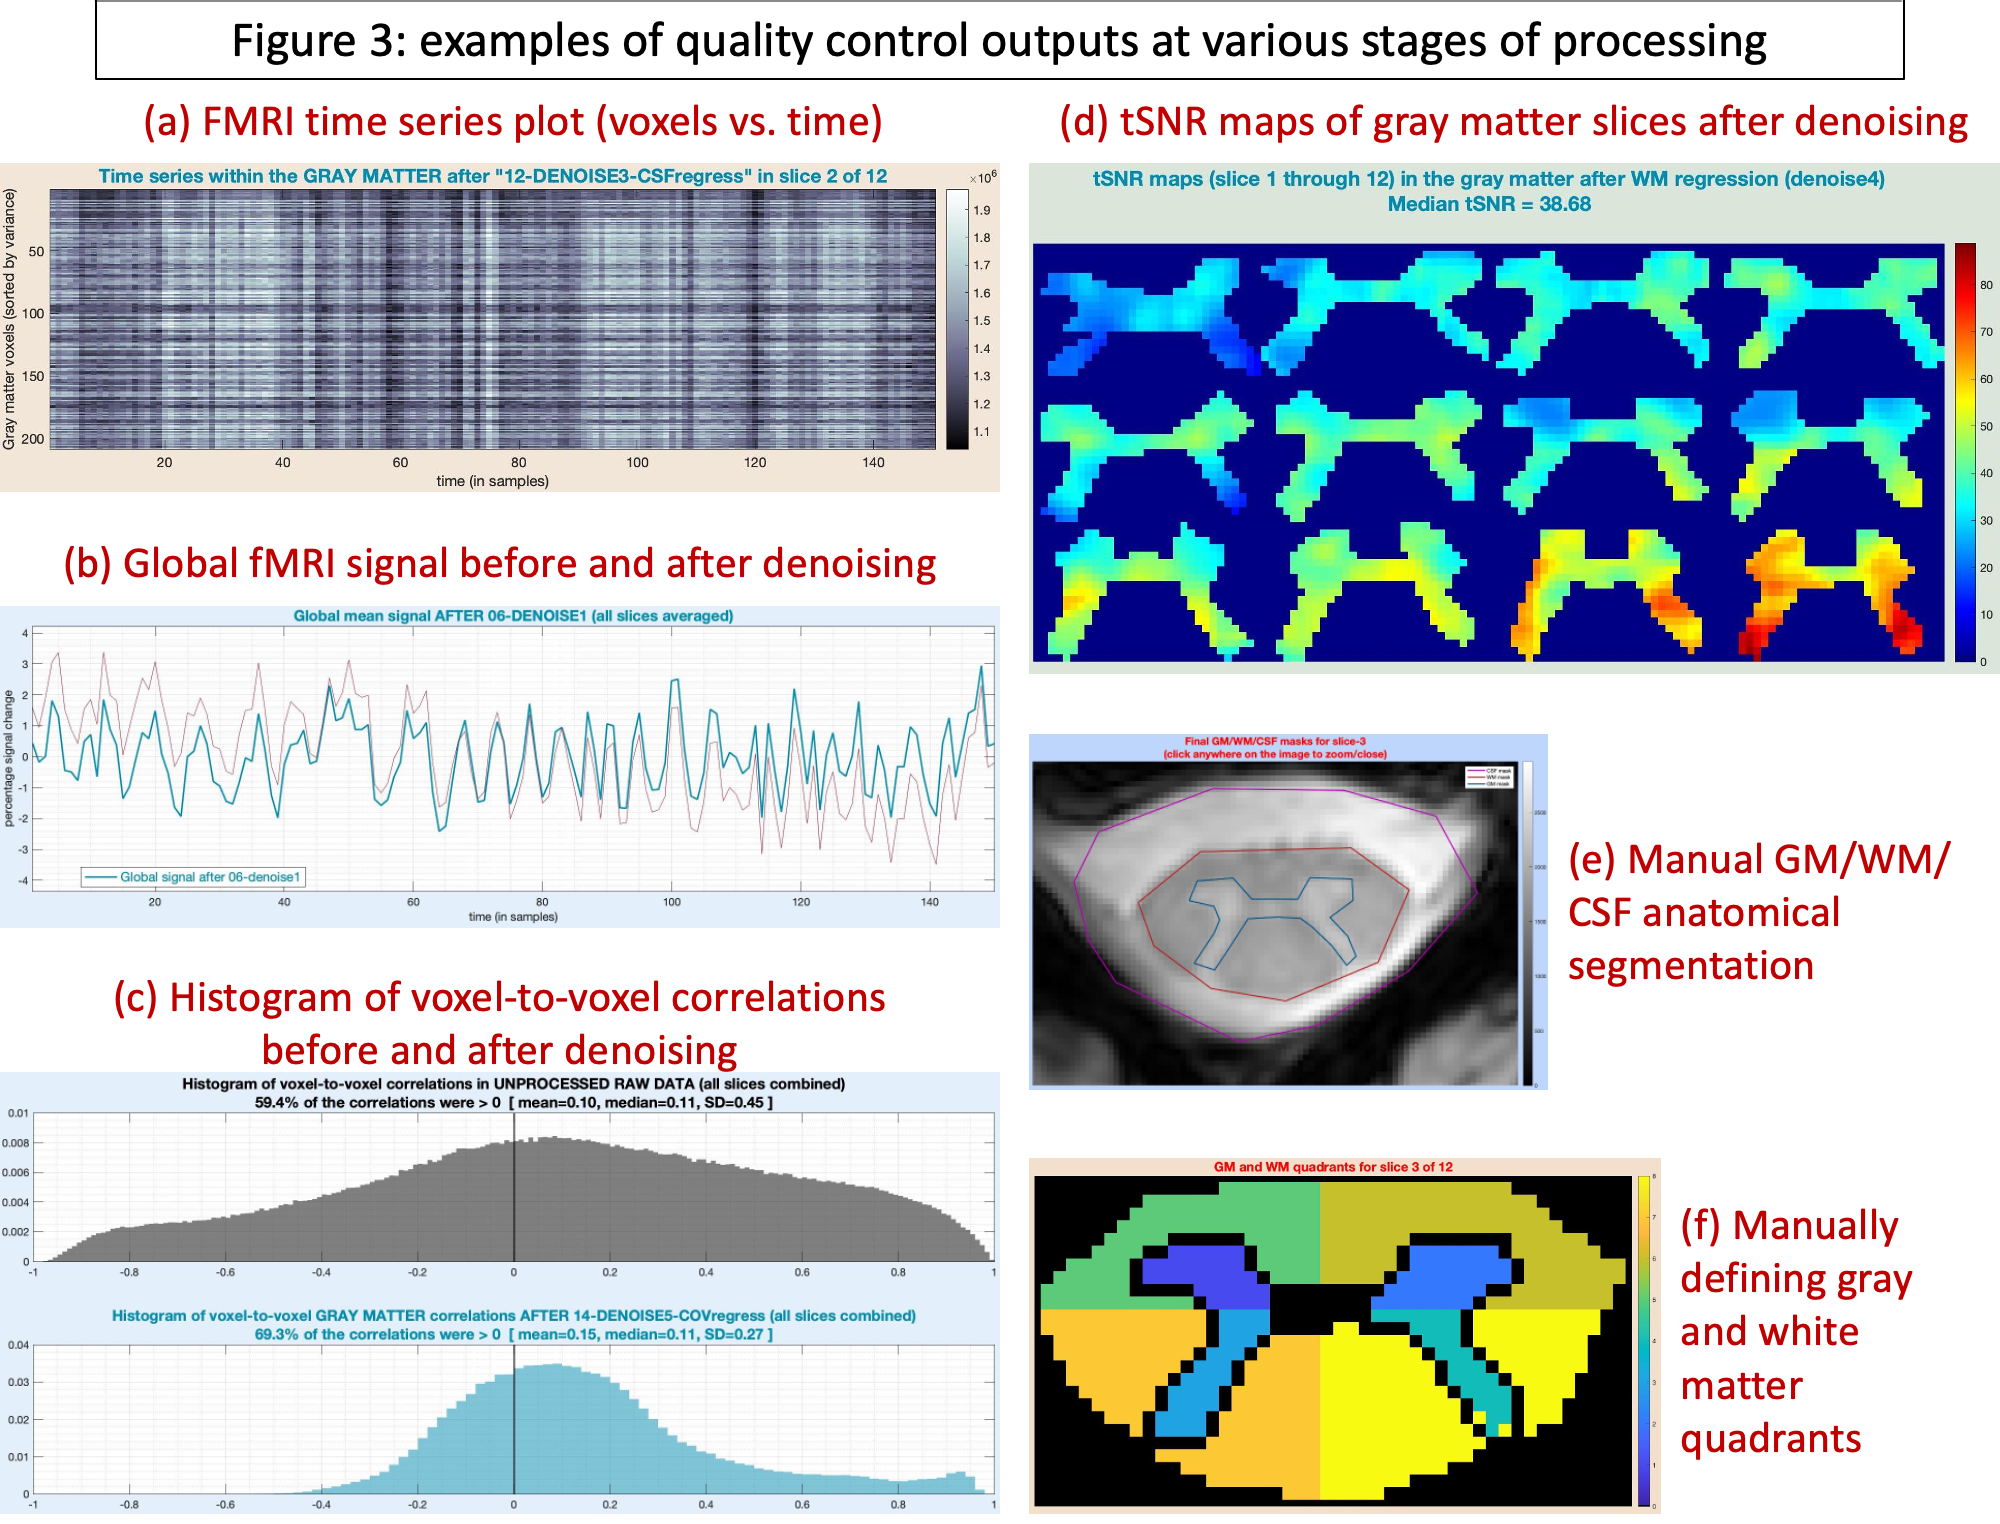
(5) Neptune generates novel QC output visuals at every stage of processing (Fig.3), which educate the user about the nature of their own data and helps in identifying problematic runs.
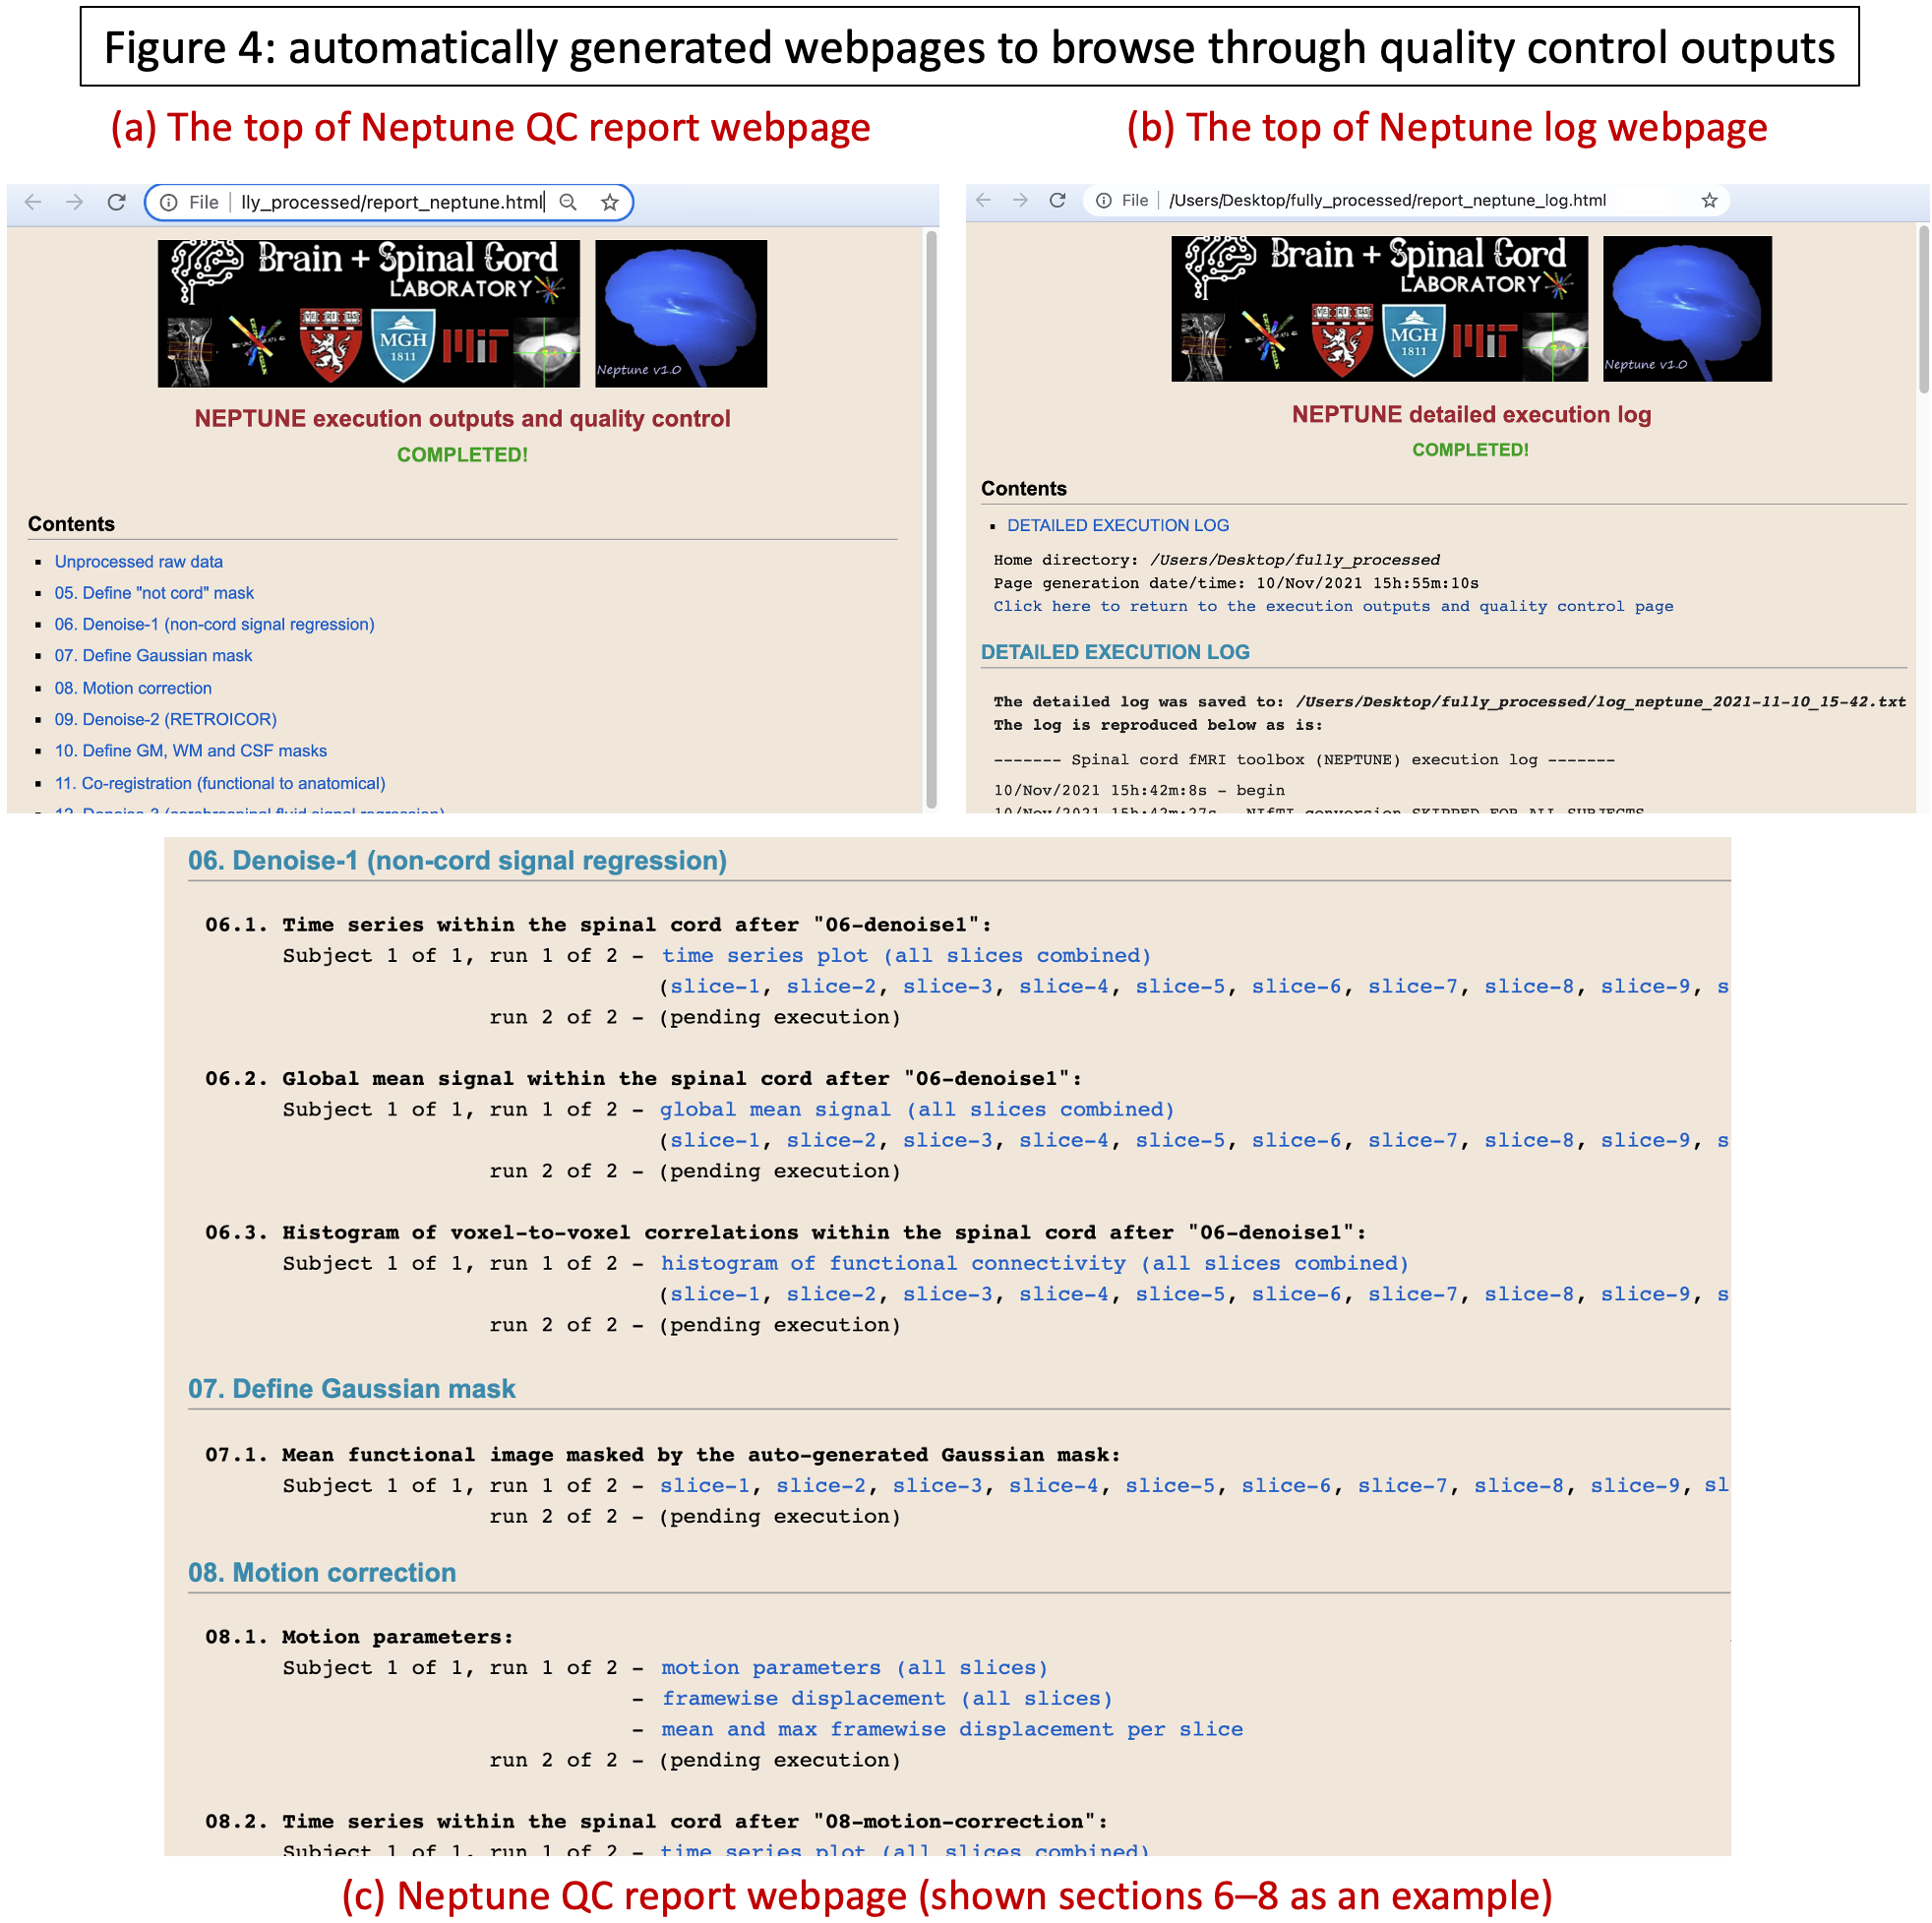
(6) Lastly, Neptune generates a webpage with a novel design at the end of processing (Fig.4) so the user can comfortably browse through all QC outputs in one place.
Although Neptune was built for rs-fMRI data, it is also applicable for task fMRI. The user could choose to perform only part of the processing in Neptune and import/export to other software. We next describe how Neptune was utilized to process a 7T dataset.
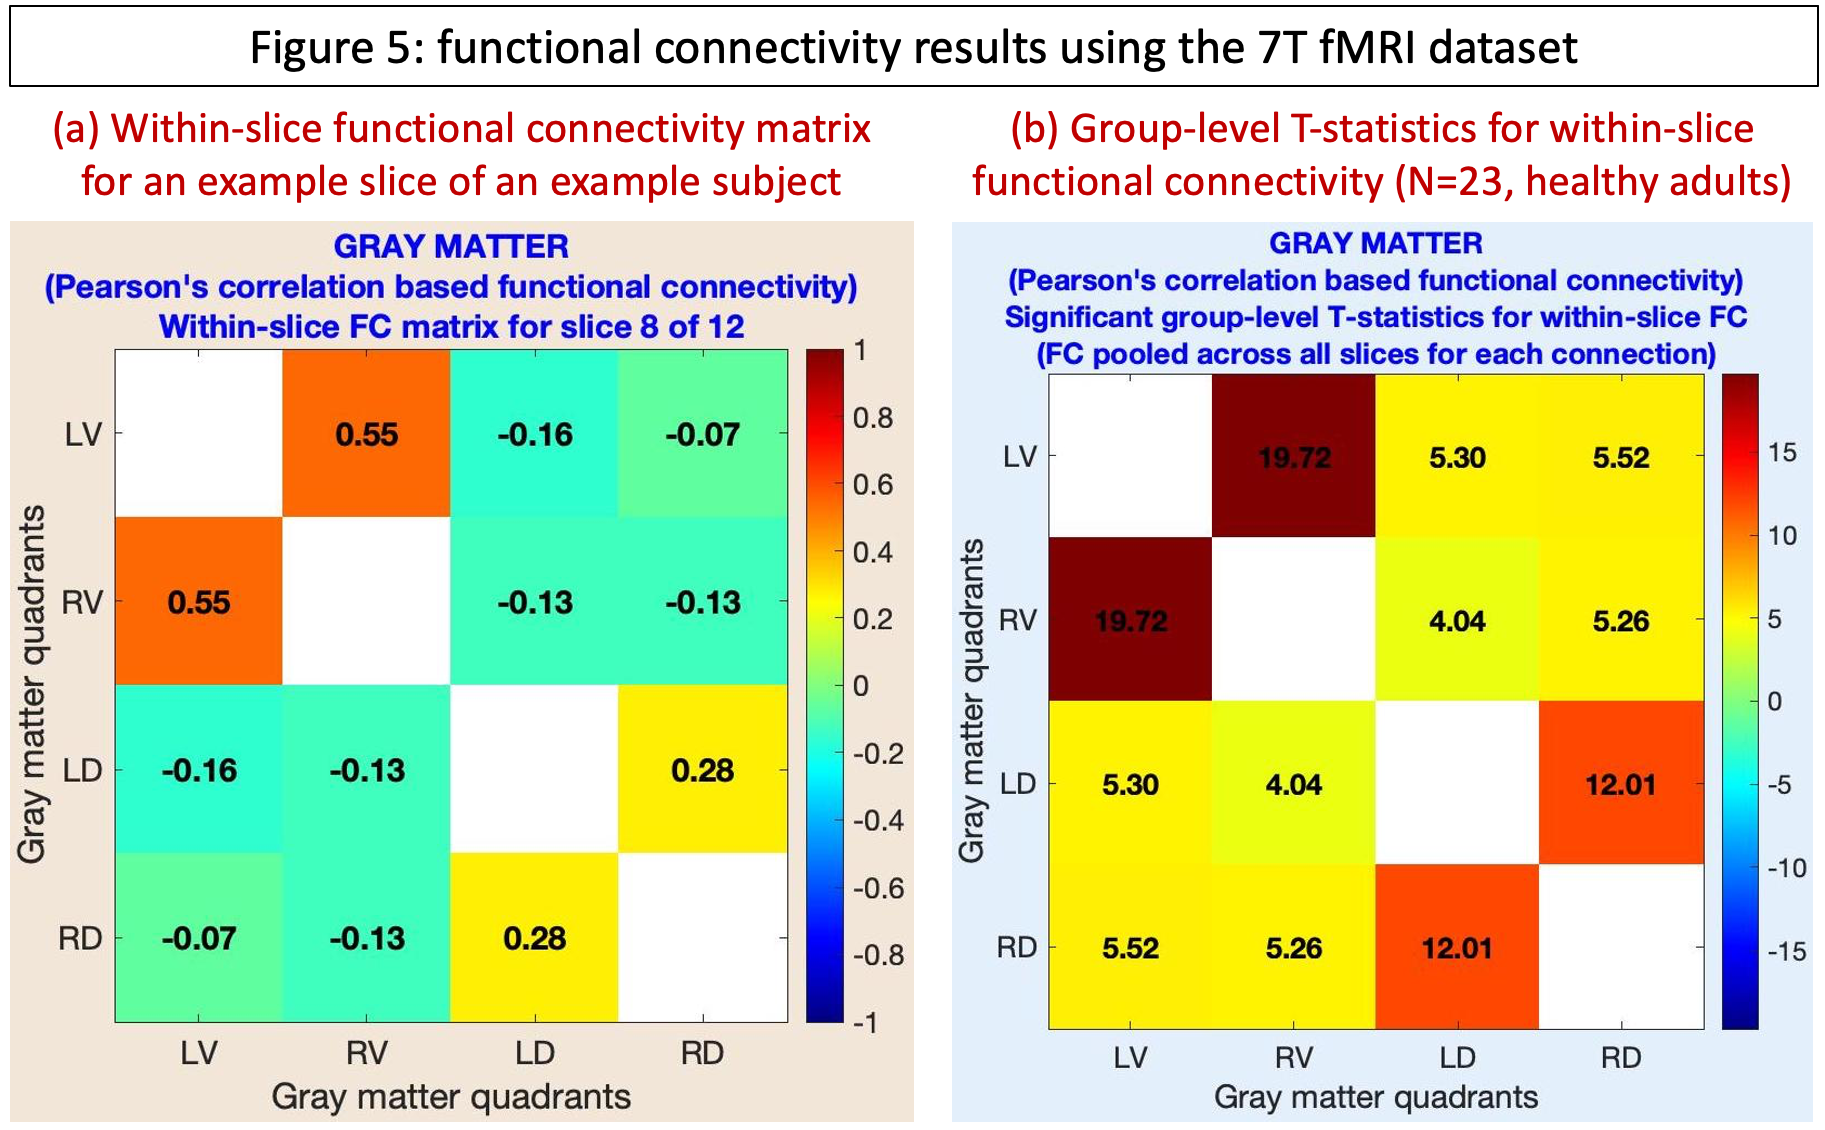
Cervical cord rs-fMRI data were acquired in a Philips Achieva 7T scanner (N=23, healthy, 11M/12F, age=26±4.5y). All participants provided informed consent; scanning was approved by the Vanderbilt University Institutional Review Board (IRB), and data analysis was approved by the Mass General Brigham IRB. Two identical rs-fMRI runs were performed using a 3D gradient-echo sequence (voxel size=0.91×0.91×4mm3, 12 slices, 150 volumes, C2–C5 coverage). Complete acquisition details are in an earlier publication using these data [4]. Data were pre-processed in Neptune (steps 3–16, Fig.1b). Additional denoising covariates were motion parameters (+derivatives) and scrubbing variables with motion>2mm. A 0.01–0.1Hz passband was used for bandpass filtering. HRF deconvolution was not chosen due to poor temporal resolution. Each fMRI slice was divided into four gray-matter quadrants: left(L)/right(R) ventral(V)/dorsal(D) horns, and within-slice FC was computed [15]. For each connection, a one-sample t-test was performed by pooling across all slices and participants (p<0.05, Bonferroni corrected). T-statistics are reported, with the expectation that we will replicate the most robust findings in cord rs-fMRI [4]-[6], which are higher LV–RV and LD–RD FC and lower LV–LD, RV–RD, LV–RD and LD–RV FC.
Results and Discussion
We thoroughly investigated Neptune QC outputs (examples in Fig.3) and found acceptable data quality among all participants. We found the expected pattern of higher T-statistics for LV–RV and LD–RD connections and lower for the rest (Fig.5). Built upon 10 years of research and development, Neptune is a user-friendly and technically-sound niche toolbox for reliable and informed spinal cord fMRI data analysis and interpretation.Acknowledgements
This research was supported by the National Institutes of Health (NIH) through grants R00EB016689, R01EB027779, and R21EB031211. The content is solely the responsibility of the authors and does not necessarily represent the official views of the NIH.References
[1] B. N. Conrad, R. L. Barry, B. P. Rogers, S. Maki, A. Mishra, S. Thukral, S. Sriram, A. Bhatia, S. Pawate, J. C. Gore and S. A. Smith, "Multiple sclerosis lesions affect intrinsic functional connectivity of the spinal cord.," Brain, vol. 141, no. 6, p. 1650–1664, 2018.
[2] K. T. Martucci, K. A. Weber and S. C. Mackey, "Spinal Cord Resting State Activity in Individuals With Fibromyalgia Who Take Opioids.," Frontiers in neurology, vol. 12, p. 694271, 2021.
[3] J. Cohen-Adad, C. J. Gauthier, J. C. Brooks, M. Slessarev, J. Han, J. A. Fisher, S. Rossignol and R. D. Hoge, "BOLD signal responses to controlled hypercapnia in human spinal cord.," NeuroImage, vol. 50, no. 3, p. 1074–1084, 2010.
[4] R. L. Barry, S. A. Smith, A. N. Dula and J. C. Gore, "Resting state functional connectivity in the human spinal cord," eLife, vol. 3, p. e02812, 2014.
[5] Y. Kong, F. Eippert, C. Beckmann and e. al., "Intrinsically organized resting state networks in the human spinal cord," Proc Natl Acad Sci USA., vol. 111, no. 50, p. 18067‐18072, 2014.
[6] R. L. Barry, B. P. Rogers, B. N. Conrad, S. A. Smith and J. C. Gore, "Reproducibility of resting state spinal cord networks in healthy volunteers at 7 Tesla," NeuroImage, vol. 133, p. 31‐40, 2016.
[7] S. Vahdat, A. Khatibi, O. Lungu, J. Finsterbusch, C. Büchel, J. Cohen-Adad, V. Marchand-Pauvert and J. Doyon, "Resting-state brain and spinal cord networks in humans are functionally integrated.," PLoS biology, vol. 18, no. 7, p. e3000789, 2020.
[8] H. Islam, C. Law, K. A. Weber, S. C. Mackey and G. H. Glover, "Dynamic per slice shimming for simultaneous brain and spinal cord fMRI.," Magnetic resonance in medicine, vol. 81, no. 2, p. 825–838, 2019.
[9] J. Finsterbusch, C. Sprenger and C. Büchel, "Combined T2*-weighted measurements of the human brain and cervical spinal cord with a dynamic shim update.," NeuroImage, vol. 79, p. 153–161, 2013.
[10] R. L. Barry, S. J. Vannesjo, S. By, J. C. Gore and S. A. Smith, "Spinal cord MRI at 7T.," NeuroImage, vol. 168, pp. 437-451, 2018.
[11] C. R. W., "AFNI: software for analysis and visualization of functional magnetic resonance neuroimages.," Computers and biomedical research, vol. 29, no. 3, p. 162–173, 1996.
[12] R. Tadayonnejad, S. Yang, A. Kumar and O. Ajilore, "Clinical, cognitive, and functional connectivity correlations of resting-state intrinsic brain activity alterations in unmedicated depression," Journal of Affective Disorders, vol. 172, pp. 241-50, 2015.
[13] G. R. Wu, W. Liao, S. Stramaglia, J. R. Ding, H. Chen and D. Marinazzo, "A blind deconvolution approach to recover effective connectivity brain networks from resting state fMRI data," Medical Image Analysis, vol. 17, no. 3, pp. 365-374, 2013.
[14] D. Rangaprakash, G.-R. Wu, D. Marinazzo, X. Hu and G. Deshpande, "Hemodynamic response function (HRF) variability confounds resting-state fMRI functional connectivity," Magnetic Resonance in Medicine, vol. 80, no. 4, pp. 1697-1713, 2018.
[15] R. L. Barry, B. N. Conrad, S. A. Smith and J. C. Gore, "A practical protocol for measurements of spinal cord functional connectivity," Scientific Reports, vol. 8, no. 1, p. 16512, 2018.
Figures