0395
Measuring Spinal Cord Blood Flow with Multi-delay pseudo Continuous Arterial Spinal Labeling (pCASL)1Laboratory of Functional MRI Technology (LOFT), Stevens Neuroimaging and Informatics Institute, University of Southern California, Los Angeles, CA, United States
Synopsis
The purpose of this study was to measure the spinal cord blood flow using high-resolution multi-delay pCASL. An optimized background suppression scheme was applied to suppress the cerebrospinal fluid signal. In-vivo study was performed on 5 healthy subjects. The results show stable cervical spinal cord (C1-C3) blood flow values within the spinal cord ROI, supporting the potential for further development and evaluation studies on noninvasive MRI of spinal cord perfusion.
Introduction
Measuring spinal cord blood flow (SCBF) plays an important role in studying normal spinal cord function and diagnosing spinal cord injuries. Perfusion imaging including Arterial Spinal Labeling (ASL) has been successfully applied to measuring cerebral blood flow (CBF) of human brains. A few preclinical studies1,2 have investigated spinal cord blood flow with ultra-high field MRI in animals. However, few studies have applied ASL to studying spinal cord perfusion in humans. In this study, we optimized multi-delay pCASL to measure cervical spinal cord blood flow on healthy humans.Methods
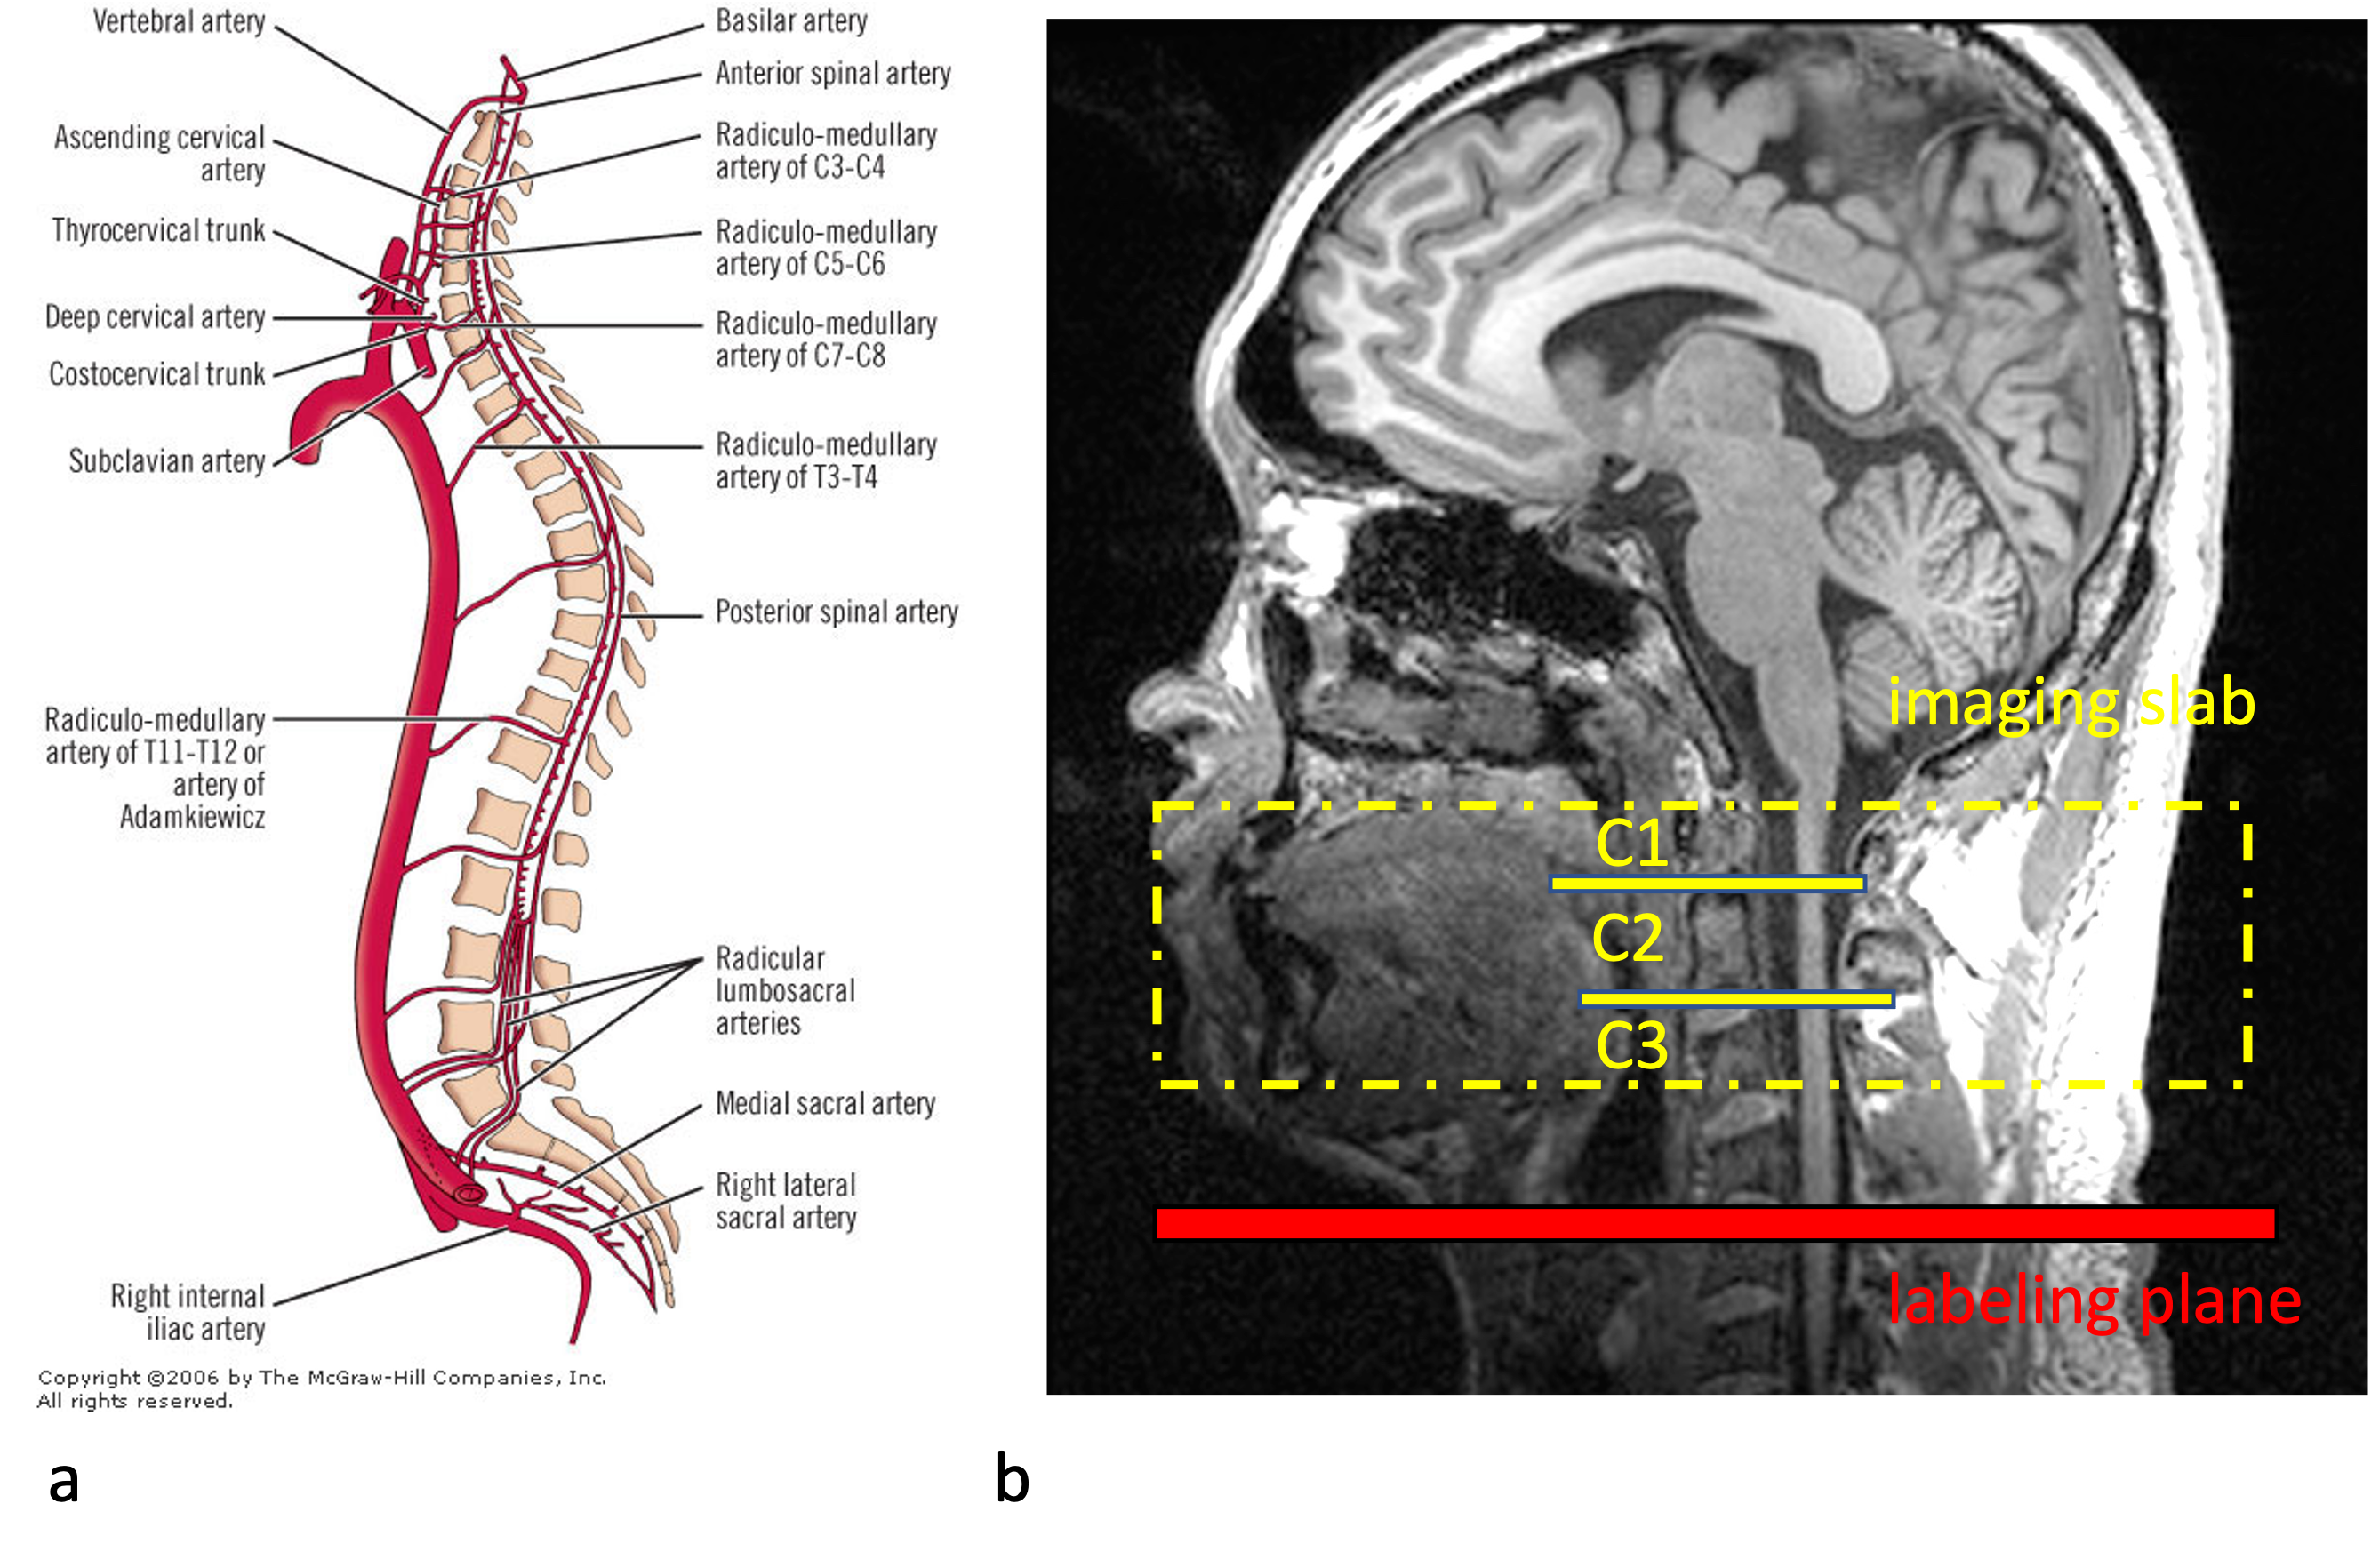
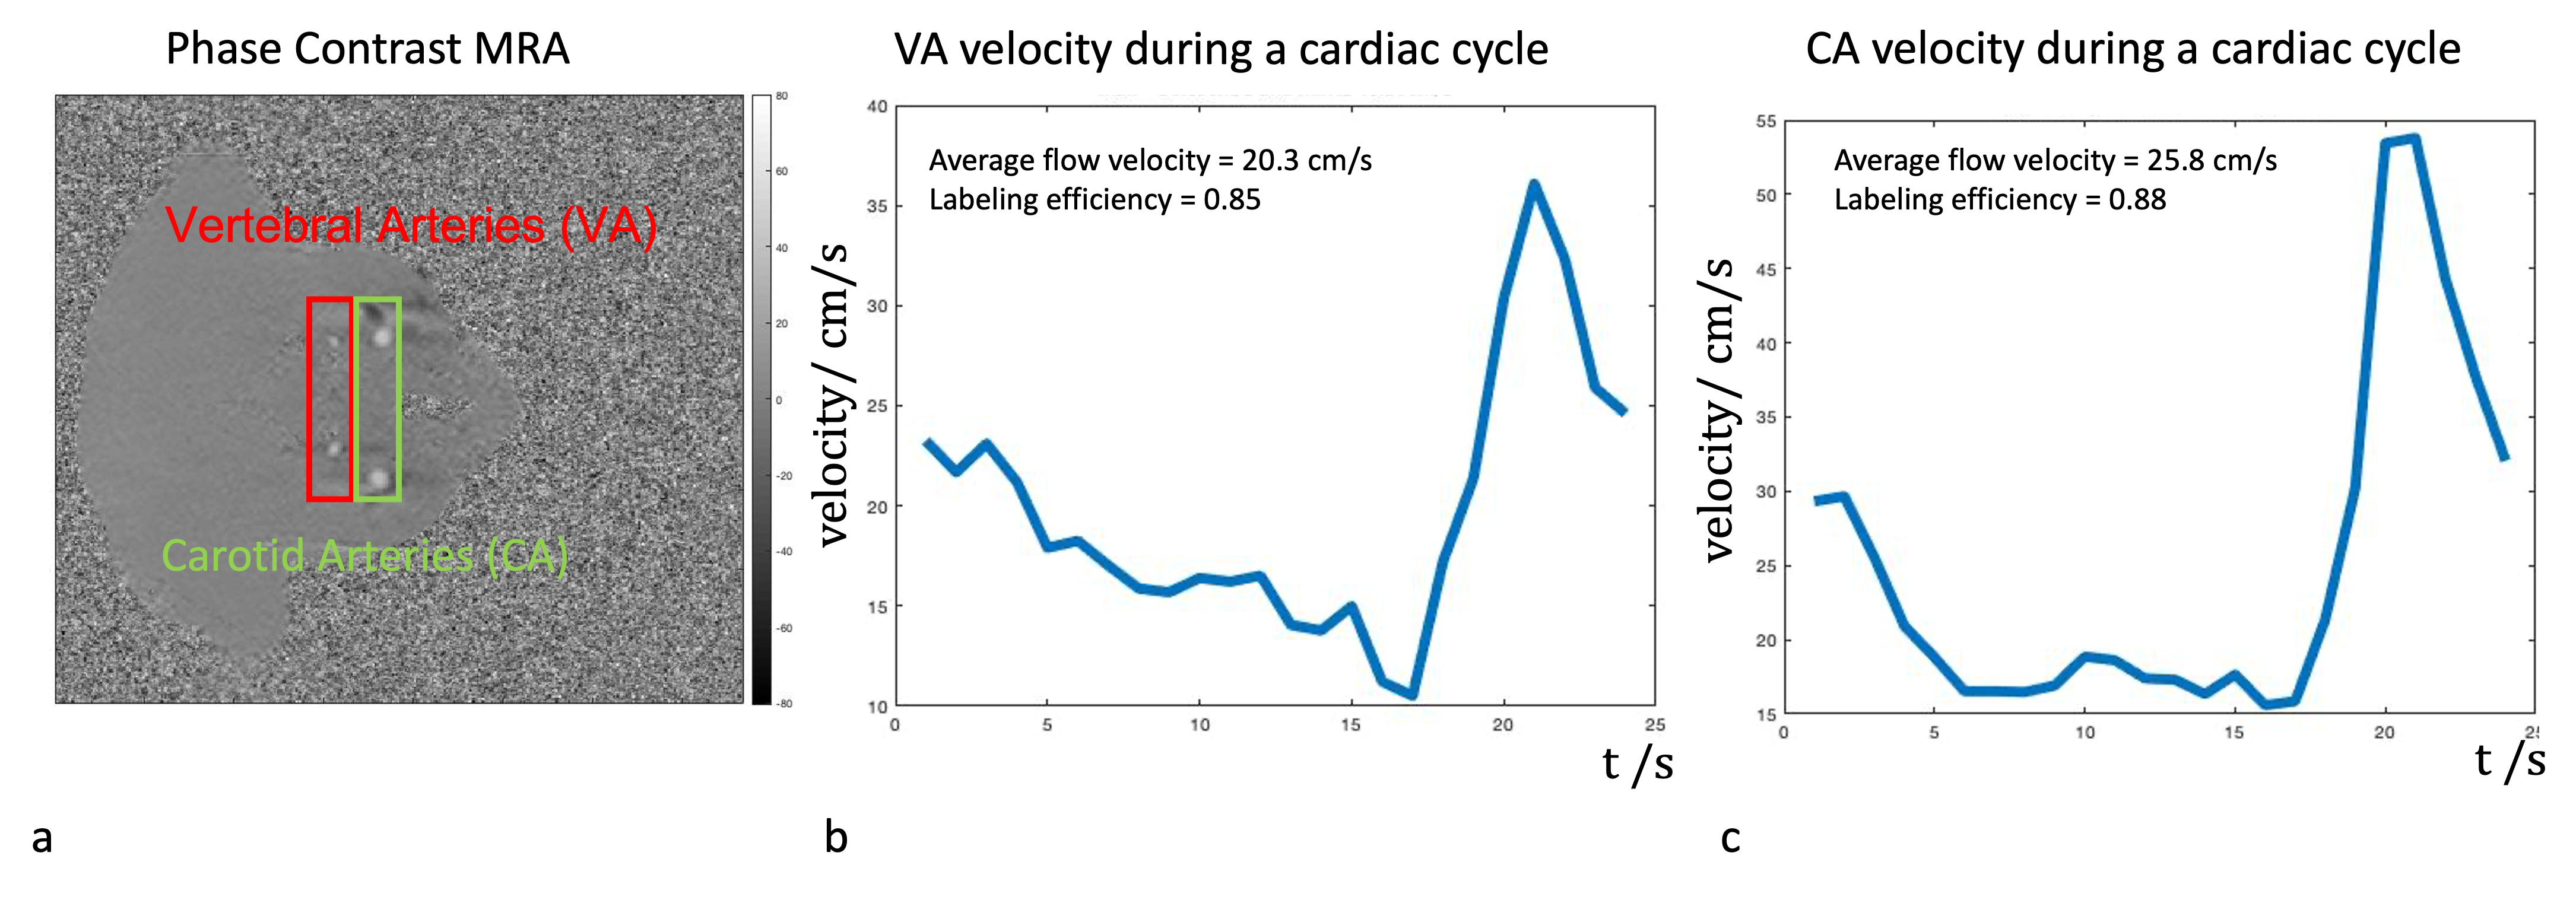
1. Labeling position selectionFigure 1a shows the anatomical structure and blood supply on each level of the spinal cord. In this study, we focused on cervical levels, especially C1 to C3 segments, where the main blood supply is from vertebral arteries, which branch into anterior and posterior spinal arteries and radiculo-medullary arteries. In other words, there are 2 blood supplies to the spinal cord, one vertical from anterior and posterior spinal arteries and another horizontal from radiculo-medullary arteries. Figure 1b shows the imaging slab and the labeling plane that was placed 50-60mm below the center of imaging slab. Figure 2 shows the phase-contrast image in the labeling plane and the flow velocity both in the vertebral arteries (VA) and carotid arteries (CA). The mean flow velocities in VA were lower than in CA (31.1±4.9cm/sec in CA and 20.3±1.4cm/sec in VA), resulting in slightly reduced labeling efficiency (0.90±0.01 in CA and 0.85±0.01 in VA).
2. Modification of pCASL protocol
Since the spinal cord is surrounded by cerebrospinal fluid (CSF) with pulsatile flow that may influence perfusion signals, the background suppression module of the sequence was optimized3 to suppress CSF signals rather than tissues. The T1 range of the CSF was assumed to be 4200-4600ms according to literature4,5.
3. In-vivo experiments
Data was collected on 5 healthy subjects (age=26±1.9years, 5 males) on a Siemens 3T Prisma scanner with 32-channel head coil and spinal array. The parameters for multi-delay pCASL included in-plane resolution of 2×2mm2, FOV=96×96, TR=4000ms, TE=20ms, 24 slices of 2mm thickness. The labeling duration was 1500ms and 10 post labeling delays (PLDs) were evenly spaced between 500ms and 2500ms with 2 measurements at each PLD. The total perfusion scan time was about 10 minutes. M0 image was acquired with no background suppression. RESOLVE diffusion MRI (1×1×2 mm3) was used to visualize the gray and white matter contrast for segmentation in the spinal cord. A single-slice pulse-triggered phase-contrast MRI was acquired on the labeling plane to measure the flow velocity of arteries.
4. Data processing and quantification
The SCBF and arterial transit time (ATT) maps were fitted pixel by pixel using the dynamic model proposed by6. The spinal cord ROI was selected manually on the diffusion image using ITK-SNAP software. The diffusion image and ROI mask were then coregistered to the M0 image using SPM12.
Results
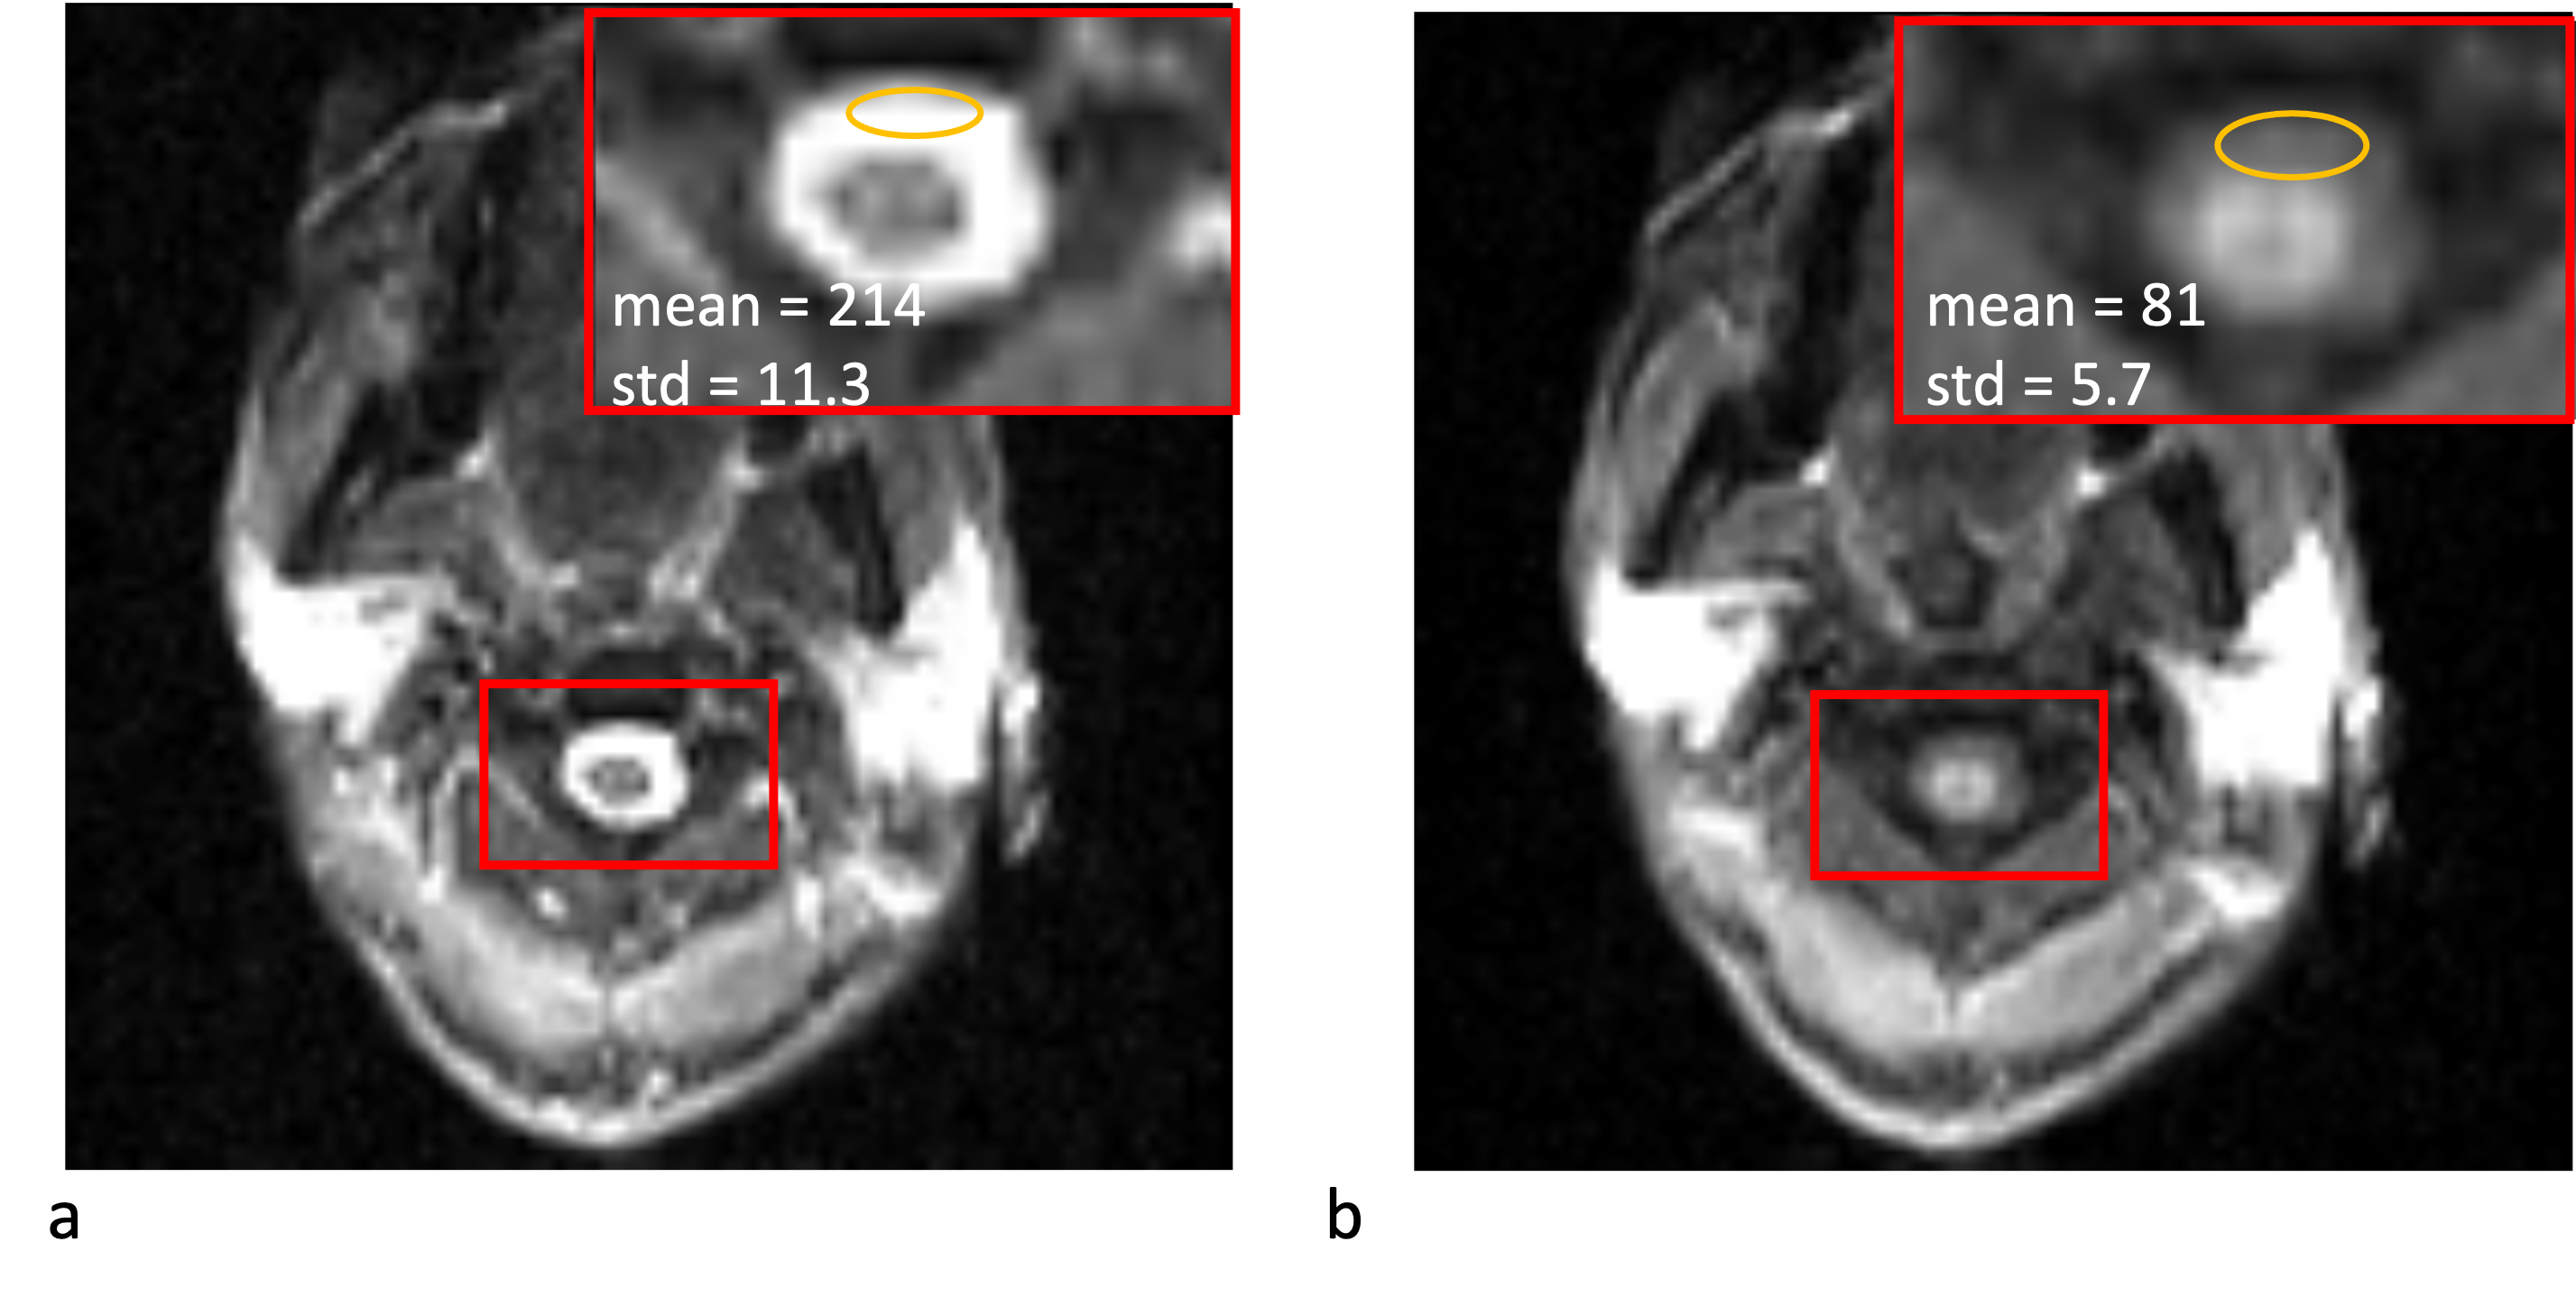
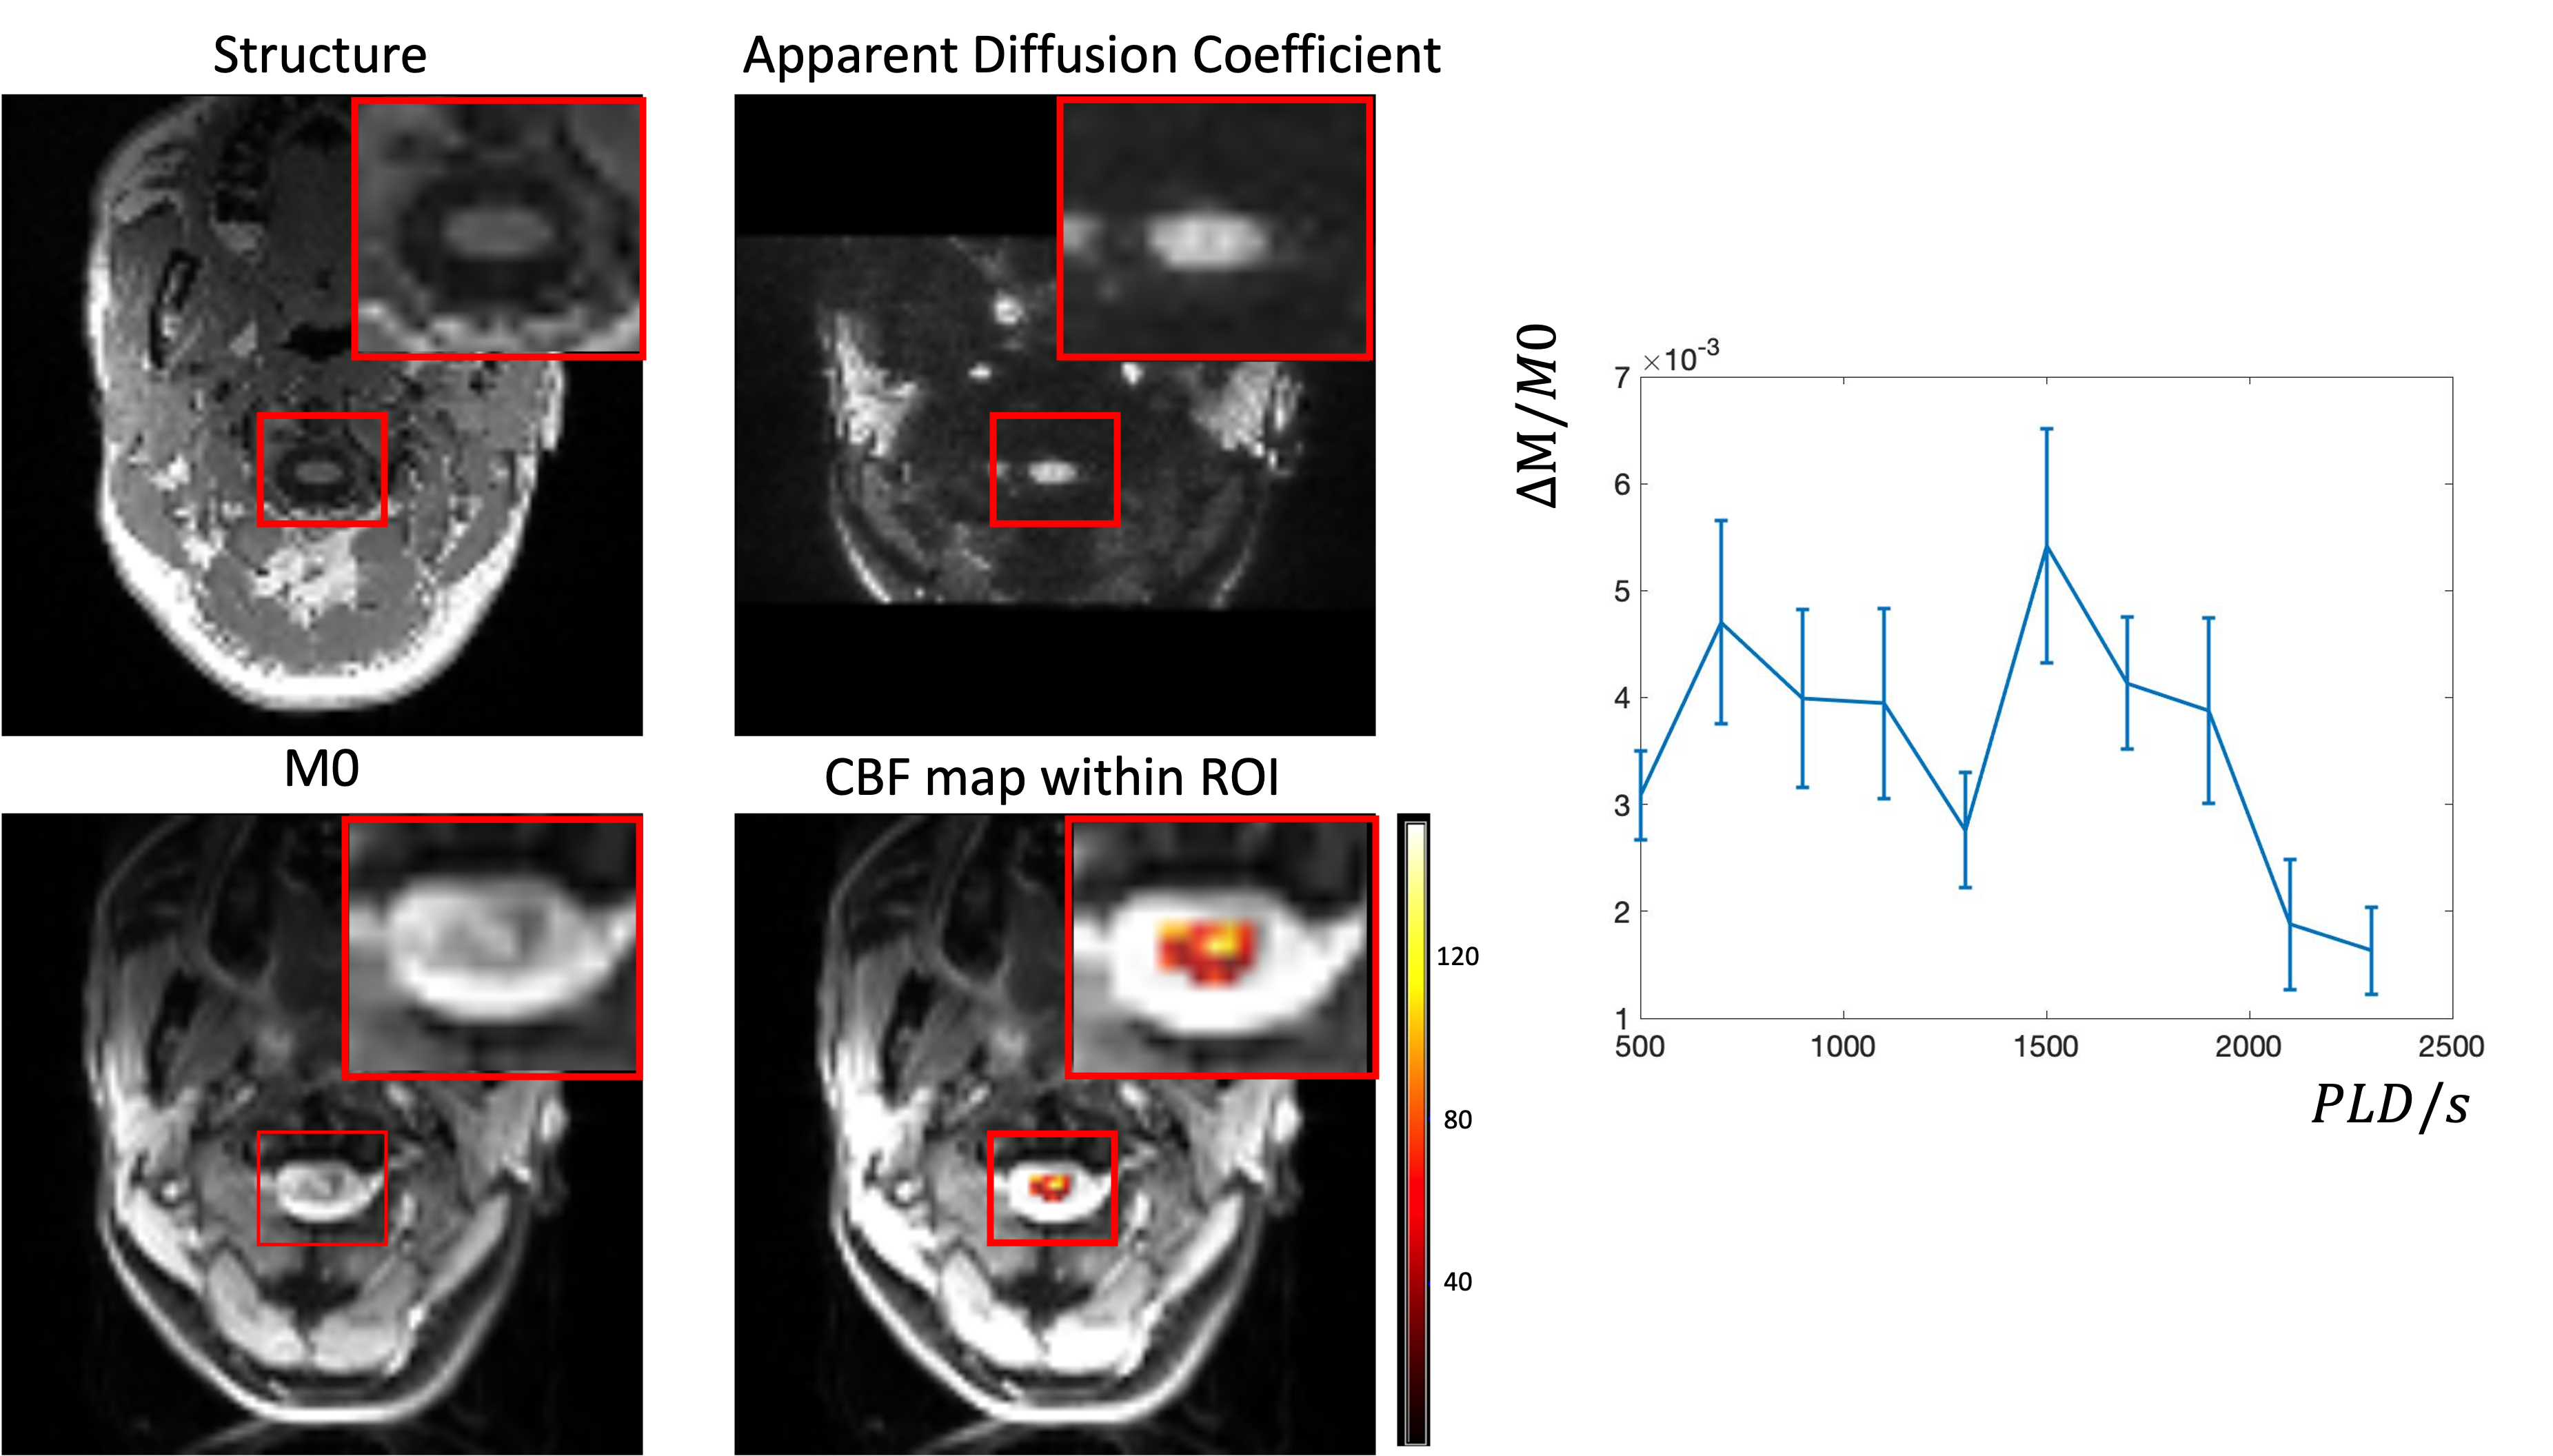
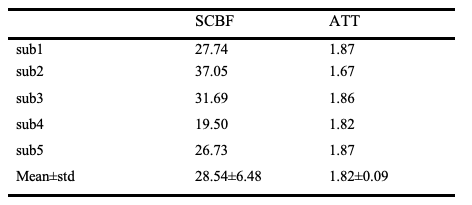
Figure 3 shows the comparison of regular ASL sequence with background suppression of brain tissue and the modified sequence to suppression CSF. With modified background suppression, reduced CSF signal and less distortion can be observed in spinal cord regions. Figure 4a shows the structure image, apparent diffusion coefficient (ADC) image, M0 image and the fitted SCBF map within the ROI. The structural image shows a clear contour of the spinal cord, and the ADC image shows gray and white matter contrast. Table 1 shows the quantification of SCBF and ATT of the 5 subjects within the spinal cord ROI. The fitted SCBF and ATT values are stable and are close to the CBF and ATT values of the white matter in the brain.Discussion
In this study, multi-delay pCASL was optimized to measure perfusion of the cervical spinal cord (C1-3). The measured SCBF and ATT values are comparable to those of the white matter in human brain. However, there are a few limitations. Firstly, since the voxel size is still coarse given the small size of the spinal cord (~1cm). This will lead to partial volume of gray and white matter, and signal contamination from surround CSF even with improved background suppression. Secondly, we found two peaks in the perfusion time series and this pattern is stable across subjects (Fig. 4b). It may be that the first peak is from blood supply through radiculo-medullary arteries, while the second peak reflects the blood supply from anterior and posterior spinal arteries, which takes longer to reach the spinal cord. This requires further investigation and may require a quantification model that considers dual blood supplies.Conclusion
In this study, we used multi-delay pCASL to measure SCBF at cervical levels and achieved reasonable SCBF values. Higher resolution is desired to get less partial volume effects and better gray and white matter contrast. The initial results suggest that ASL measurement of spinal cord perfusion at cervical level is feasible, and further developments of imaging protocol and quantification model are required for accurate quantification of SCBF, as well as to expand the technique to thoracic and lumbar segments.Acknowledgements
No acknowledgement found.References
1. Duhamel, Guillaume, et al. "Spinal cord blood flow measurement by arterial spin labeling." Magnetic Resonance in Medicine: An Official Journal of the International Society for Magnetic Resonance in Medicine 59.4 (2008): 846-854.
2. Meyer Briana, et al. “Preclinical Spinal Cord Perfusion Imaging with Pseudo-Continuous Arterial Spin Labeling.” Proc. Intl. Soc. Mag. Reson. Med. 28 (2020)
3. Maleki, Nasim, Weiying Dai, and David C. Alsop. "Optimization of background suppression for arterial spin labeling perfusion imaging." Magnetic Resonance Materials in Physics, Biology and Medicine 25.2 (2012): 127-133.
4. Lu, Hanzhang, et al. "Routine clinical brain MRI sequences for use at 3.0 Tesla." Journal of Magnetic Resonance Imaging: An Official Journal of the International Society for Magnetic Resonance in Medicine 22.1 (2005): 13-22.
5. Shin, Wanyong, Hong Gu, and Yihong Yang. "Fast high‐resolution T1 mapping using inversion‐recovery Look‐Locker echo‐planar imaging at steady state: optimization for accuracy and reliability." Magnetic Resonance in Medicine: An Official Journal of the International Society for Magnetic Resonance in Medicine 61.4 (2009): 899-906.
6. Buxton, Richard B., et al. "A general kinetic model for quantitative perfusion imaging with arterial spin labeling." Magnetic resonance in medicine 40.3 (1998): 383-396.
Figures