0392
Identifying diffusion model biomarkers for inflammation in human traumatic spinal cord injury1International Collaboration on Repair Discoveries (ICORD), Vancouver, BC, Canada, 2Physics & Astronomy, University of British Columbia, Vancouver, BC, Canada, 3Radiology, University of British Columbia, Vancouver, BC, Canada, 4Faculty of Medicine, UBC MRI Research Centre, Vancouver, BC, Canada, 5Pathology & Laboratory Medicine, University of British Columbia, Vancouver, BC, Canada, 6Vancouver General Hospital, Vancouver, BC, Canada, 7Orthopaedics, University of British Columbia, Vancouver, BC, Canada
Synopsis
We investigated the relationship between diffusion model biomarkers and inflammatory cells, as measured by HLA-DR and CD68 histological staining for activated microglia and macrophages, after human traumatic spinal cord injury. Fractional anisotropy decreases and radial and mean diffusivity increases were strongly correlated with the presence of activated microglia and macrophages. ActiveAx-derived intra-cellular volume fraction and axon density decreased while axon diameter increased. Fiber fraction from Diffusion Basis Spectrum Imaging decreased and while hindered fraction increased in the presence of inflammation.
Introduction
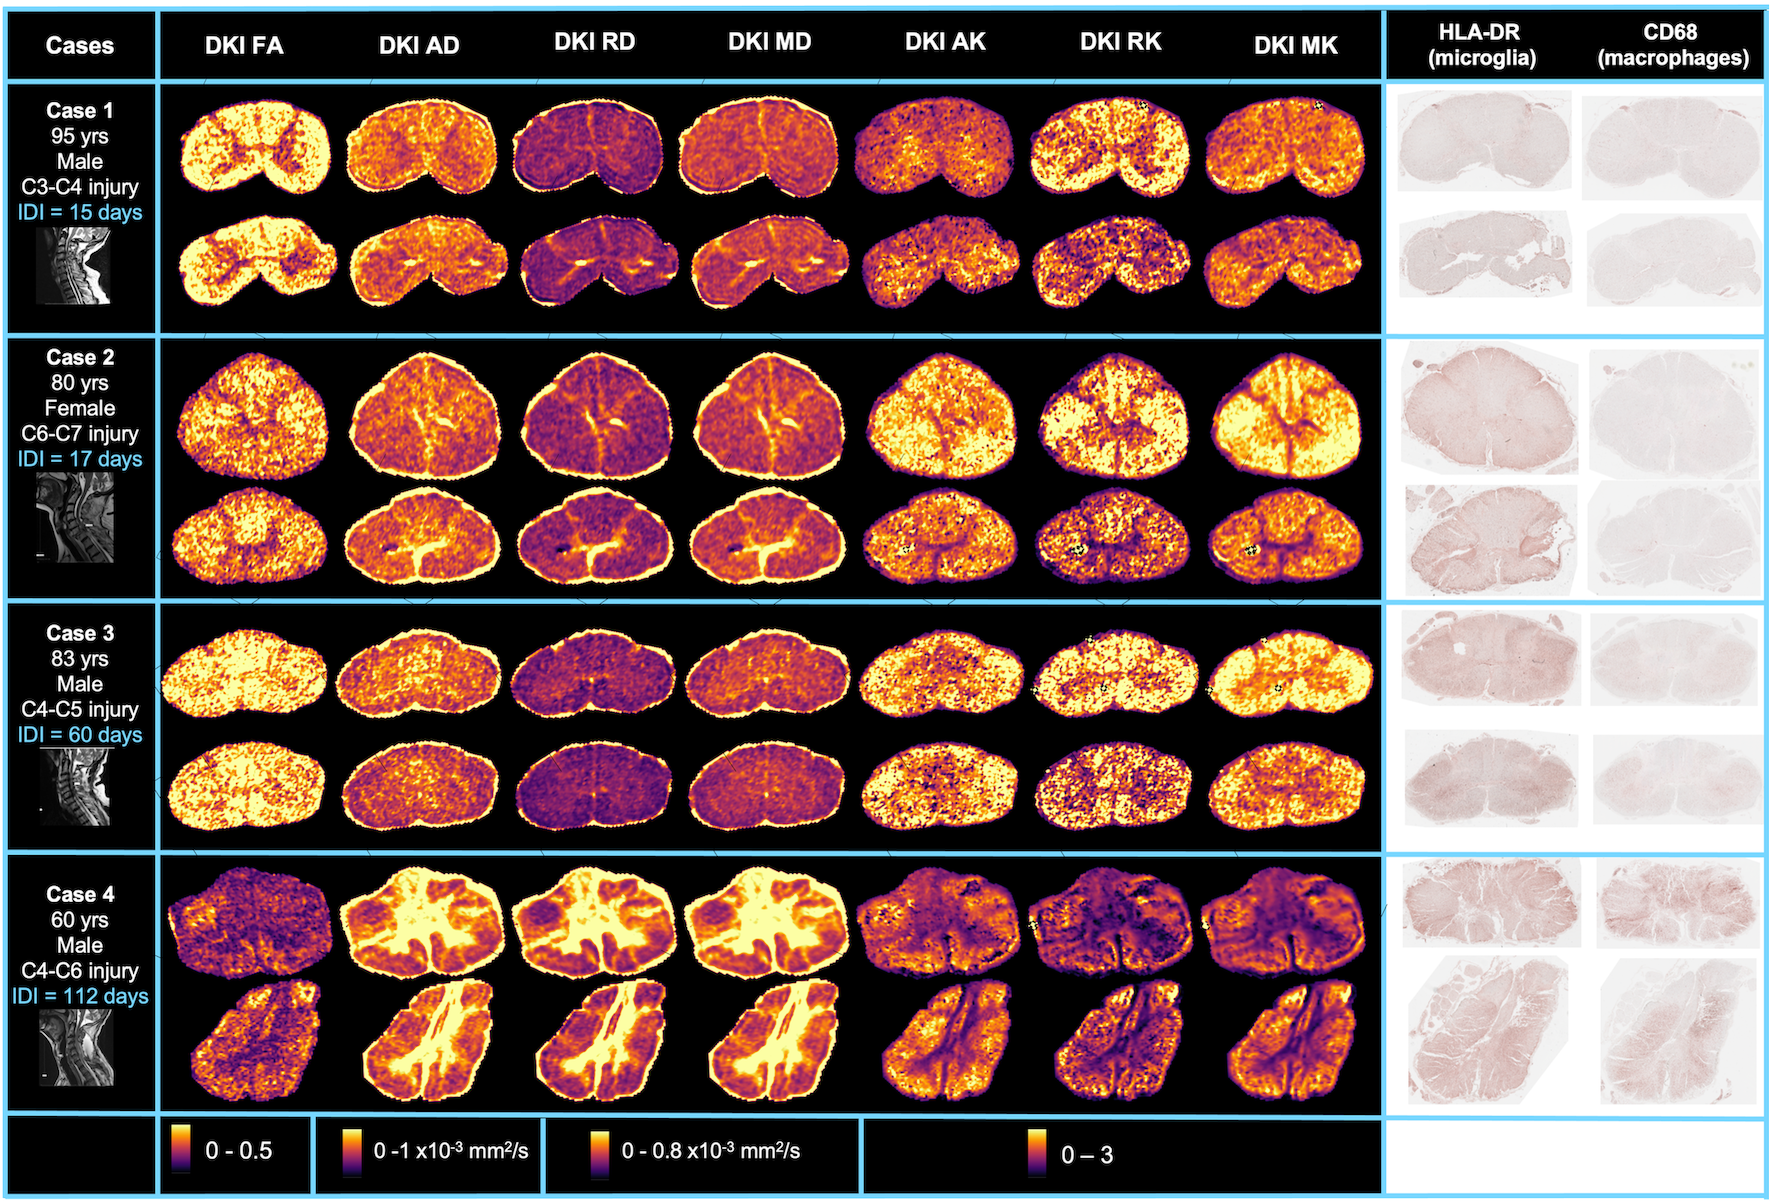
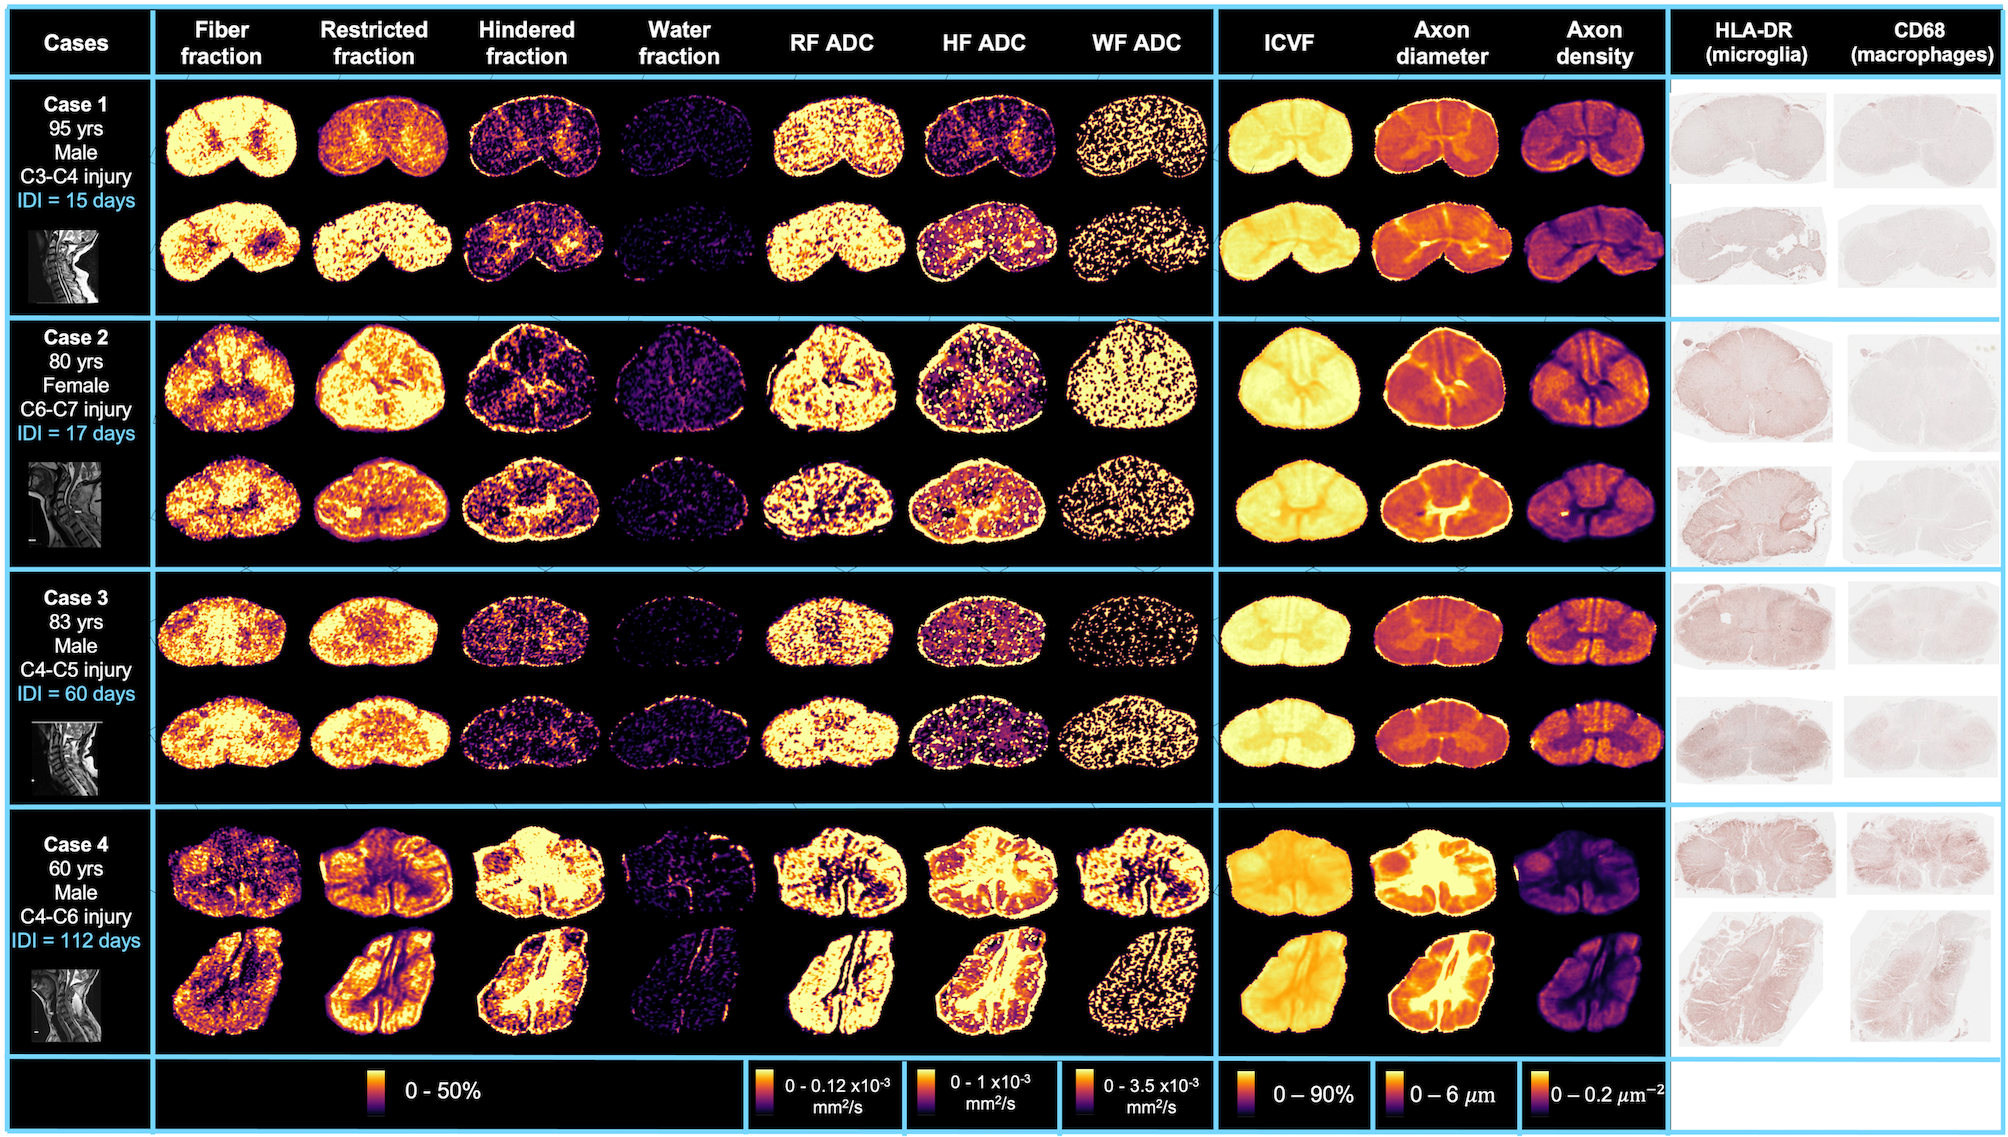
Conventional imaging poorly characterizes the complexity of spinal cord injury (SCI). After an acute injury, an inflammatory response occurs via activated microglia and infiltrating macrophages.1 MRI biomarkers specific to inflammation would enable detailed assessment of SCI damage, inform prognosis and assist stratification of patients for therapeutic intervention.Microstructural changes induced by inflammation can be quantified using multi-shell diffusion imaging and subsequent modelling to characterise the movement of water molecules at the cellular level. Diffusion Kurtosis Imaging (DKI) uses a Taylor expansion of the diffusion signal equation to include a term for non-Gaussian diffusion, yielding fractional anisotropy (FA), axial, radial and mean diffusivity (AD, RD, MD) and axial, radial and mean kurtosis (AK, RK, MK). ActiveAx simulates three compartments, combining Cylinder, Zeppelin and Ball models to give intracellular volume fraction (ICVF), axon diameter and axon density.2 Diffusion Basis Spectrum Imaging (DBSI) fits a complex composite model to separate anisotropic and isotropic signal components to determine fiber, restricted, hindered and water fractions (FF, RF, HF, WF) and their apparent diffusion coefficients (ADC_RF, ADC_HF, ADC_WF).3–5
The objective of our study was to correlate advanced diffusion MRI metrics with histology staining for inflammatory cells. We hypothesized that in areas of inflammation we would see:
- DKI FA decrease, MK increase
- ActiveAx axon diameter increase, axon density and ICVF decrease
- DBSI FF decrease, RF increase
Methods
Acquisition: Four spinal cords from the International Spinal Cord Injury Biobank (www.sci-biobank.org), donated by individuals who died after an acute SCI, were scanned ex-vivo at 7T (Bruker Biospec, 4.5cm formalin-fixed spinal cord blocks, 35mm inner-diameter quadrature volume coil, room temperature):- T2-weighted RARE (resolution=0.1x0.1x1mm3)
- Diffusion (multi-shell 3D diffusion-weighted SE-EPI, TR/TE=250/41.21ms, resolution=0.15x0.15x1mm3, six b=0 scans, 5 shells with b=500,1000,2000,3500,5000,7000s/mm2 and 6,15,24,42,60,80 directions)6
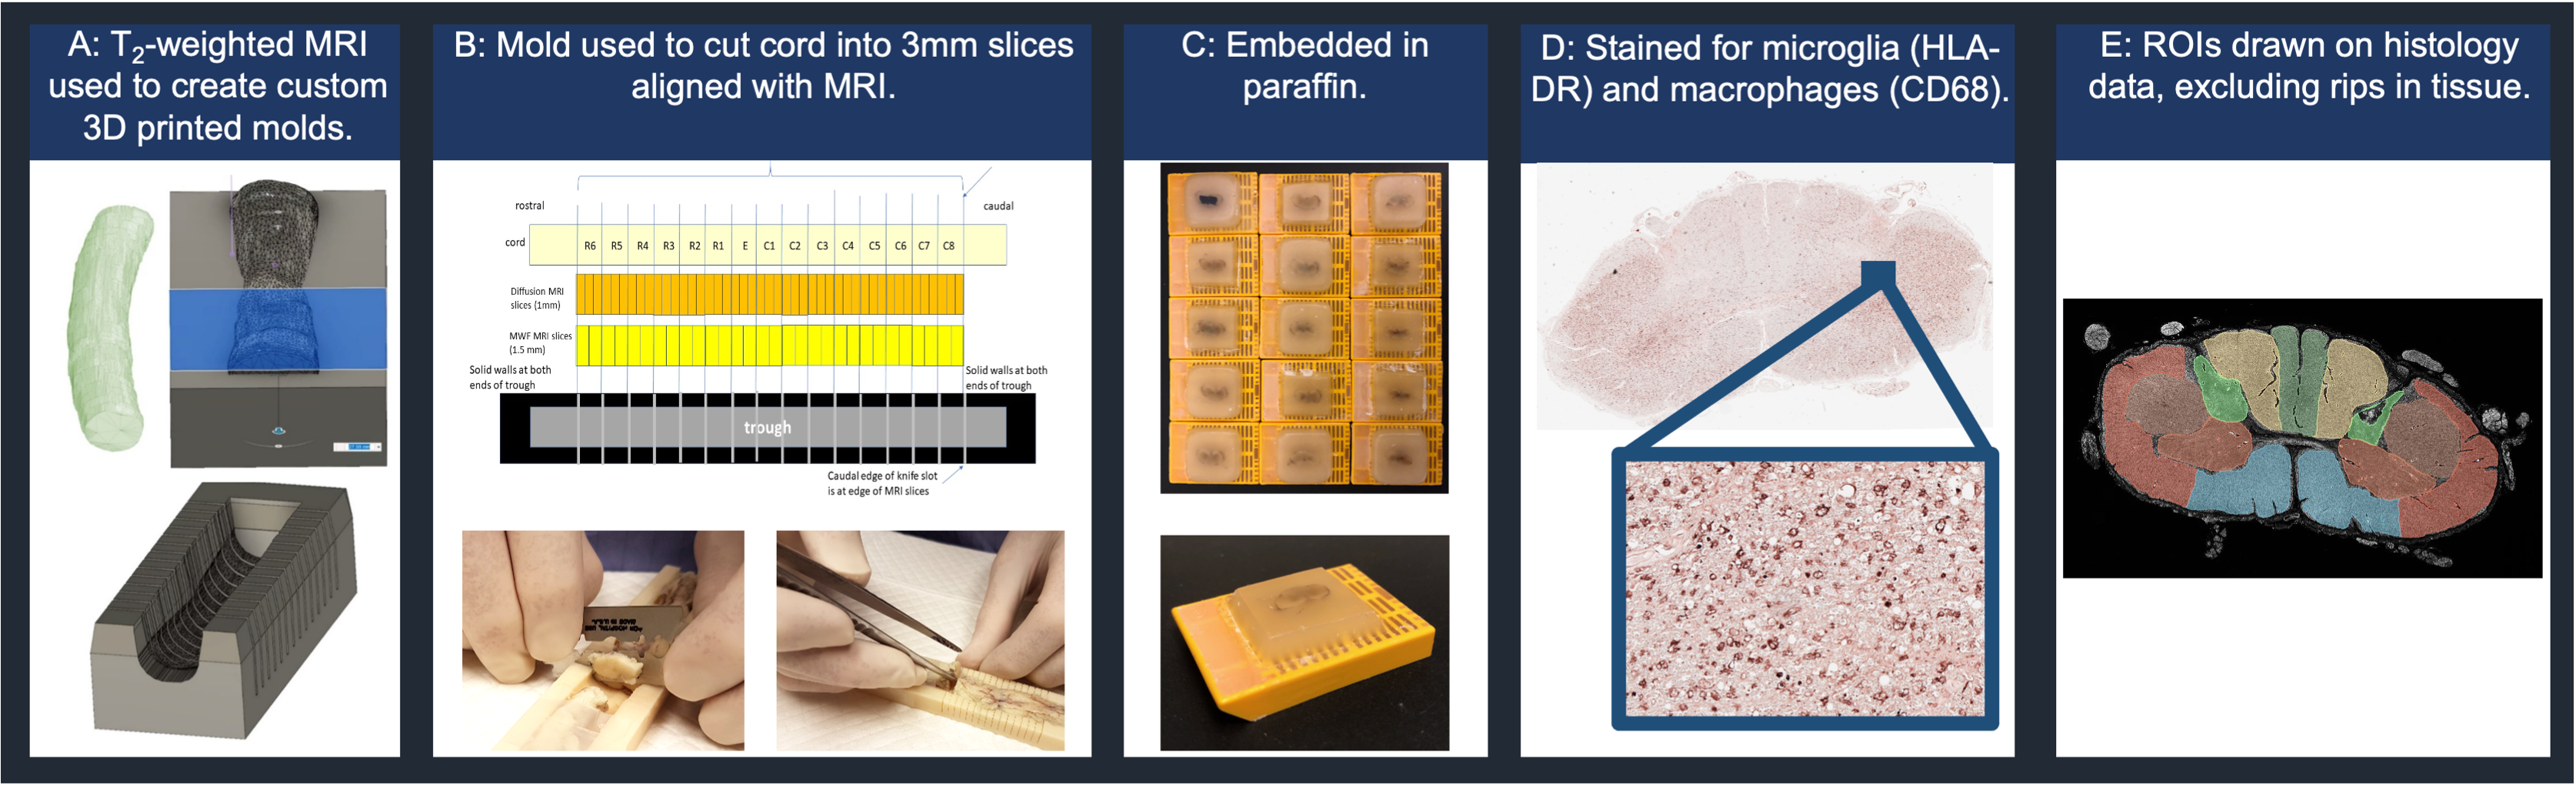
Histology: Cord-specific custom 3D-printed moulds were created using T2-weighted scans with knife slots aligned with MRI slice location (Fig 3). After MRI, the cords were cut into 3mm slices using the mould and paraffin embedded. Two 5μm sections (±9mm from injury epicenter) from each cord were stained with HLA-DR (activated microglia) and CD68 (macrophages) and digitised at 40x resolution.
Correlation analysis: Five white matter regions of interest (ROIs) were manually drawn on histology and MRI (3D Slicer).12 (Fig 3). Saturation images, produced from the raw histology scans, were thresholded using an Otsu algorithm to produce binary images of positive microglia (HLA-DR) and macrophage (CD68) staining.13 Pearson correlation coefficients (𝜌) were calculated between ROI diffusion MRI metrics and histology mean stained area fraction (p<0.001 after Bonferroni correction).
Results
FA, FF, ADC_WF, ICVF and axon density were negatively correlated and RD, MD, HF and axon diameter were positively correlated with both HLA-DR and CD68. ADC_HF was positively correlated and RK and MK were negatively correlated with only CD68 (Figs 4, 5).Discussion
The strong negative correlation between FA and both HLA-DR and CD68 was largely driven by an increase in RD (particularly clear in Case 4). RD is likely influenced by processes occurring with inflammation (axon swelling, myelin degradation), which decrease the barriers to diffusion perpendicular to the white matter tracts. Our results suggest that FA and RD may be good markers for inflammation after SCI. We did see the increase in kurtosis we expected in areas of inflammation, based on reports of high-grade vs low-grade gliomas,14,15 though only with CD68.As expected, FF was negatively correlated with both HLA-DR and CD68. Axon degradation and loss is expected in areas of inflammation. However, the lack of correlation between RF and HLA-DR/CD68 was unexpected, as RF (reflecting cellularity) should increase in areas with more inflammatory cells. Instead, HF was correlated with inflammation, which may be linked to edema (not histologically assessed in our study). It might also be that axon and myelin damage in these areas of inflammation leave open extracellular space contributing to a higher HF. Another interpretation is that diffusivity in the large macrophages was higher than the 0.3 μm/s2 threshold used to divide the spectrum of isotropic diffusion into the restricted and hindered compartments. Increasing ADC_HF and decreasing ADC_WF points to a high diffusivity extra-cellular compartment in these damaged areas caused by a combination of factors perhaps including edema, axon loss and gliosis.
The correlation between HLA-DR/CD68 and axon diameter was expected given that axon swelling, which occurs after SCI, will increase axon diameter.16 Decreases in ICVF and axon density is likely related to axon loss in these areas.
Conclusion
FA, RD and MD are strongly correlated with the presence of inflammatory cells after SCI. Increases in ActiveAx axon diameter suggest axon swelling. FF decreased while HF increased in areas of inflammation, linked to an increasing high-diffusivity extra-cellular compartment, perhaps caused by axon loss and edema. Our results identify multiple diffusion model metrics which could be used in combination to detect inflammation in vivo.Acknowledgements
We would like to thank the patients and families for tissue donation to the International Spinal Cord Injury Biobank. Funding for the Biobank and this study was provided by the Blusson Integrated Cures Partnership (BICP), VGH and UBC Hospital Foundation and the Rick Hansen Foundation, an International Collaboration on Repair Discoveries (ICORD) Seed Grant, the Craig H. Neilsen Foundation and NSERC. This work was conducted on the traditional, ancestral, and unceded territories of Coast Salish Peoples, including the territories of the xwməθkwəy̓əm (Musqueam), Skwxwú7mesh (Squamish), Stó:lō and Səl̓ílwətaʔ/Selilwitulh (Tsleil- Waututh) Nations.
References
1. Fleming, J. C. et al. The cellular inflammatory response in human spinal cords after injury. Brain 129, 3249–3269 (2006).
2. Alexander, D. C. et al. Orientationally invariant indices of axon diameter and density from diffusion MRI. NeuroImage 52, 1374–1389 (2010).
3. Wang, Y. et al. Quantification of increased cellularity during inflammatory demyelination. Brain 134, 3587–3598 (2011).
4. Wang, X. et al. Diffusion basis spectrum imaging detects and distinguishes coexisting subclinical inflammation, demyelination and axonal injury in experimental autoimmune encephalomyelitis mice. NMR Biomed 27, 843–852 (2014).
5. Chiang, C.-W. et al. Quantifying white matter tract diffusion parameters in the presence of increased extra-fiber cellularity and vasogenic edema. Neuroimage 101, 310–319 (2014).
6. Cheng, J., Shen, D., Yap, P.-T. & Basser, P. J. Single- and Multiple-Shell Uniform Sampling Schemes for Diffusion MRI Using Spherical Codes. IEEE Transactions on Medical Imaging 37, 185–199 (2018).
7. Coupe, P. et al. An optimized blockwise nonlocal means denoising filter for 3-D magnetic resonance images. IEEE Trans Med Imaging 27, 425–441 (2008).
8. Andersson, J. L. R. & Sotiropoulos, S. N. An integrated approach to correction for off-resonance effects and subject movement in diffusion MR imaging. Neuroimage 125, 1063–1078 (2016).
9. Andersson, J. L. R., Skare, S. & Ashburner, J. How to correct susceptibility distortions in spin-echo echo-planar images: application to diffusion tensor imaging. Neuroimage 20, 870–888 (2003).
10. Ades-Aron, B. et al. Evaluation of the accuracy and precision of the diffusion parameter EStImation with Gibbs and NoisE removal pipeline. NeuroImage 183, 532–543 (2018).
11. Daducci, A. et al. Accelerated Microstructure Imaging via Convex Optimization (AMICO) from diffusion MRI data. NeuroImage 105, 32–44 (2015).
12. Kikinis, R., Pieper, S. D. & Vosburgh, K. G. 3D Slicer: A Platform for Subject-Specific Image Analysis, Visualization, and Clinical Support. in Intraoperative Imaging and Image-Guided Therapy (ed. Jolesz, F. A.) 277–289 (Springer, 2014). doi:10.1007/978-1-4614-7657-3_19.
13. Otsu, N. A Threshold Selection Method from Gray-Level Histograms. IEEE Transactions on systems, man and cybernetics SMC-9, 62–66 (1979).
14. Raab, P., Hattingen, E., Franz, K., Zanella, F. E. & Lanfermann, H. Cerebral Gliomas: Diffusional Kurtosis Imaging Analysis of Microstructural Differences. Radiology 254, 876–881 (2010).
15. Van Cauter, S. et al. Gliomas: Diffusion Kurtosis MR Imaging in Grading. Radiology 263, 492–501 (2012).
16. Benjamini, D. et al. Direct and specific assessment of axonal injury and spinal cord microenvironments using diffusion correlation imaging. NeuroImage 221, 117195 (2020).
Figures