0391
Spatiotemporal dynamics of anterograde and retrograde neurodegeneration following spinal cord injury1Spinal Cord Injury Center, Balgrist University Hospital, Zürich, Switzerland, 2Wellcome Trust Centre for Neuroimaging, UCL Institute of Neurology, London, United Kingdom, 3Department of Neurophysics, Max Planck Institute for Human Cognitive and Brain Sciences, Leipzig, Germany
Synopsis
We tracked remote neurodegenerative changes in the cervical cord following spinal cord injury over 2 years using macrostructural readouts (cross-sectional area, left-right width, anterior-posterior width) derived from T1-weighted MPRAGE images. Thereby, we evaluated the dependency of the magnitude of atrophy on the distance to the lesion. Over time, differences in atrophy rates along the cervical cord rostral to the lesion gradually formed a lesion gradient. Using anterior-posterior width and left-right width as surrogates for investigating anterograde and retrograde degeneration separately, our results suggest that these two types exhibit different spatiotemporal dynamics. A lesion gradient was only observable for retrograde degeneration.
Introduction
Spinal cord injury (SCI) is a devastating event with an enormous impact on the patients' life resulting from sensorimotor and autonomous impairments. Currently, there is no cure and functional recovery is limited leaving the majority of patients with severe and permanent deficits1. The primary injury triggers a cascade of pathophysiological processes that extend beyond the lesion site by secondary disease processes (i.e. anterograde, retrograde, and trans-synaptic degeneration) and lead to remote neurodegenerative changes both rostrally and caudally2-9.Here, we assessed the magnitude of neurodegenerative changes in relation to the distance to the lesion across the cervical cord over two years following SCI using macrostructural readouts derived from conventional T1-weighted MRI. Specifically, we investigated the spatiotemporal dynamics of anterograde and retrograde degeneration separately by tracking changes in the surrogate readouts left-right width (LRW) and anterior-posterior width (APW)8.
Methods
24 patients with acute SCI (Table 1) and 21 healthy controls underwent a T1-weighted 3D Magnetization Prepared Rapid Acquisition Gradient-Echo (MPRAGE) sequence on a clinical 3T Siemens Verio and a 3T Siemens Skyra scanner (Erlangen, Germany). Patients were scanned 5 times, at baseline (<2 months after injury) and at 2, 6, 12, and 24 months follow-up. Healthy controls followed the same scanning schedule. Exclusion criteria were concomitant head or brain lesions, pre-existing neurological or mental disorders, medical disorders leading to functional impairment, or contraindications to MRI.The MPRAGE sequence covering the brain and cervical levels C1-C5 consisted of following parameters: 176 slices, in-plane field of view (FOV) of 224x256 mm2, isotropic resolution of 1 mm3, repetition time (TR)=24.2 ms, echo time (TE)=4.28 ms, flip angle (FA)=9°, inversion time (TI)=960 ms, readout bandwidth of 150 Hz per pixel, total scan time of 9.04 min.
The images were processed with a pipeline using the Spinal Cord Toolbox10. Morphometric parameters including cross-sectional spinal cord area (CSA), APW, and LRW were extracted from the MPRAGE segmentations. A linear mixed effect model was created for each readout with following variables: vertebral level (C1-C3), time since injury, a quadratic term of time since injury to model decelerating effects, and their interaction with group (controls, tetraplegics, paraplegics). The interaction of age with time since injury was added to remove aging-related changes11. Post-hoc pairwise comparison was performed using Tukey's correction (p<0.05).
Results
There was no significant difference in all three macrostructural measures at baseline (Table 3, Figure 2A-C). Over 2 years, greater atrophy rates in CSA at all three cervical levels were evident in tetraplegics compared to controls, with greater magnitudes at lower levels (Table 2, Figure 1A). By the 6-month follow-up, the spatial gradient of CSA from C1 to C3 had become significantly higher in tetraplegics compared to controls and this difference increased until the 24-month follow-up (Table 3, Figure 2A).Tetraplegics also differed significantly in the linear decline of the main cord axes (APW, LRW) from controls (Table 2, Figure 1B,C). A trend significance of increasing rates at lower levels was evident for LRW, while there were no substantial differences in APW between the levels. Similar to CSA, the difference in the spatial gradient of LRW between tetraplegics and controls gradually increased until the 24-month follow-up (Table 3, Figure 2B). Although atrophy was evident in APW, there was no substantial change in the spatial gradient of APW over time (Table 3, Figure 2C).
In contrast to tetraplegics, paraplegics exhibited a trend of increased CSA, APW and LRW decline rates at cervical levels C1-C3 without considerable differences between levels and did not develop a spatial neurodegenerative gradient in any macrostructural measure (Tables 2,3, Figures 1,2).
Discussion
This study demonstrated the development of a spatial gradient of neurodegeneration in the upper cervical cord over two years following spinal cord injury. While tetraplegics showed a spatial gradient in CSA and LRW, paraplegics did not develop this gradient in the cervical cord, although showing atrophic changes compared to controls. These results indicate that, although the whole cord might eventually be affected by atrophy, neurodegenerative changes are more pronounced in close proximity of the lesion than at greater distance. Crucially, our results suggest that differences in the magnitude of atrophy rates (i.e. change/time) are the underlying cause of the development of this spatial gradient.Moreover, using LRW as a marker to investigate the impairment of the corticospinal tract and APW for the dorsal columns, respectively, we speculate that the spatiotemporal dynamics of retrograde and anterograde degeneration develops with different temporal trajectories8,12. While in LRW (i.e. retrograde degeneration), lower levels underwent greater neurodegeneration than higher levels in tetraplegics, the difference in the magnitude of atrophy was less pronounced in APW (i.e. anterograde degeneration). This led to the gradual development of a spatial gradient in LRW whereas no gradient was observable in APW.
Conclusion
This study shows that differences in the magnitude of remote spinal cord atrophy rates with regard to the distance to the lesion are contributing to the gradual development of a spatial neurodegenerative gradient. Moreover, our results suggest that retrograde and anterograde degeneration might exhibit different spatiotemporal dynamics of neurodegeneration.Acknowledgements
We thank all participants for taking part in this study, and the staff of the radiology department at the University Hospital Balgrist, Switzerland.
Simon Schading was supported by a national MD-PhD scholarship provided by the SNSF (grant number: 323530_207038)
References
1. Curt A, Van Hedel HJ, Klaus D, Dietz V. Recovery from a spinal cord injury: significance of compensation, neural plasticity, and repair. J Neurotrauma. 2008;25(6):677-85.
2. Freund P, Weiskopf N, Ashburner J, Wolf K, Sutter R, Altmann DR, et al. MRI investigation of the sensorimotor cortex and the corticospinal tract after acute spinal cord injury: a prospective longitudinal study. The Lancet Neurology. 2013;12(9):873-81.
3. Grabher P, Callaghan MF, Ashburner J, Weiskopf N, Thompson AJ, Curt A, et al. Tracking sensory system atrophy and outcome prediction in spinal cord injury. Ann Neurol. 2015;78(5):751-61.
4. Ziegler G, Grabher P, Thompson A, Altmann D, Hupp M, Ashburner J, et al. Progressive neurodegeneration following spinal cord injury: Implications for clinical trials. Neurology. 2018;90(14):e1257-e66.
5. Seif M, Curt A, Thompson AJ, Grabher P, Weiskopf N, Freund P. Quantitative MRI of rostral spinal cord and brain regions is predictive of functional recovery in acute spinal cord injury. Neuroimage Clin. 2018;20:556-63.
6. Seif M, David G, Huber E, Vallotton K, Curt A, Freund P. Cervical Cord Neurodegeneration in Traumatic and Non-Traumatic Spinal Cord Injury. J Neurotrauma. 2020;37(6):860-7.
7. David G, Seif M, Huber E, Hupp M, Rosner J, Dietz V, et al. In vivo evidence of remote neural degeneration in the lumbar enlargement after cervical injury. Neurology. 2019;92(12):e1367-e77.
8. Lundell H, Barthelemy D, Skimminge A, Dyrby TB, Biering-Sørensen F, Nielsen JB. Independent spinal cord atrophy measures correlate to motor and sensory deficits in individuals with spinal cord injury. Spinal Cord. 2011;49(1):70-5.
9. Freund P, Seif M, Weiskopf N, Friston K, Fehlings MG, Thompson AJ, et al. MRI in traumatic spinal cord injury: from clinical assessment to neuroimaging biomarkers. The Lancet Neurology. 2019;18(12):1123-35.
10. De Leener B, Lévy S, Dupont SM, Fonov VS, Stikov N, Louis Collins D, et al. SCT: Spinal Cord Toolbox, an open-source software for processing spinal cord MRI data. Neuroimage. 2017;145(Pt A):24-43.
11. Papinutto N, Asteggiano C, Bischof A, Gundel TJ, Caverzasi E, Stern WA, et al. Intersubject Variability and Normalization Strategies for Spinal Cord Total Cross-Sectional and Gray Matter Areas. J Neuroimaging. 2020;30(1):110-8.
12. Azzarito M, Seif M, Kyathanahally S, Curt A, Freund P. Tracking the neurodegenerative gradient after spinal cord injury. Neuroimage Clin. 2020;26:102221.
Figures
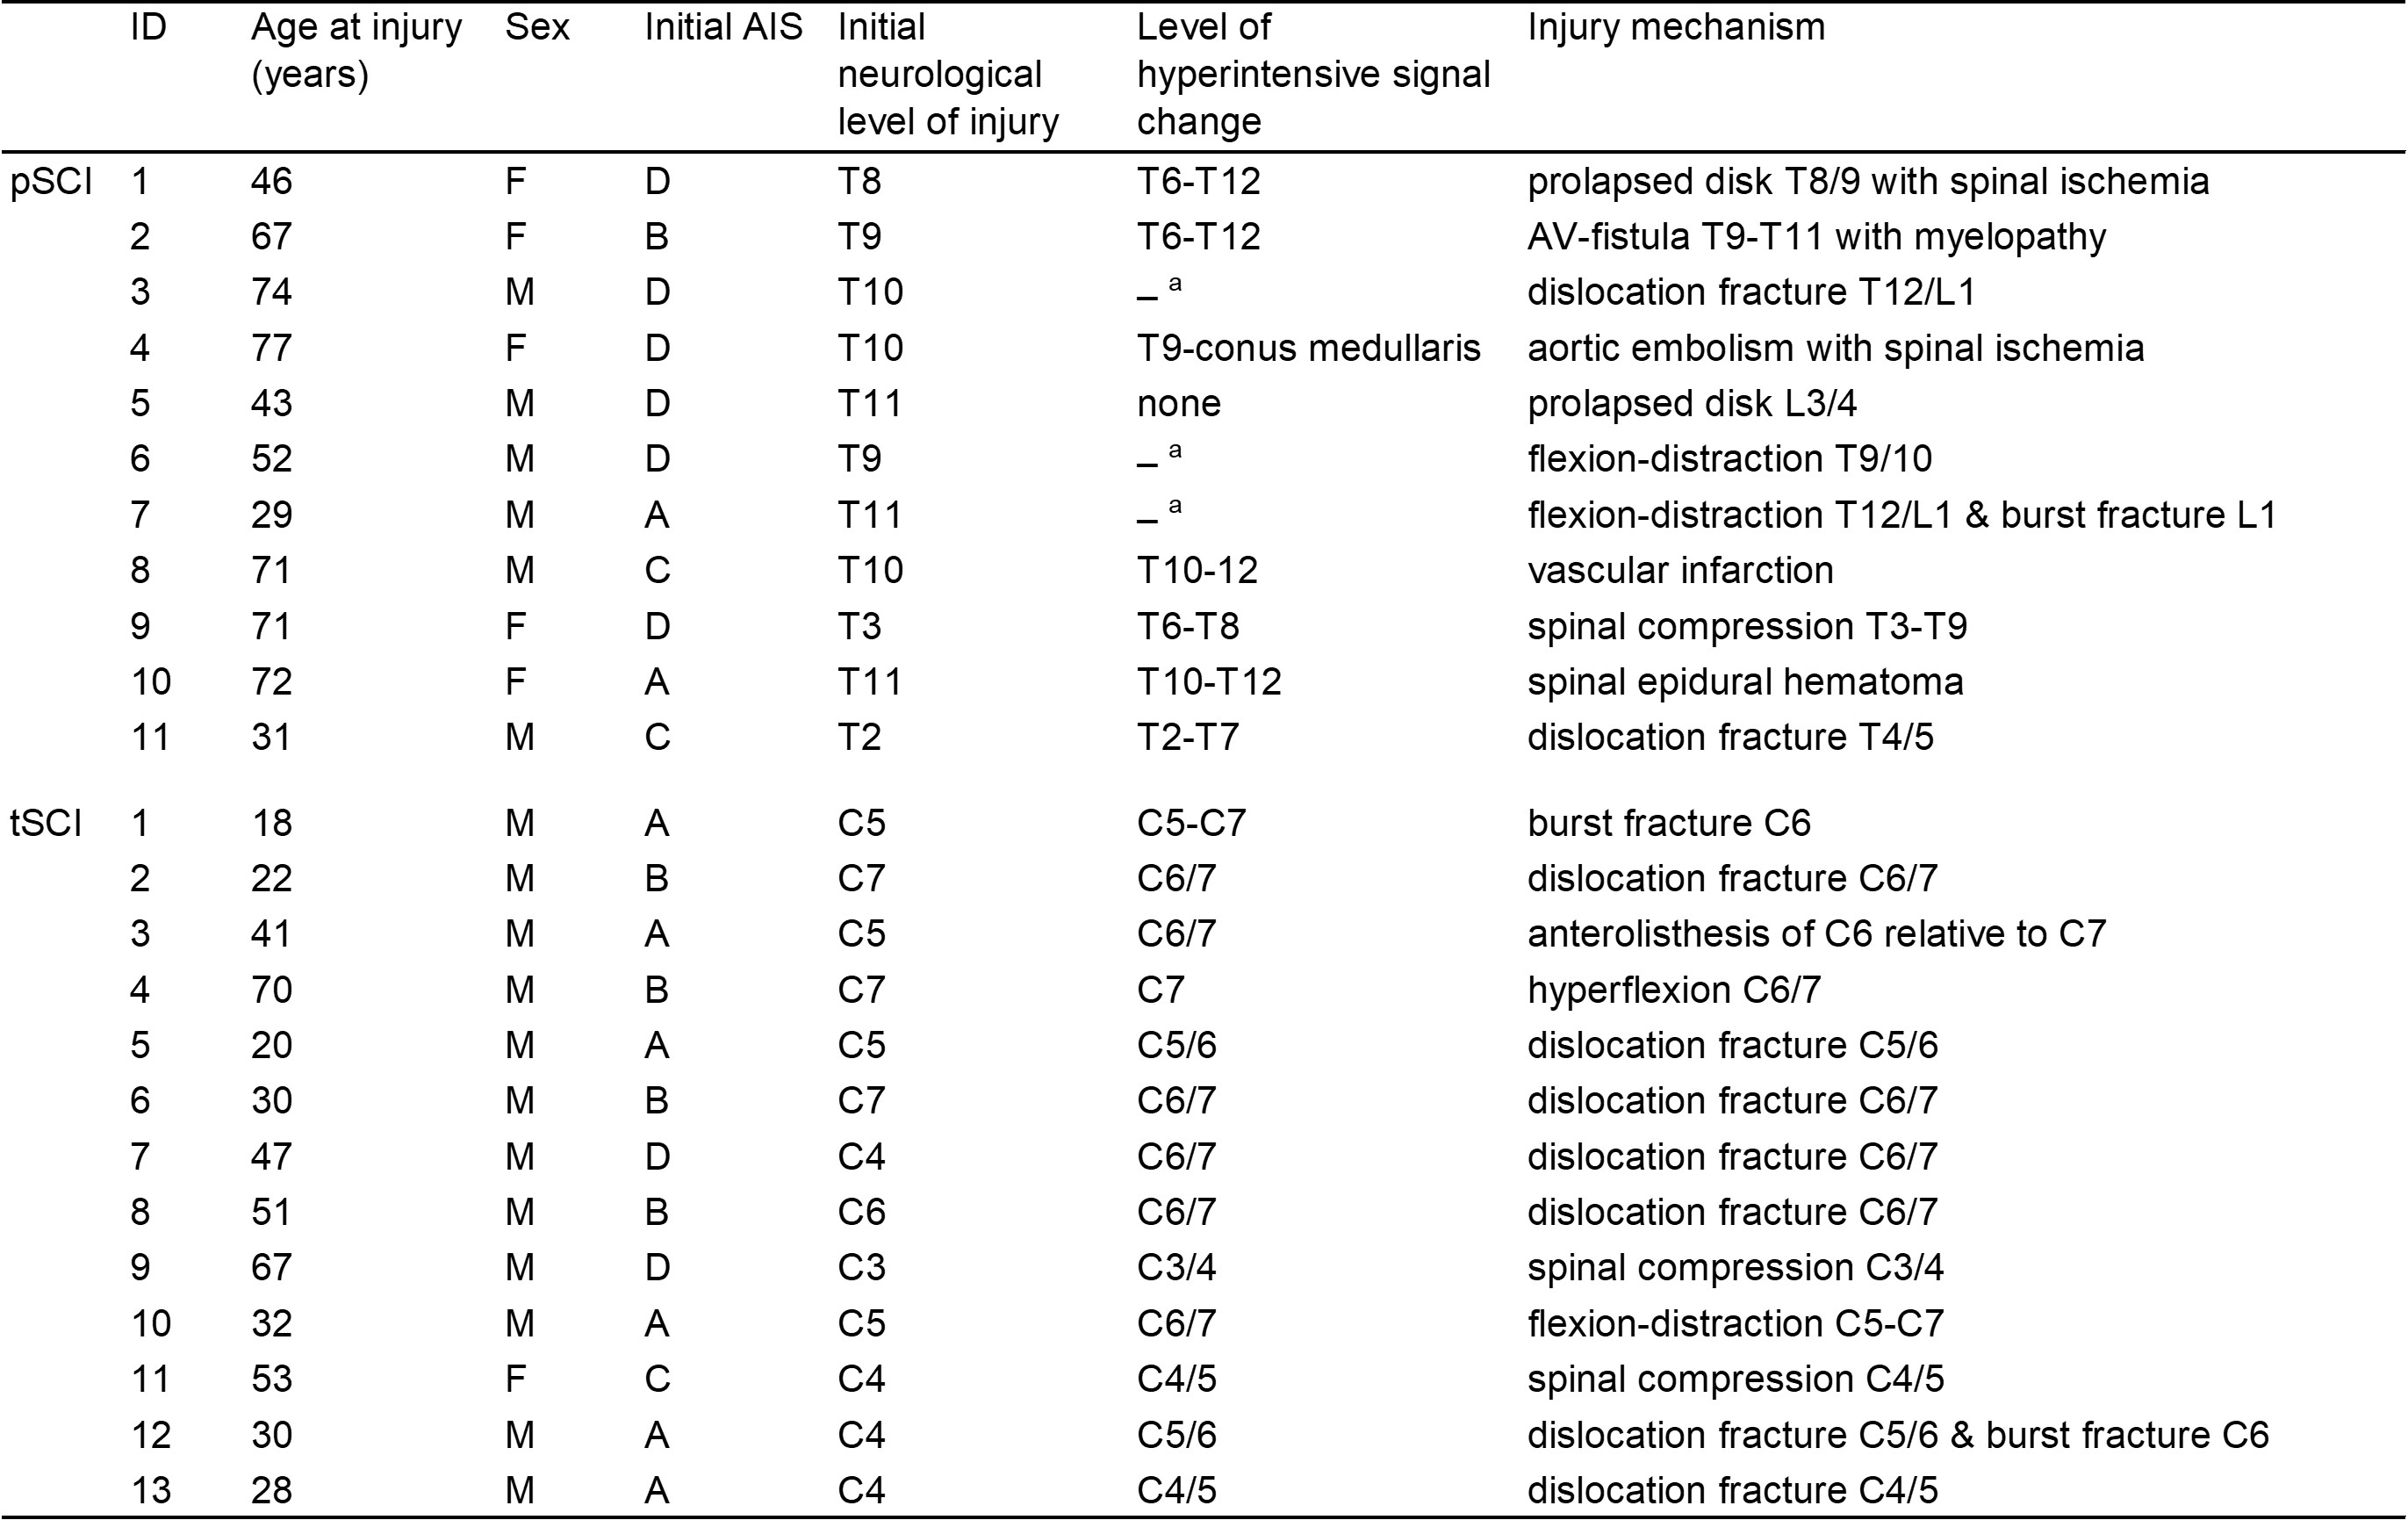
Table 1 Demographics and clinical information of spinal cord injury patients.
a Spinal cord cannot be assessed at the level of injury due to artifacts caused by metal implants
pSCI: paraplegic patients, tSCI: tetraplegic patients, F: female, M: male, AIS: American Spinal Injury Association Impairment Scale
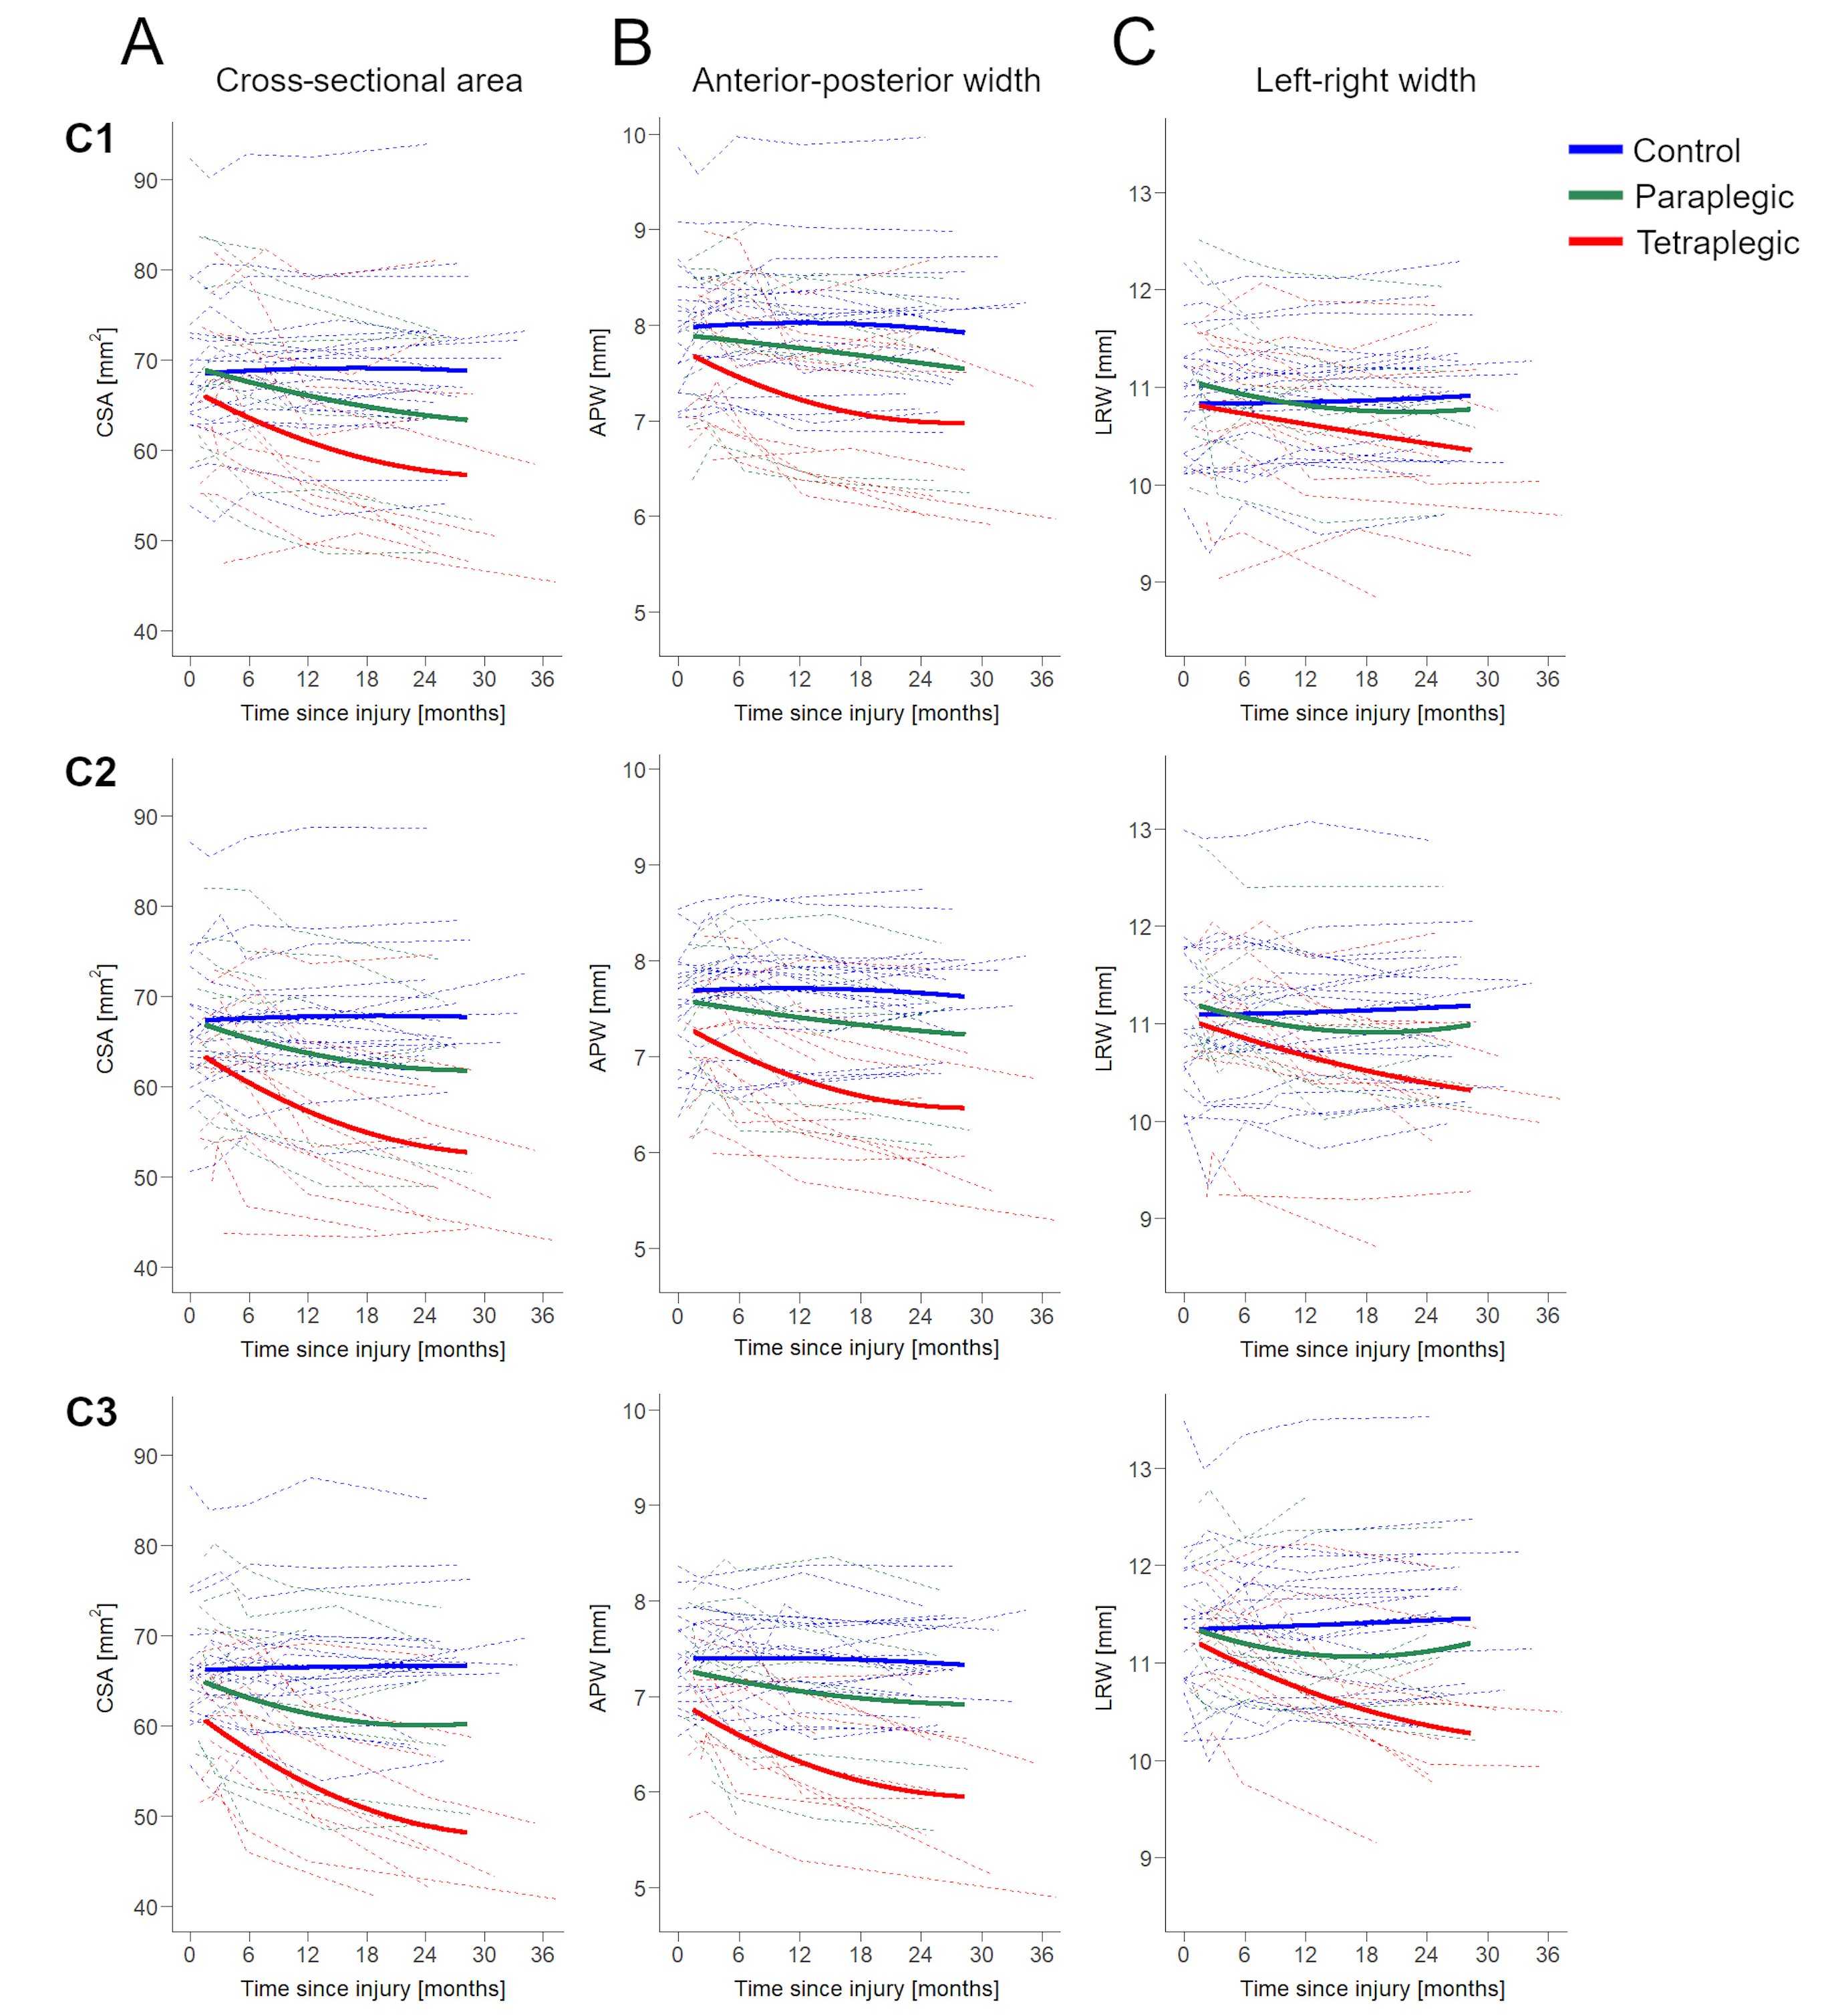
Figure 1 Change in (A) cross-sectional spinal cord area (CSA) at the cervical levels C1, C2, and C3, (B) anterior-posterior width (APW), and (C) left-right width (LRW) in controls (blue), paraplegics (green), and tetraplegics (red) after spinal cord injury over 2 years. Note that solid lines depict the fitted model; dashed lines show observed individual data.
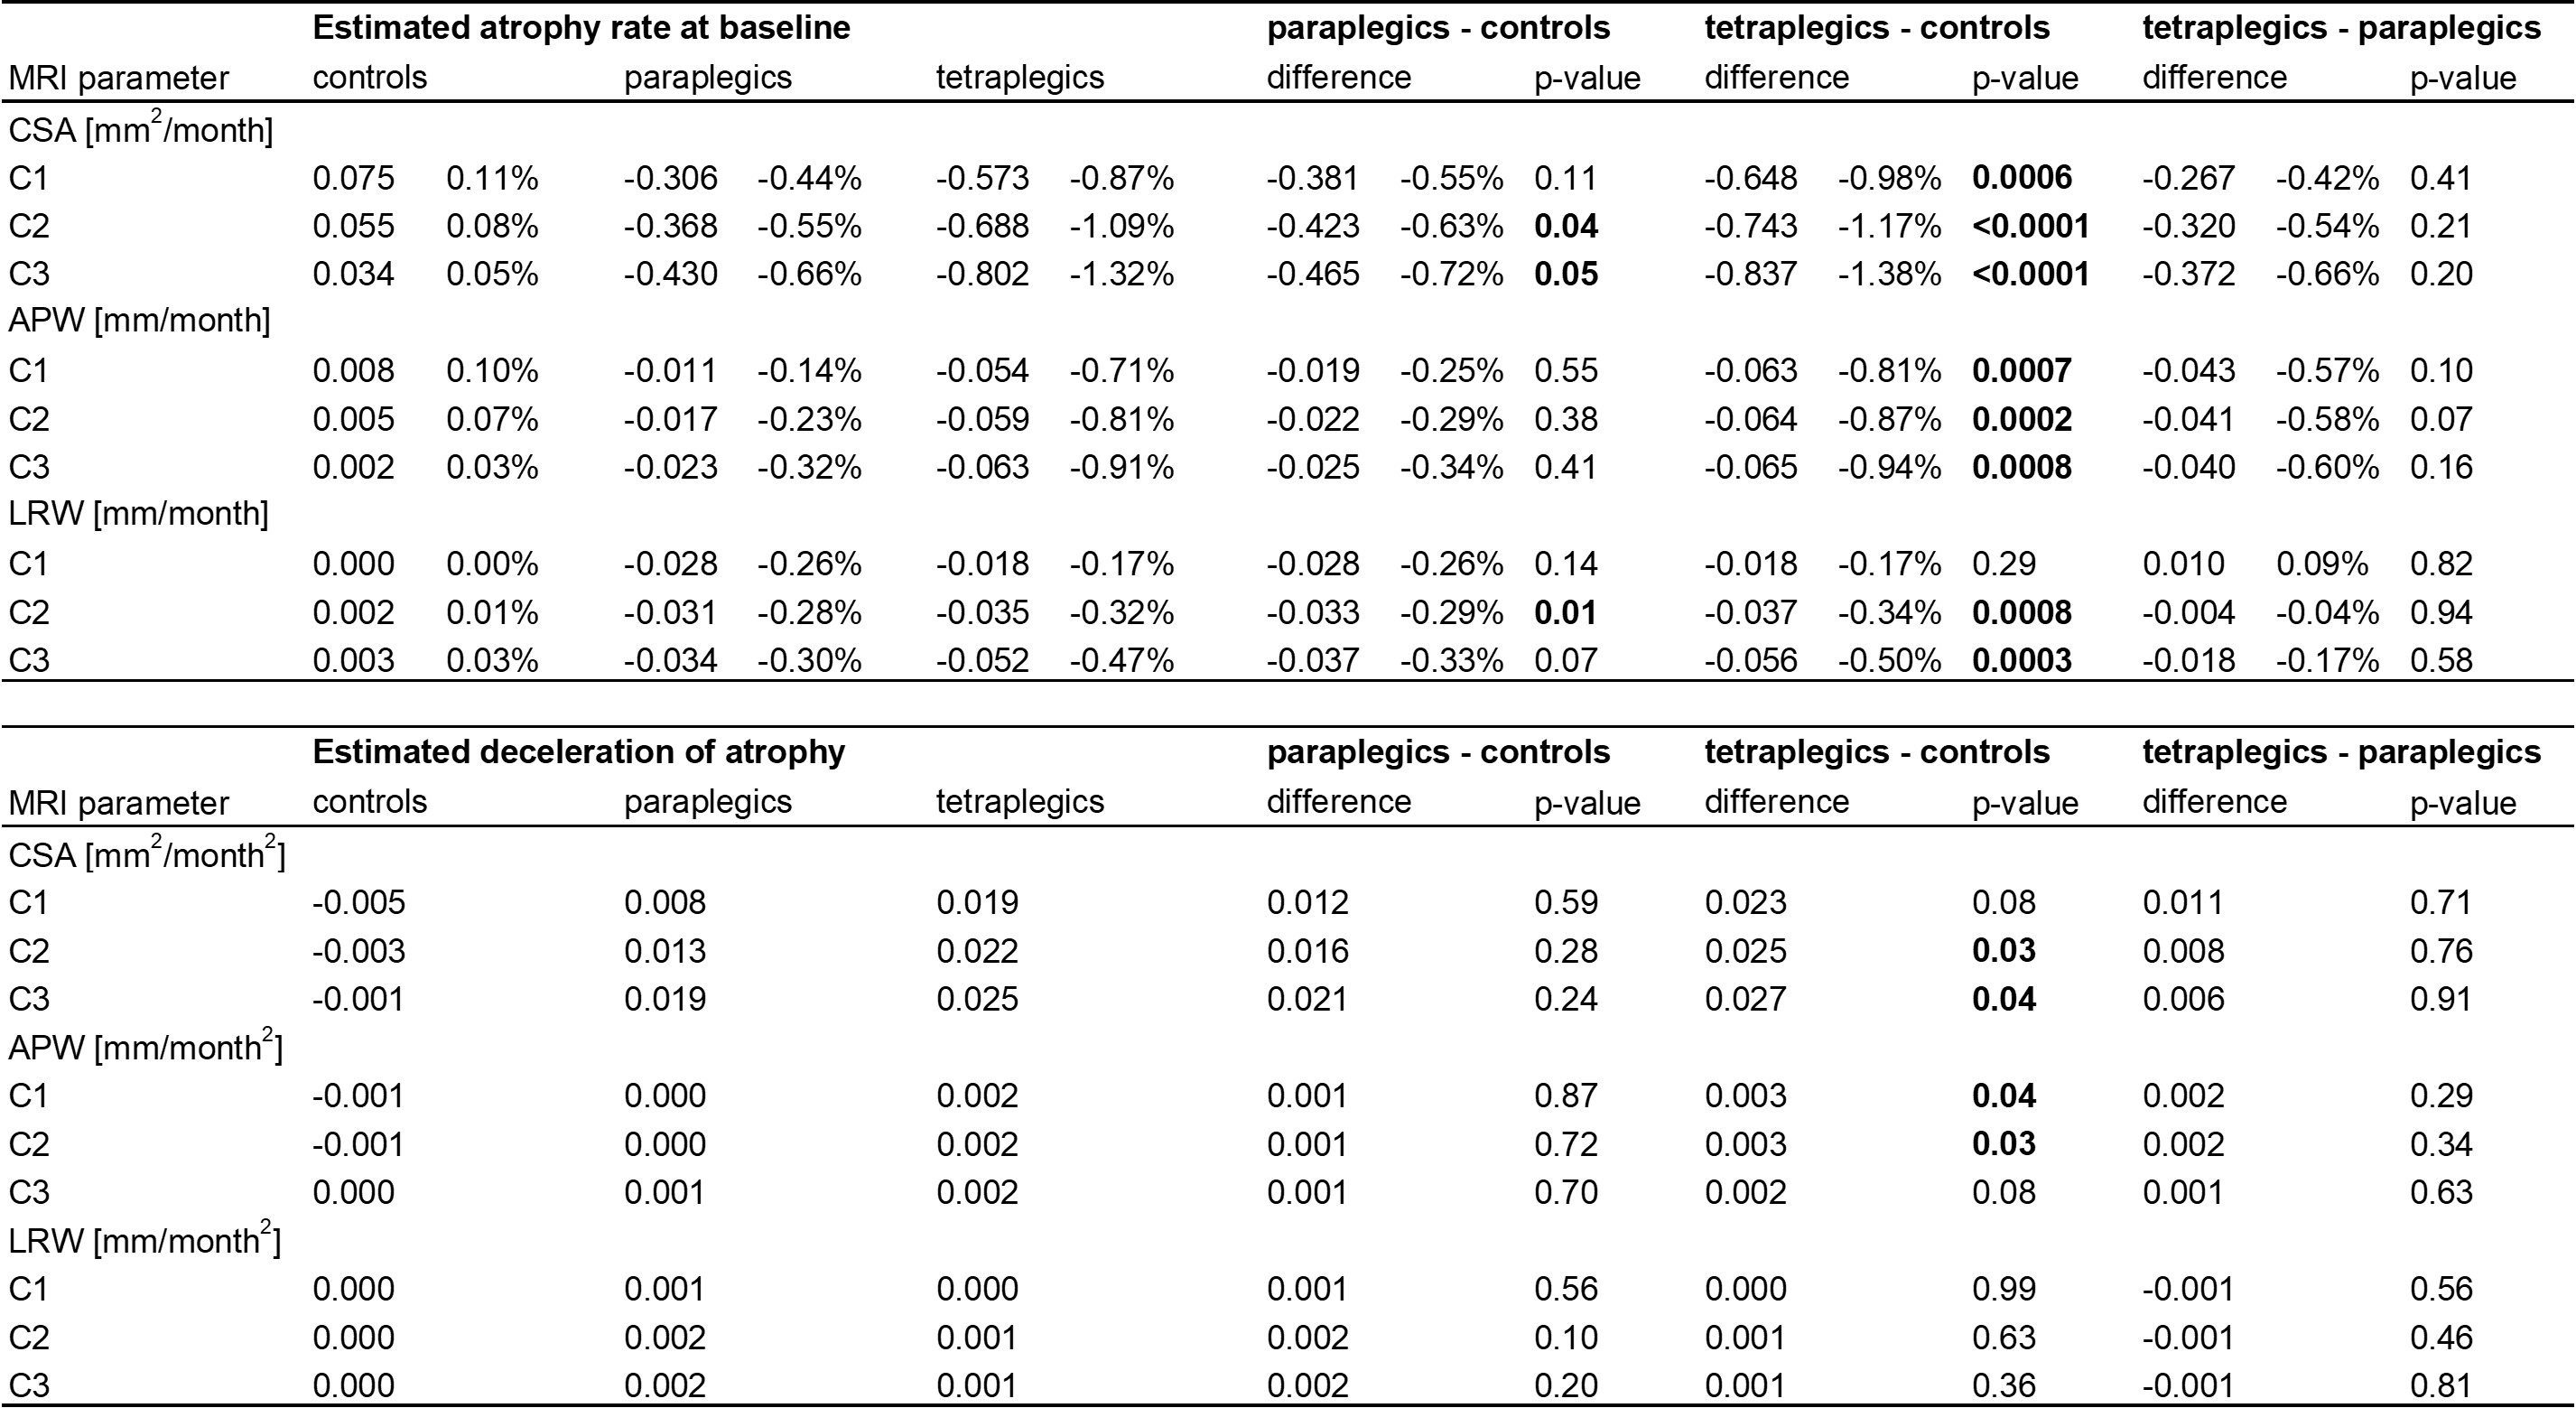
Table 2 MRI measures over time for each vertebral level.
Linear and quadratic (i.e. deceleration) change in MRI measures over time for each cervical level (C1, C2, C3) in controls, paraplegics, and tetraplegics. Significant results shown in bold. CSA: cross-sectional area, APW: anterior-posterior width, LRW: left-right width.
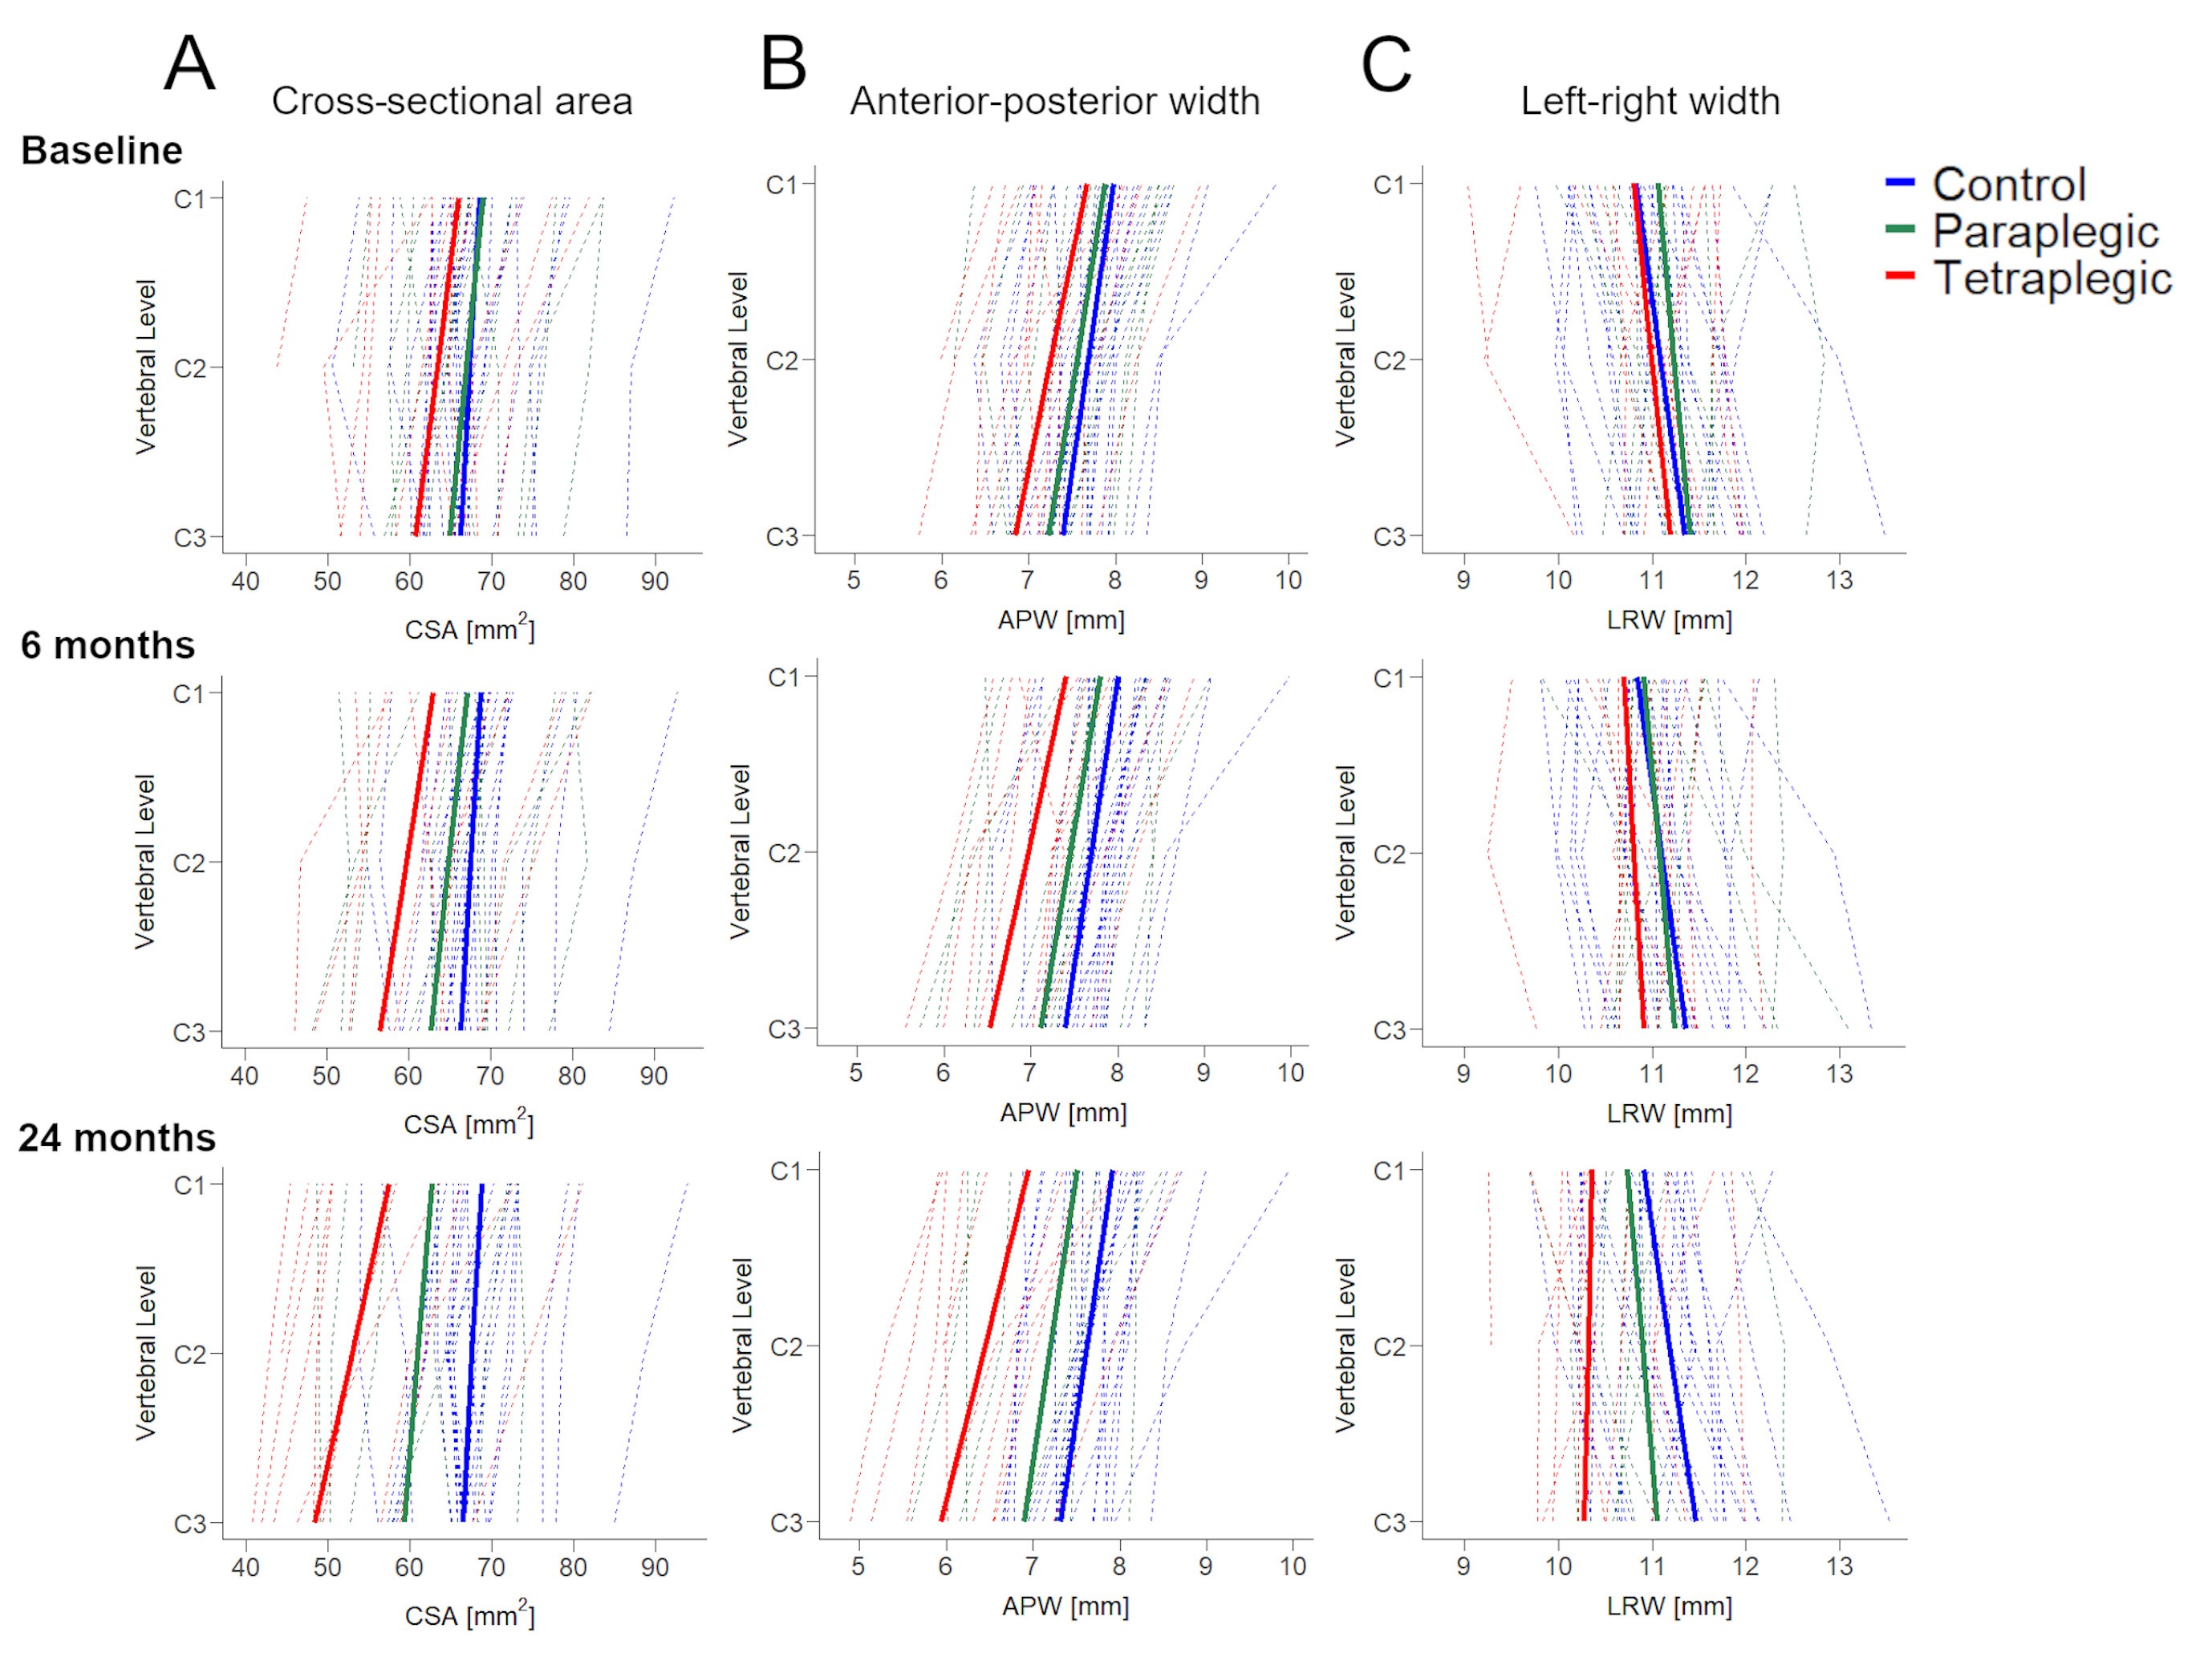
Figure 2 (A) Cross-sectional spinal cord area, (B) anterior-posterior width, (C) left-right width along the cervical cord (from C1 to C3) in controls (blue), paraplegics (green), and tetraplegics (red) at three time-points after spinal cord injury (baseline, 6-month follow-up, 24-month follow-up). Note that solid lines depict the fitted model; dashed lines show observed individual data.
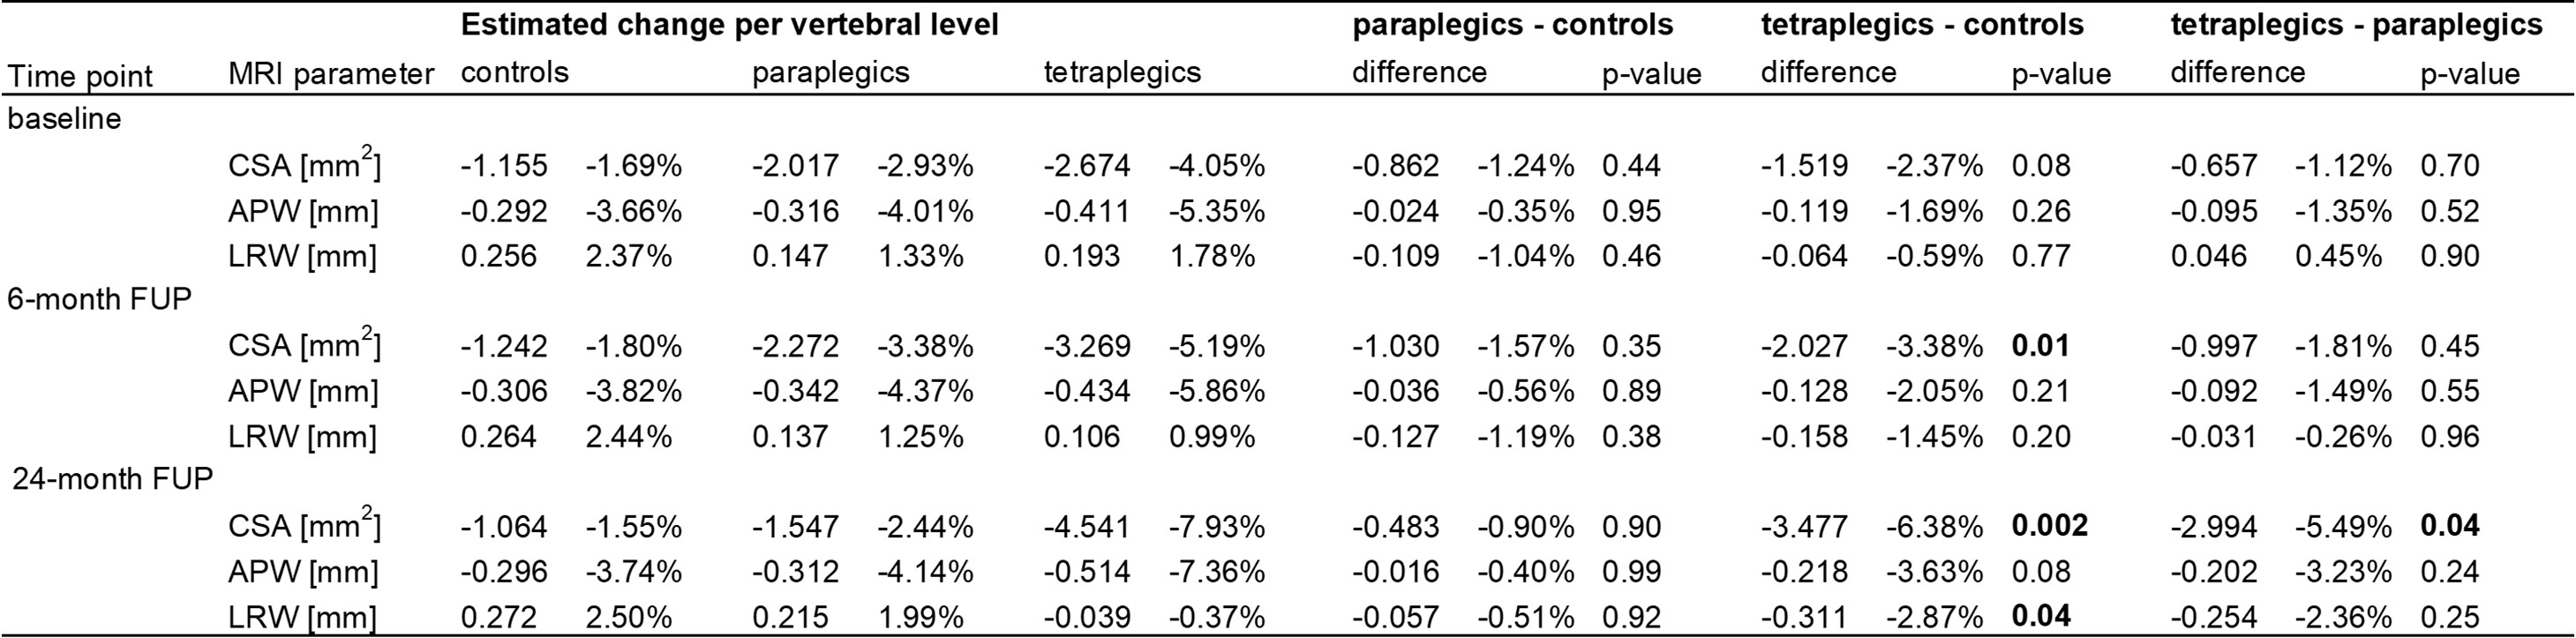
Table 3 MRI measures along the cervical cord.
Change in MRI measures per vertebral level along the cervical cord at three different time-points after spinal cord injury (baseline, 6-month follow-up, 24-month follow-up) in controls, paraplegics, and tetraplegics. Significant results shown in bold. CSA: cross-sectional area, APW: anterior-posterior width, LRW: left-right width.