0390
Molecular MRI and PET Imaging Detect Biomarkers of Neuroinflammation in Contusion Injured Spinal Cord1Vanderbilt University Institute of Imaging Science & Department of Radiology and Radiological Sciences, Vanderbilt University Medical Center, Nashville, TN, United States
Synopsis
Spinal cord injury (SCI) severity/recovery are influenced by complex pathological mechanisms. We used CEST/NOE MR and TSPO PET imaging to evaluate longitudinal molecular changes associated with neuroinflammation in a lumbar contusion SCI rodent model. The NOE(-1.6 ppm) peak amplitude significantly decreased and the CEST(3.5 ppm) peak amplitude increased in SCI rats, 1-week post-injury. Similarly, we detected significant increase in the uptake of a TSPO-targeting PET radiotracer at the SCI epicenter. The CEST/NOE pools can be linked to neuroinflammatory activity associated with glutamate release. The results indicate that CEST/NOE MRI measurements provide complementary information to TSPO PET measurement in SCI.
Introduction
The severity and recovery of spinal cord injuries (SCI) are influenced by complex pathological mechanisms, including demyelination/remyelination, glutamate excitotoxicity, scar formation, and neuroinflammatory responses1. Pathological processes, including release of proinflammatory cytokines and neurotoxic glutamate occurring in the acute and subacute phases, have been targets for therapeutic interventions. The overall goal of this study is to develop and validate noninvasive, mechanism-based imaging biomarkers of these processes to assist evaluation of injury severity, guide interventions, predict longitudinal recovery, and provide objective measures of treatment outcomes and efficacy.Methods
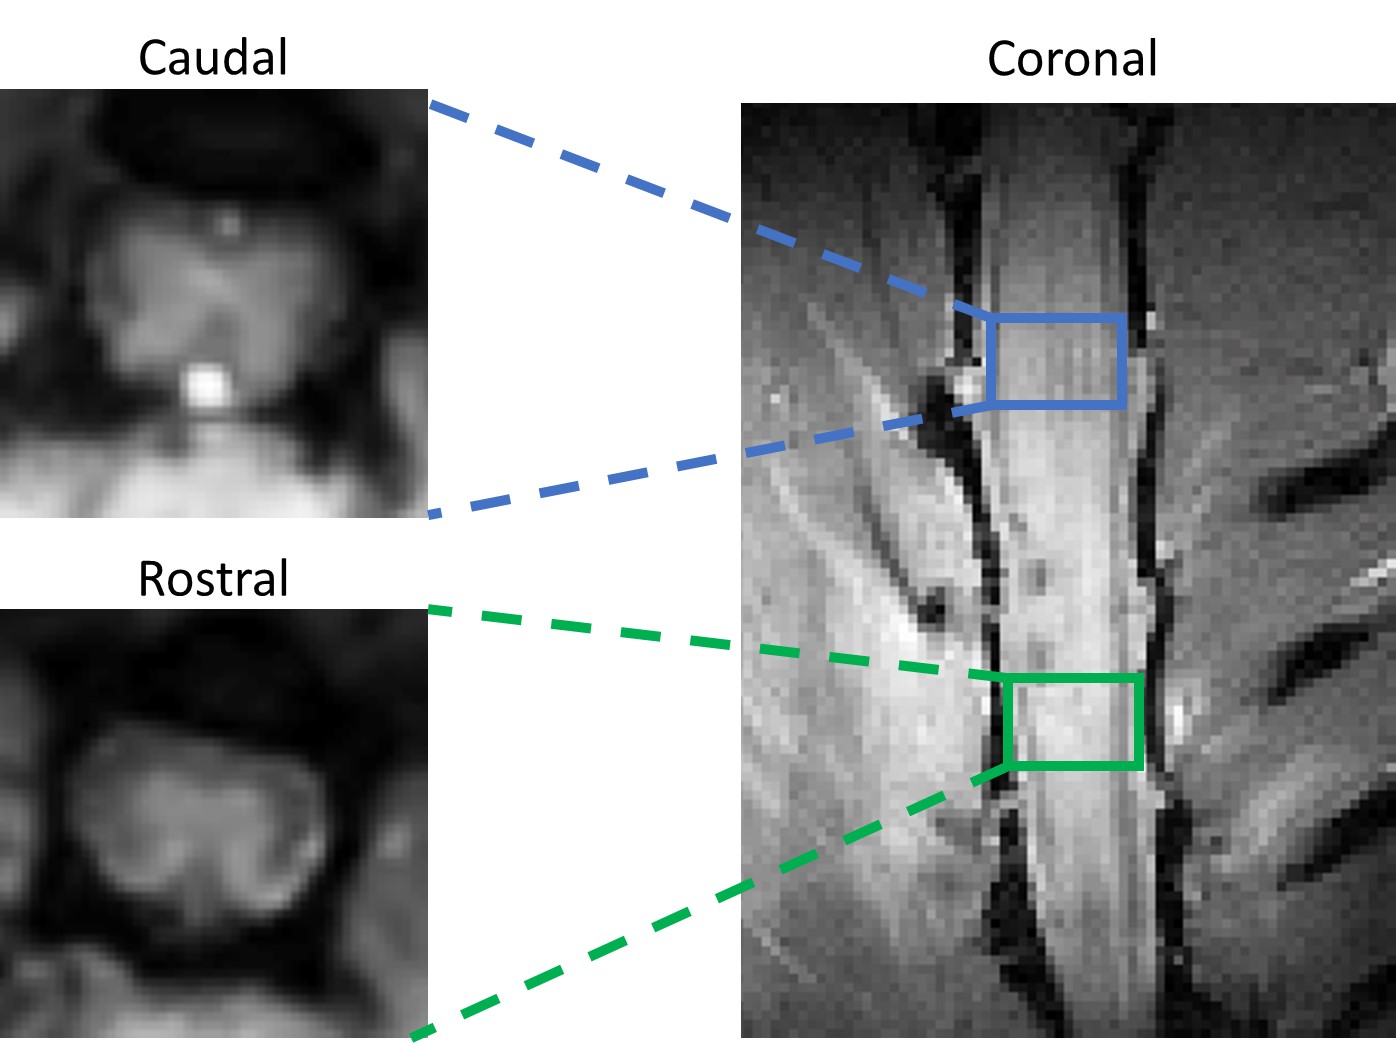
We used quantitative chemical exchange saturation transfer imaging (CEST) MRI and 18F-SSR7, a translocator protein (TSPO) targeting radioligand with PET, to quantify longitudinal changes associated with neuroinflammation in a contusion lumbar (L1) SCI rodent model over 8 weeks post-injury. 14 SCI and 5 sham control rats were studied in total. CEST imaging data was collected on a Varian DirectDriveTM horizontal 9.4T magnet using a CEST sequence with a 2 s rectangular irradiation pulse, followed by a 2-shot spin-echo echo-planar imaging (TR/TE = 3000/29.59 ms; FOV = 32×32 mm2; Matrix size = 96 x 96; Slice thickness = 3mm (axial), 0.8 mm (coronal)). 27 RF offset frequency points were chosen to densely sample around specific pools of interest between -5.0 to 5.0 ppm (-2000 to 2000 Hz). Two axial slices were chosen, one rostral and one caudal to the injury site. Coronal orientation CEST data were acquired from 2 SCI rats and 1 sham injured rat. ROIs were drawn around the spinal cord in the axial images to convert the raw image signal to Z-spectra and subsequently fitted to a 5-pool Lorentzian peak model, corresponding to molecular pools at -3.5 and -1.6 ppm (NOE), 0 ppm (free water), 2.0 ppm (amine), and 3.5 ppm (amide). ROIs for the coronal orientation images were selected to the corresponding axial slice locations at the epicenter, rostral, and caudal to the injury site. For PET imaging, the rats were injected with 18-21 MBq of 18F-SSR7 and imaged 60 min later in an Inveon microPET scanner for 30 min followed by CT scan in a NanoSPECT/CT (Mediso, Washington DC). The PET images were corrected for scatter and attenuation using the CT images and reconstructed using the MAP algorithm. The PET and CT images were registered (based on bed position) and were analyzed using Amide (www.souceforge.net). The PET images were normalized to the injected dose. Three dimensional boxed ROIs were drawn around the apparent site of injury on the spine, above the injury or below it, to quantify tracer uptake.Results
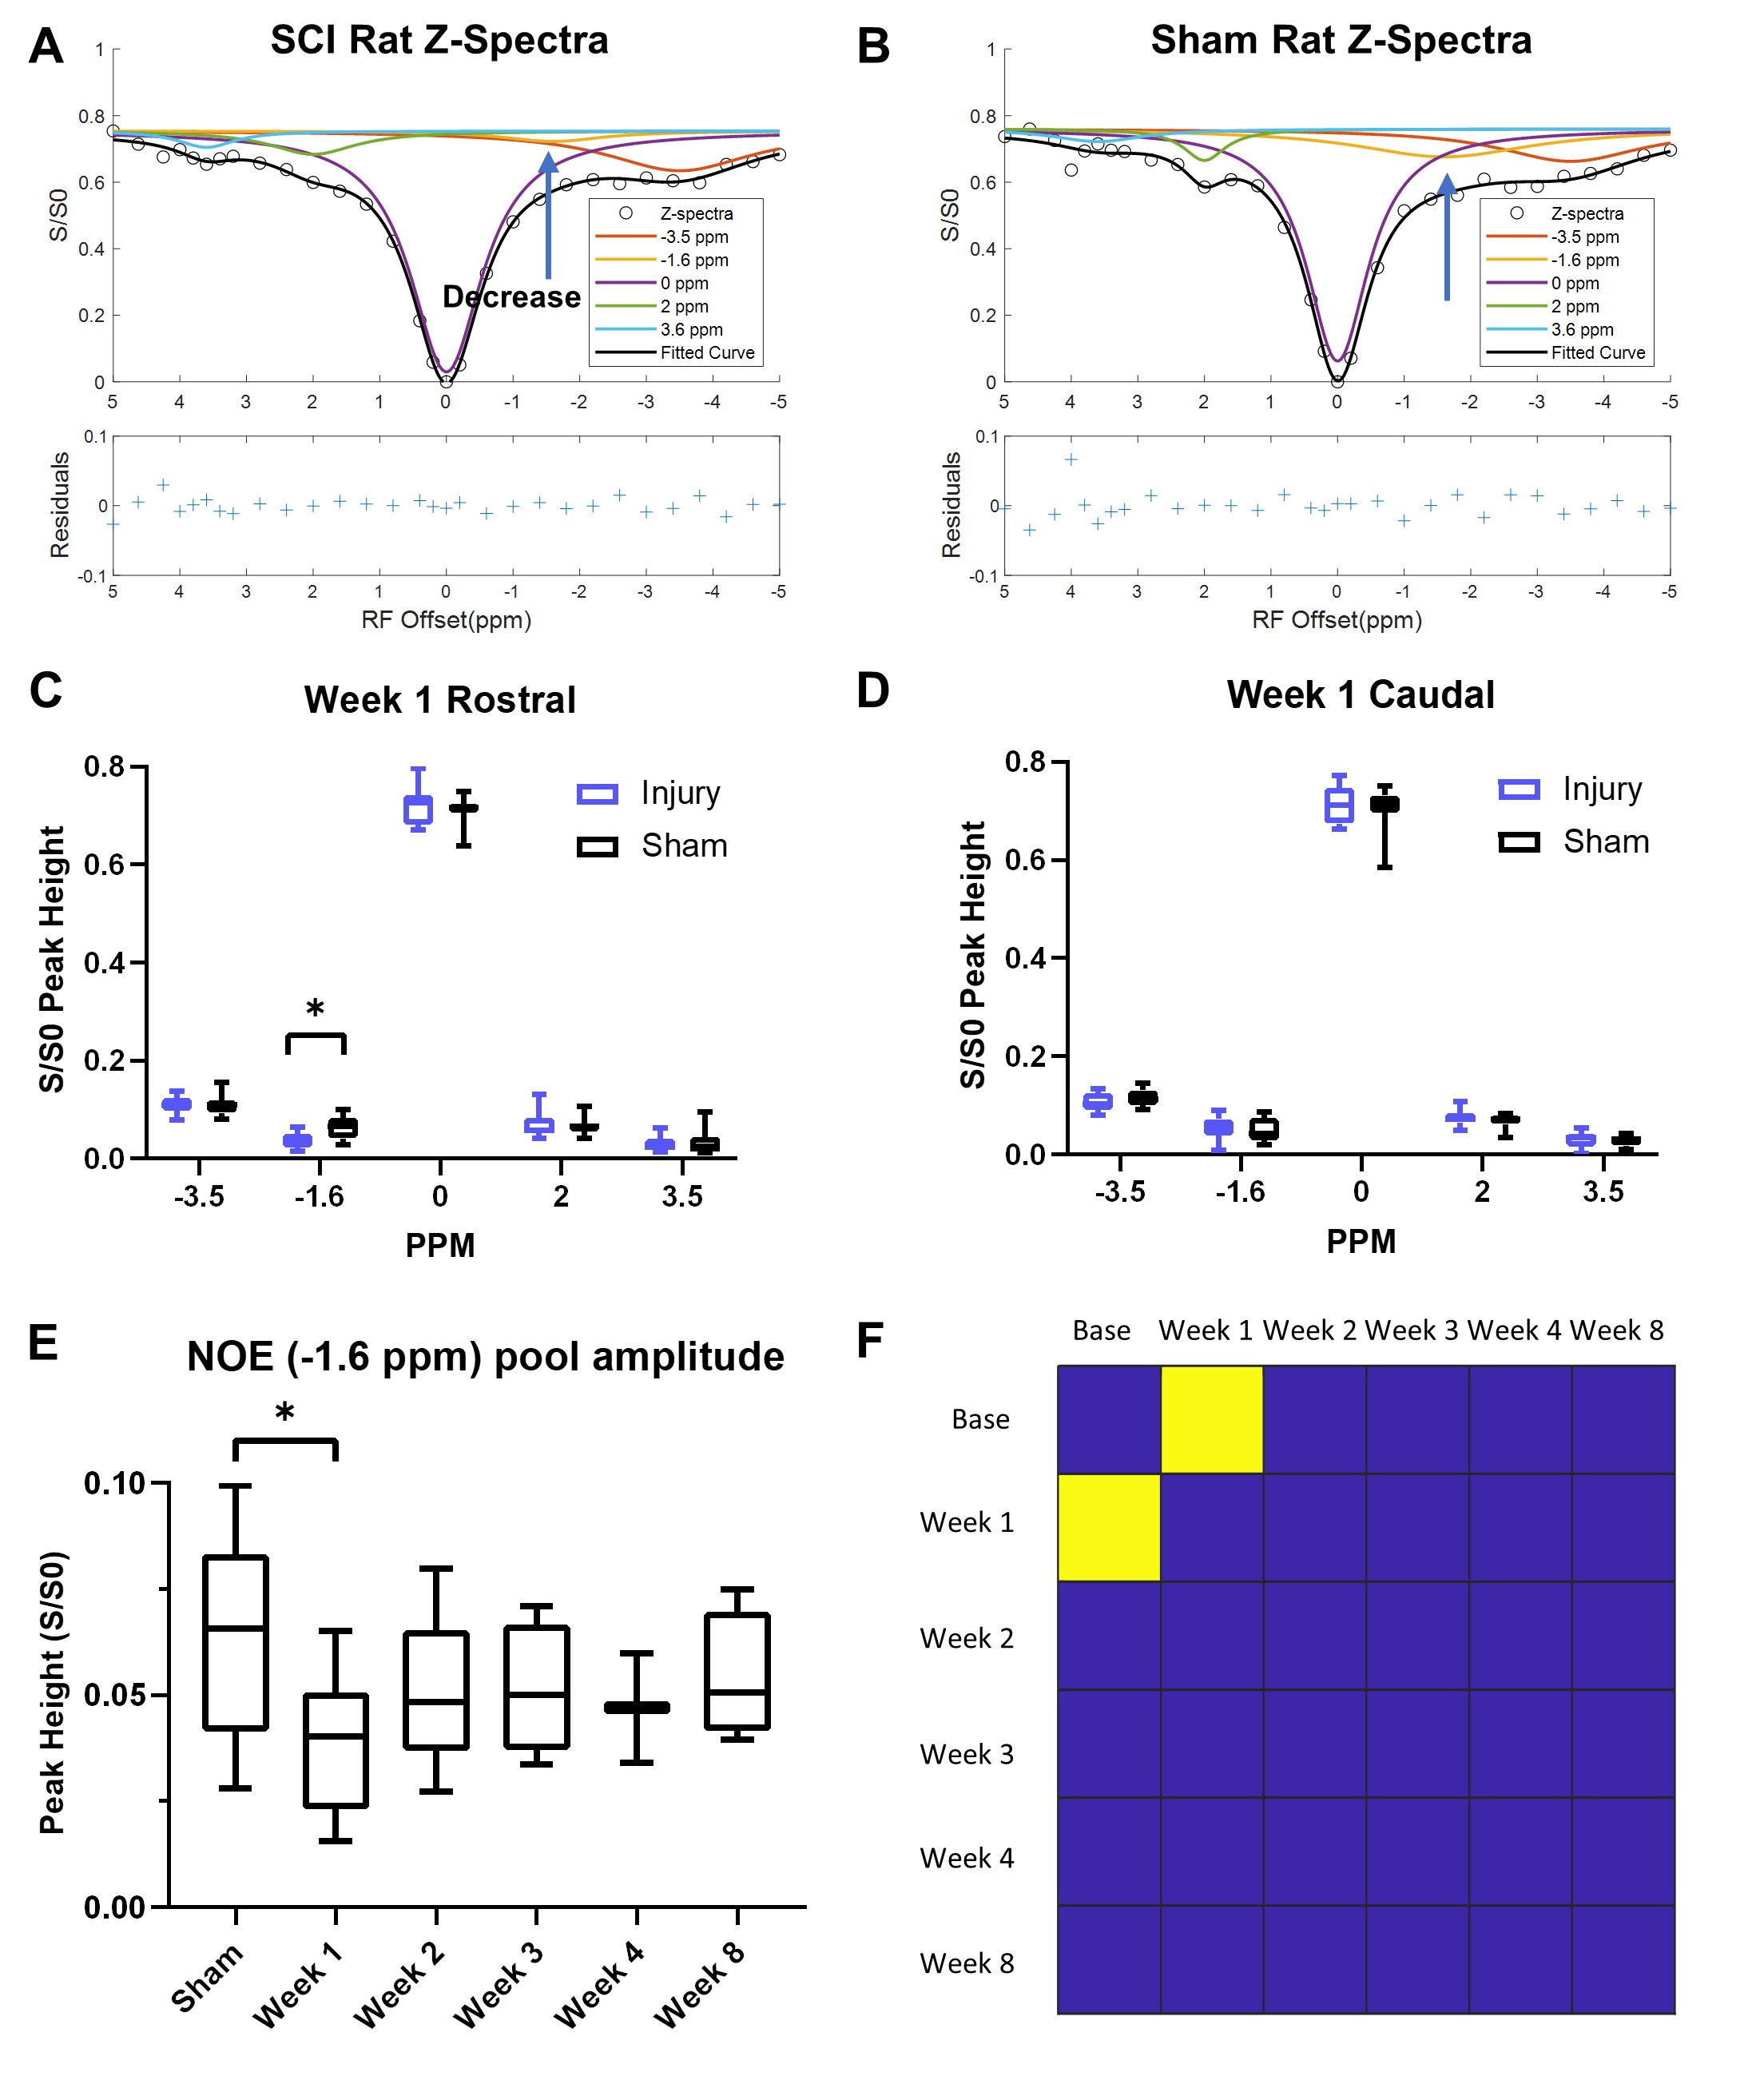
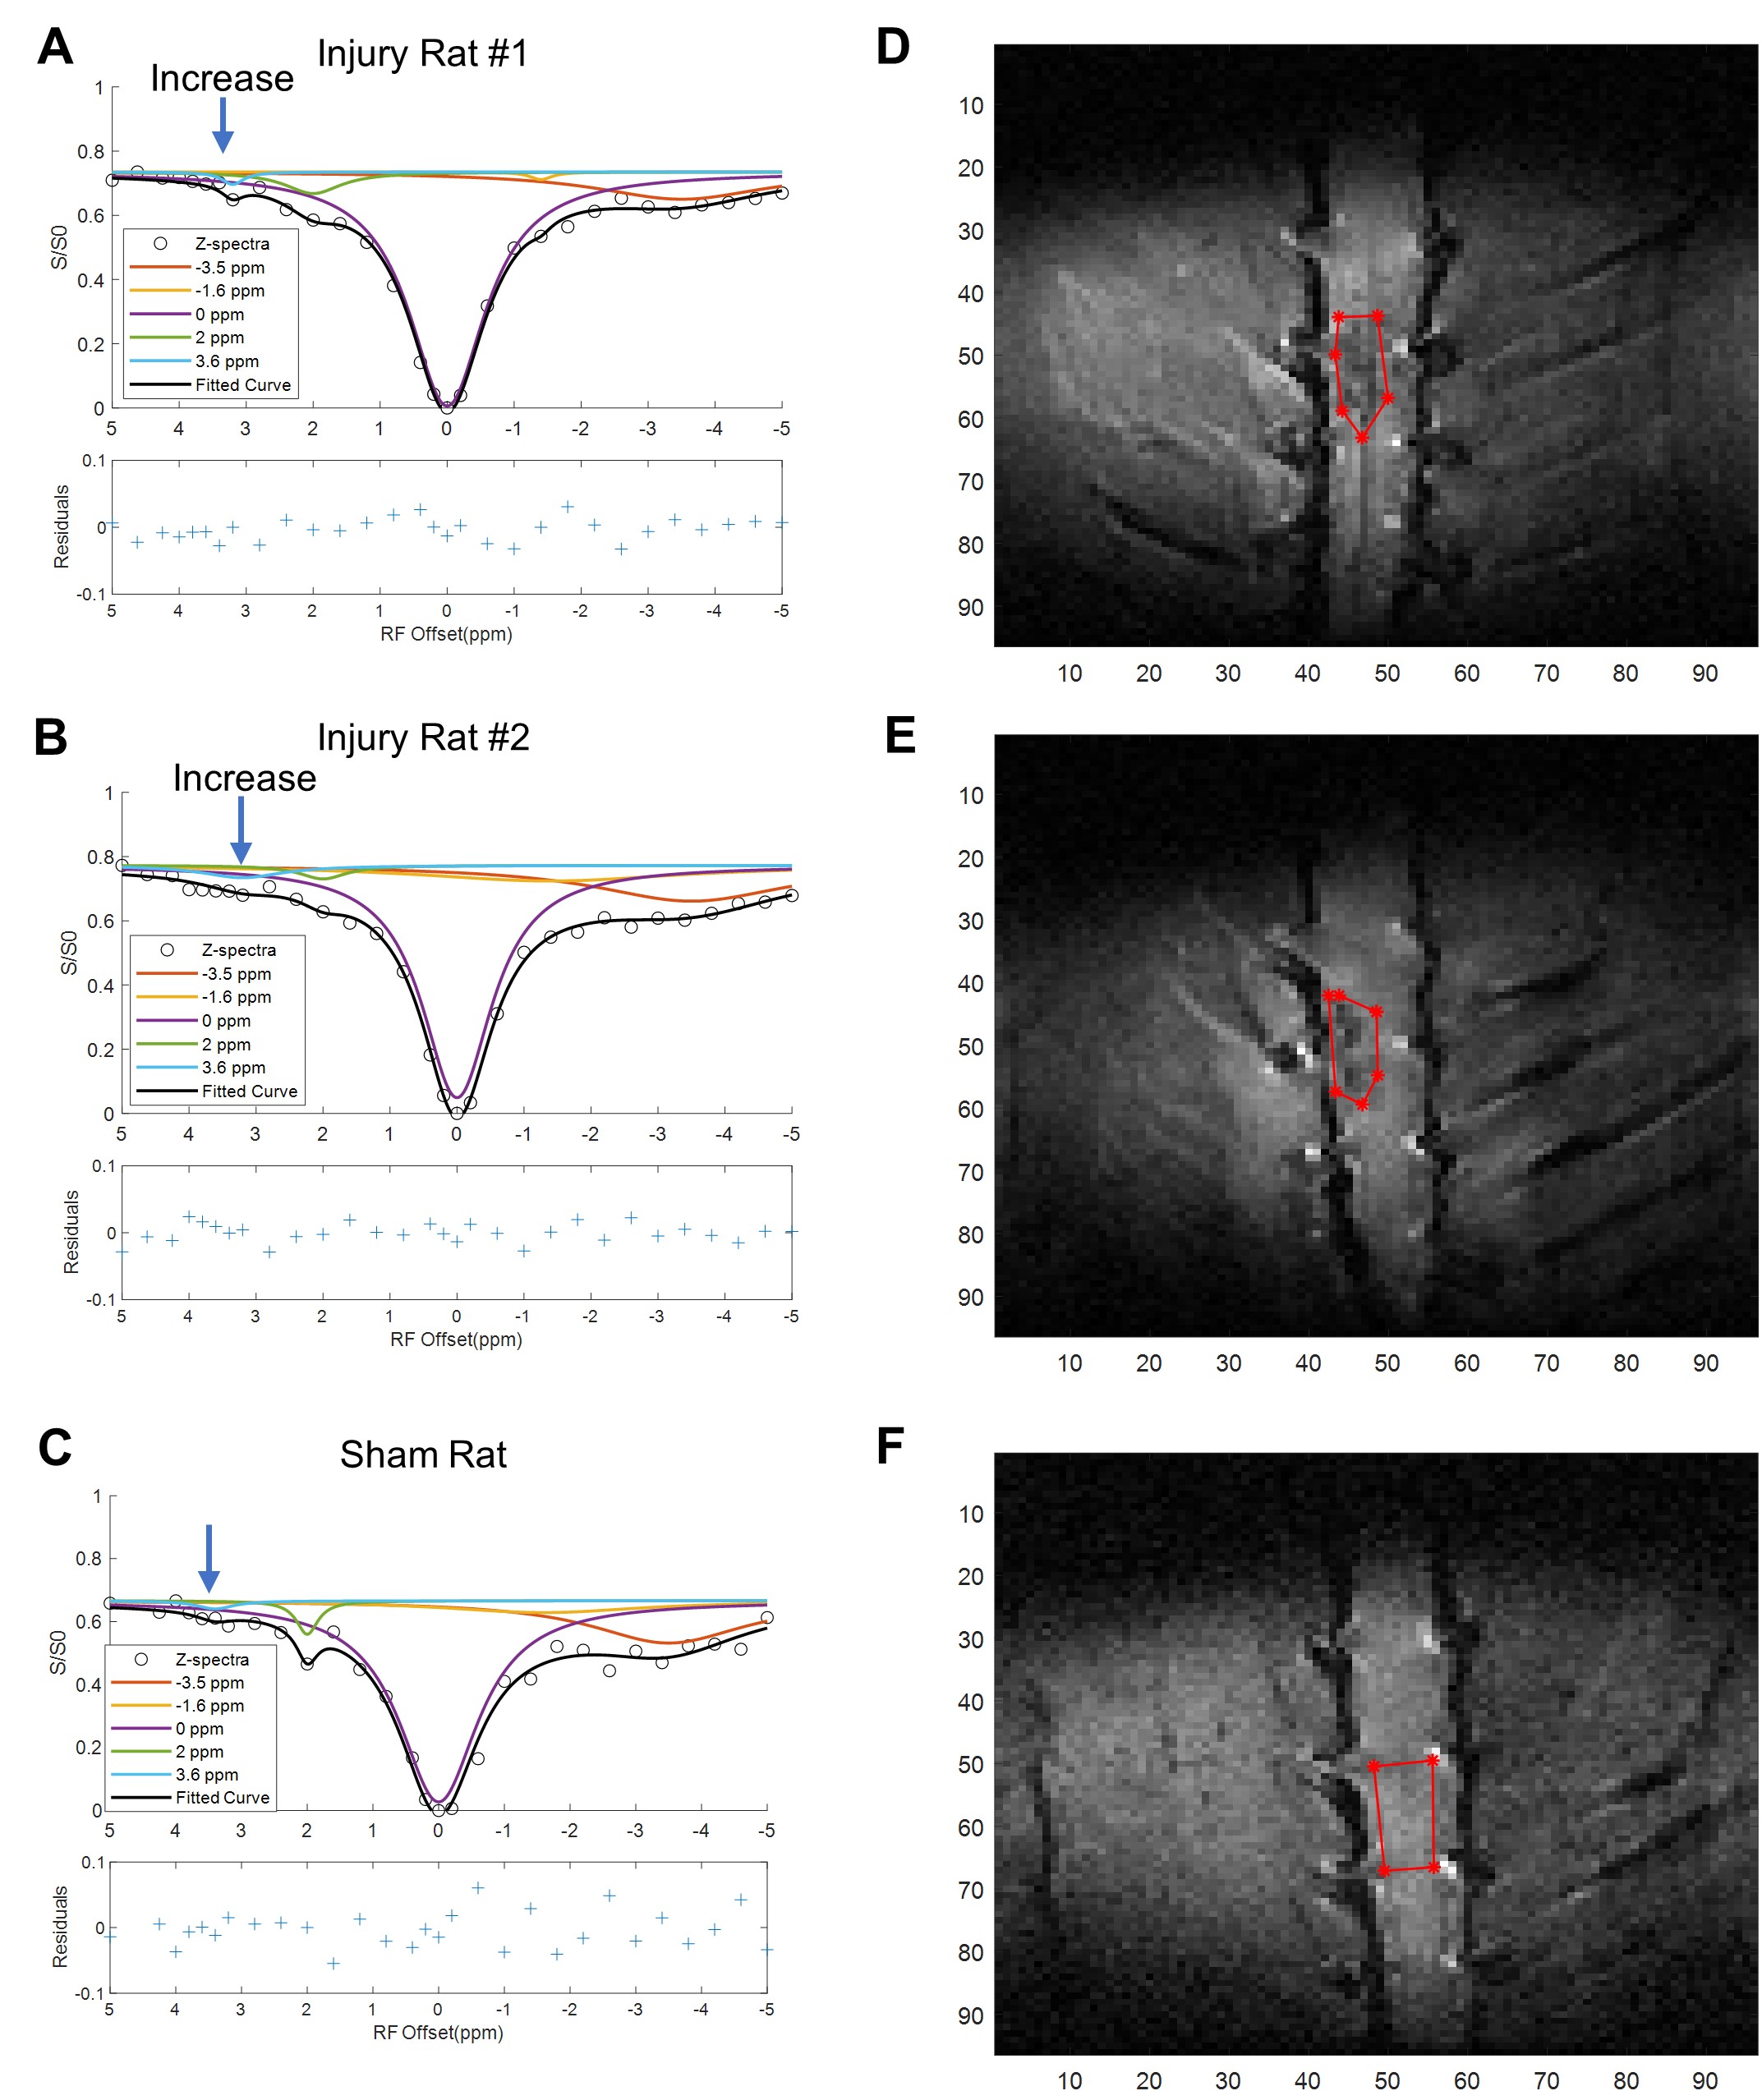
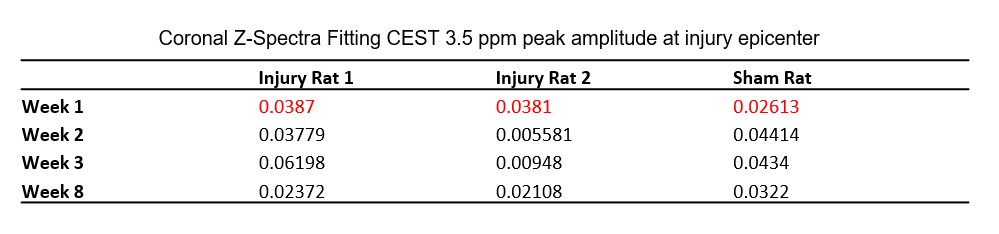
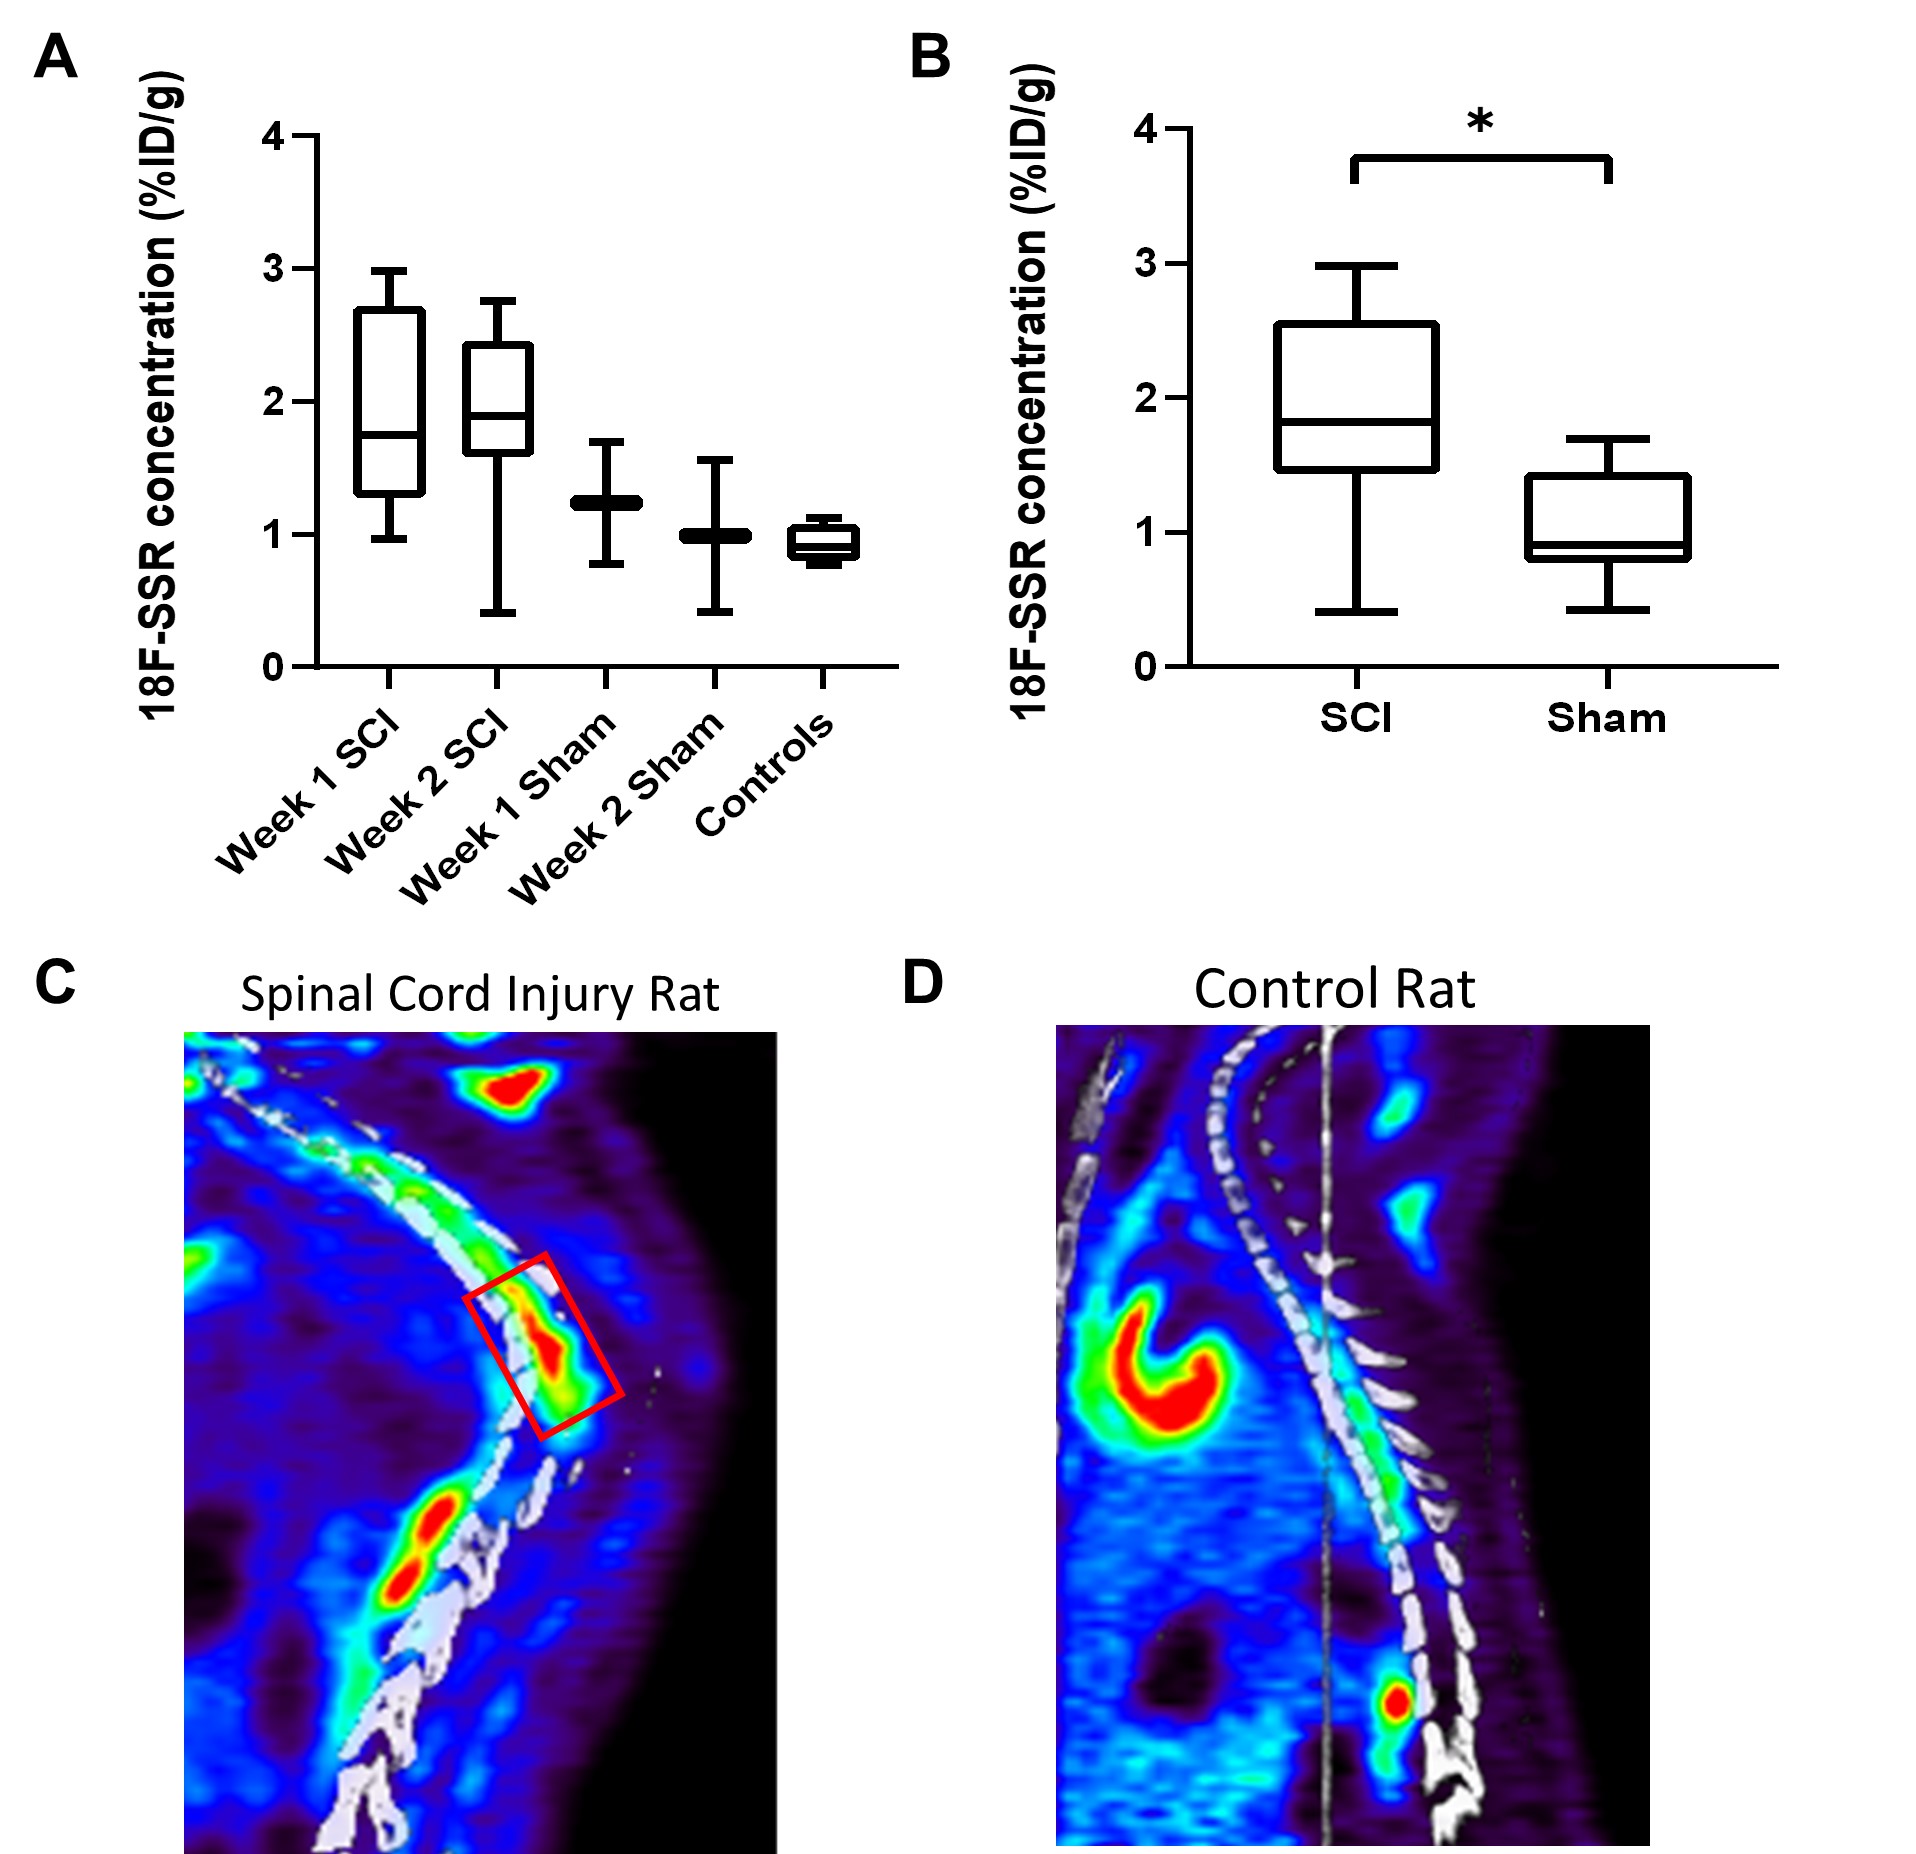
The CEST axial orientation images were acquired rostral and caudal to the SCI epicenter, as outlined in Figure 1. The axial orientation Z-spectra showed that the amplitude of the nuclear Overhauser effect (NOE) peak (at RF offset -1.6 ppm) during the 1st week post-op was significantly lower for SCI compared to sham rats. The peak amplitude increased progressively through 8 weeks post-injury (Figure 2) and was found only rostral to the injury epicenter. The coronal orientation Z-spectra at the injury epicenter ROI showed that the amplitude of the 3.5 ppm CEST pool increased during week 1 post-injury for the SCI rats compared to the sham rats, as shown in Figure 3. The 3.5 ppm peak amplitude values are compared in Table 1. PET images acquired within 10 days post injury demonstrated elevated TSPO radiotracer uptake at and rostral to the injury epicenter for SCI rats, while the sham rats had significantly lower TSPO radiotracer uptake at the L1 lumbar segment region (Figure 4).Discussion
The axial orientation Z-spectra results show a decrease in the NOE (-1.6 ppm) pool in SCI rats. The -1.6 ppm pool has been linked to mobile macromolecules, such as lipid and membrane proteins2, that could be disrupted due to neurodegeneration effects triggered by elevated release of glutamate and pro-inflammatory cytokines at the injury site. The CEST (3.5 ppm) pool has been linked to the amide proton pool3, which includes molecules involved in the neuroinflammatory mechanism and neurotoxicity such as glutamate. The increase in amide pool amplitude in SCI rats further suggests that there is potentially elevated glutamate concentration at the SCI epicenter. TSPO PET imaging results validate the indicators of neuroinflammatory activity found from the CEST Z-spectra. TSPO has been found to be upregulated in activated microglia and astrocytes and during the neuroinflammatory response in general4. The PET imaging results indicate similar neuroinflammatory activity quantified by the high TSPO radiotracer uptake at SCI epicenter and rostral to the injury.Conclusion
The results indicate that the molecular information provided from CEST and NOE measurements in Z-spectra and PET measures are complementary and validate the interpretation of the MRI data. Potentially, CEST and NOE measurements can be used as biomarkers of neuroinflammation dynamics, such as glutamate concentrations. These imaging biomarkers for SCI severity and longitudinal recovery progress can be readily translated for human clinical applications. The novel information will help further development of therapeutic treatments targeting specific SCI pathological mechanisms in preclinical studies.Acknowledgements
One DoD grant (SC190134) funded the study. We thank Zou Yue and Chaohui Tang for their help in creating the injury model and assisting MRI scans.
References
1. Silva, N. A., Sousa, N., Reis, R. L. & Salgado, A. J. From basics to clinical: A comprehensive review on spinal cord injury. Prog. Neurobiol. 114, 25–57 (2014).
2. Zhang, X. Y. et al. A new NOE-mediated MT signal at around -1.6 ppm for detecting ischemic stroke in rat brain. Magn. Reson. Imaging 34, 1100–1106 (2016).
3. Wang, F. et al. Multiparametric MRI reveals dynamic changes in molecular signatures of injured spinal cord in monkeys. Magn. Reson. Med. 74, 1125–1137 (2015).
4. Werry, E. L. et al. Recent Developments in TSPO PET Imaging as A Biomarker of Neuroinflammation in Neurodegenerative Disorders. Int. J. Mol. Sci. 2019, Vol. 20, Page 3161 20, 3161 (2019).
Figures