0389
A 3T/7T multiparametric protocol to characterize amyotrophic lateral sclerosis cervical spinal cord: benefits of ultra-high field MR imaging?1Aix-Marseille Univ, CNRS, CRMBM, Marseille, France, Marseille, France, 2APHM, Hopital Universitaire Timone, CEMEREM, Marseille, France, Marseille, France, 3iLab-Spine International Associated Laboratory, Marseille-Montreal, France-Canada, Marseille, France, 4APHM, Hôpital Universitaire Timone, Reference Center for Neuromuscular Disorders and ALS, Marseille, France, Marseille, France
Synopsis
With comparable acquisition times between 3T and 7T, 7T quantitative protocol offers better resolution and many opportunities to study regional impairments, especially in anterior gray matter subregions.
This preliminary study focused on ALS and age-matched healthy controls scanned at both 3T and 7T.
With the current postprocessing, abnormalities were mostly detected on the lower part of the cord (GM atrophy, WM/GM T1 impairments).
Future work will focus on longitudinal evolution and refined analysis to evaluate the sensitivity for prognostication and to determine individual topological evolution.
INTRODUCTION
Multiparametric MRI (MP) of the spinal cord has emerged as a good strategy to assess disease severity and monitor disease progression in amyotrophic lateral sclerosis (ALS)1. Nevertheless, most techniques developed to date offer limited spatial coverage and/or moderate spatial resolution, which prevents characterization of tissue alteration along the cord, or in specific regions of interest such as the anterior gray matter that contains motor neurons.This study aims to exploit the different newly developed quantitative MRI methods at 7T2,3 to determine whether 7T can bring new elements as compared to 3T to further investigate the topological and longitudinal evolution of the ALS disease.
MATERIAL & METHODS
Cohort: Eight ALS patients (2F/6M, age:57±15 y.o) at early onset were recruited (mean disease duration 17±13 months). Among them, six were scanned at both 3T and 7T (the other two at 7T only). In addition, 6 age-matched healthy controls (HC) were included at 3T (3F/3M, age:55±14 y.o) and 8 at 7T (2F/6M, age:58±13 y.o).Data acquisition: 3T/7T protocols included a T2*w multiecho gradient (MGE) sequence for cross sectional area (CSA), a SE-EPI DTI sequence for diffusion metrics measurements (FA: fractional anisotropy, AD: Axial diffusivity, RD: Radial diffusivity, and MD: Mean diffusivity), as well as a MP2RAGE sequence for both CSA assessment and T1 mapping. Main parameters are summarized in Table.1. Acquisition times at 3T and 7T were of the same order.
Data analyses: mean MP values were processed in various spinal cord structures (SC :Spinal cord, WM :White matter, GM :Gray matter) and substructures (aiGM: anterior and intermediate GM and WM tracts including WM-pst: posterior sensory tract, WM-cst: corticospinal tract and WM-lst: lateral sensory tract), using the Spinal Cord Toolbox4, the PAM505 and AMU7T6 Atlases, and various SCT and ants commands7.Statistical analyses were performed using JMP9 (Wilcoxon test). P-values<0.05 were considered as statistically significant.
RESULTS & DISCUSSION
Fig.1 shows individuals quantitative maps obtained on ALS patients at 3T and 7T. 7T images thanks to increased spatial resolution allowed visualizing substructures (anterior median fissure, anterior WM tracts, central canal, GM horns) usually contaminated by partial volume.It should nonetheless be noted that MGE images did not always present with such quality. Due to sequential 7T and 3T examinations, difficulties for the patients to stay still, a large proportion of MGE images were artifacted, precluding acurate CSA measurements. CSA measurements were thus derived from T1-MP2RAGE images at both 7T and 3T. Correlations between CSA_T1_7T, CSA_T1_3T and CSA_T2*_7T are illustrated on Fig.2A. CSA differences were attributed to non (yet) optimized automatic segmentation algorithm for 7T and/or T1 quantitative contrast. Assuming a similar bias for both HC and ALS, CSA were measured in both SC and GM (cf. Fig.2B,C). No statistical differences SC T1-CSA could be noticed. GM T1-CSA demonstrated significant differences on the lower cervical cord levels (LCL) in ALS at 7T.
When comparing, T1 metrics between controls and ALS patients, averaged T1 values at 7T were systematically found higher for ALS patients (Fig.3A). T1 differences were statistically significant in all ROIs for lower cervical cord(p=0.0105) and only in WM-lst (p=0.0228) for upper levels. At 3T, increased T1 values were observed with significance for all ROIs at both levels.
Current analyses did not lead to statistical differences when considering the DTI metrics, except in WM_pst. With the current ROI definition (from PAM50), this area may be contaminated by contribution from the septum. Further analyses and use of dedicated atlases6 have to be investigated.
CONCLUSION & PERSPECTIVES
With comparable acquisition times between 3T and 7T, 7T protocol offers better resolution and many opportunities to increase the robustness of MRI measurements. In this preliminary comparative study, gray and white matter were sharply delineated at 7T, with the potential to quantify the ventral horns of gray matter, as well as other subtructures not shown here (anterior WM, dorsal GM, ...) since PVE-contaminated at 3T. For 7T quantitative MRI, it may be interesting to take advantages of recently proposed templates6,8, to fully take advantages of the image resolution and avoid potential contamination from septum or central canal that may exist with the current PAM50 tracts.In this study, with the current postprocessing, abnormalities were mostly detected on the lower part of the cord. Future work will focus on longitudinal evolution (MR exploration at 3 and 6 months) and refined analyses to evaluate the sensitivity for prognostication and to determine individual topological evolution.
Acknowledgements
Thierry Latran foundation and MarMara InstituteReferences
1. El Mendili, M. M., Querin, G., Bede, P. & Pradat, P.-F. Spinal Cord Imaging in Amyotrophic Lateral Sclerosis: Historical Concepts—Novel Techniques. Front. Neurol. 10, 350 (2019).
2. Granziera, C. et al. Quantitative magnetic resonance imaging towards clinical application in multiple sclerosis. Brain 144, 1296–1311 (2021).
3. Massire, A. et al. High-resolution multi-parametric quantitative magnetic resonance imaging of the human cervical spinal cord at 7T. NeuroImage 143, 58–69 (2016).
4. De Leener, B. et al. SCT: Spinal Cord Toolbox, an open-source software for processing spinal cord MRI data. NeuroImage 145, 24–43 (2017).
5. De Leener, B. et al. PAM50: Unbiased multimodal template of the brainstem and spinal cord aligned with the ICBM152 space. NeuroImage 165, 170–179 (2018).
6. Massire, A., Rasoanandrianina, H., Guye, M. & Callot, V. Anterior fissure, central canal, posterior septum and more: New insights into the cervical spinal cord gray and white matter regional organization using T1 mapping at 7T. NeuroImage 205, 116275 (2020).
7. Avants, B. B. et al. A reproducible evaluation of ANTs similarity metric performance in brain image registration. NeuroImage 54, 2033–2044 (2011).
8. Gros, C., Asiri, A., De Leener, B., Watson, C., Cowin, G., Ruitenberg, M., Kurniawan, N., Cohen-Adad, J., 2020. Ex vivo MRI template of the human cervical cord at 80μm isotropic resolution, in: Proceedingsof the 28th Annual Meeting of ISMRM. Presented at the ISMRM.
Figures
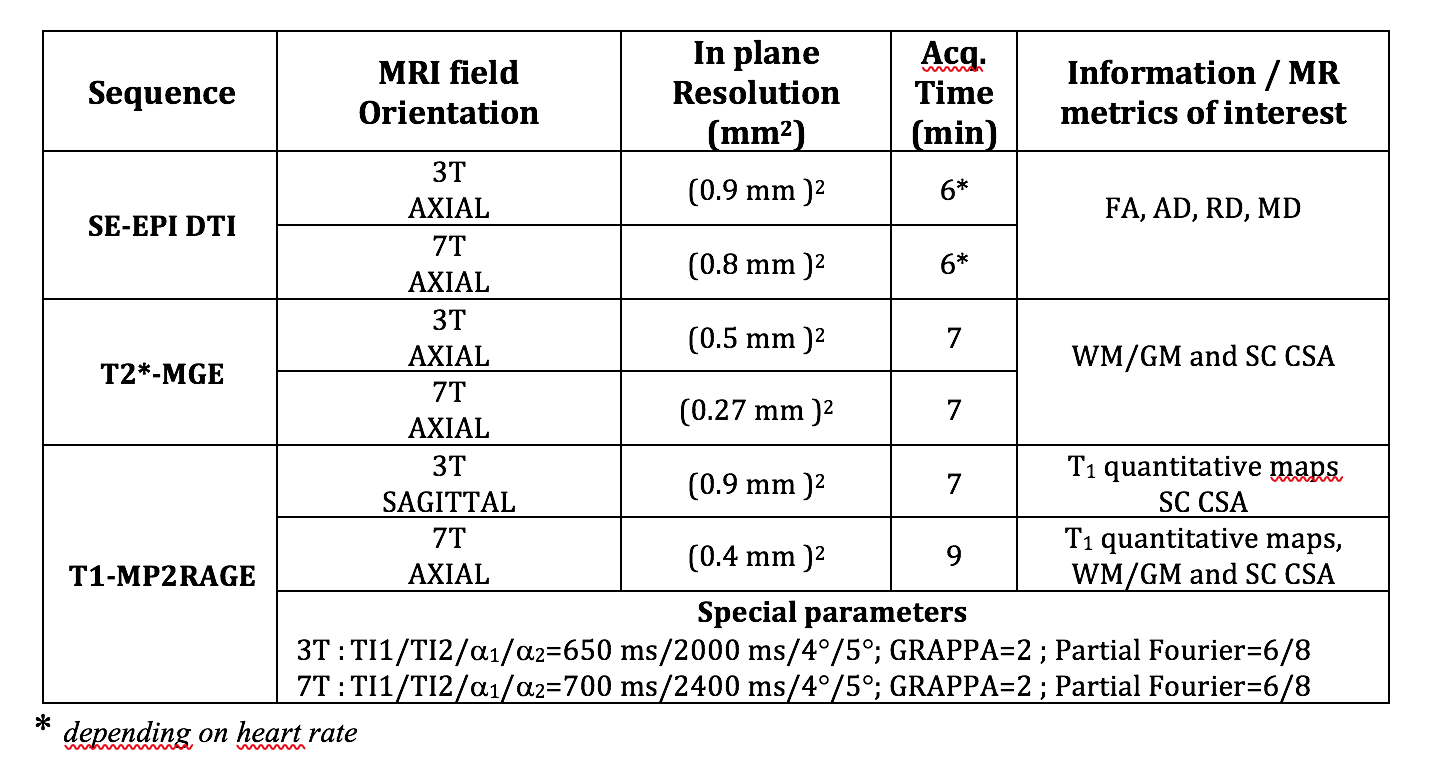
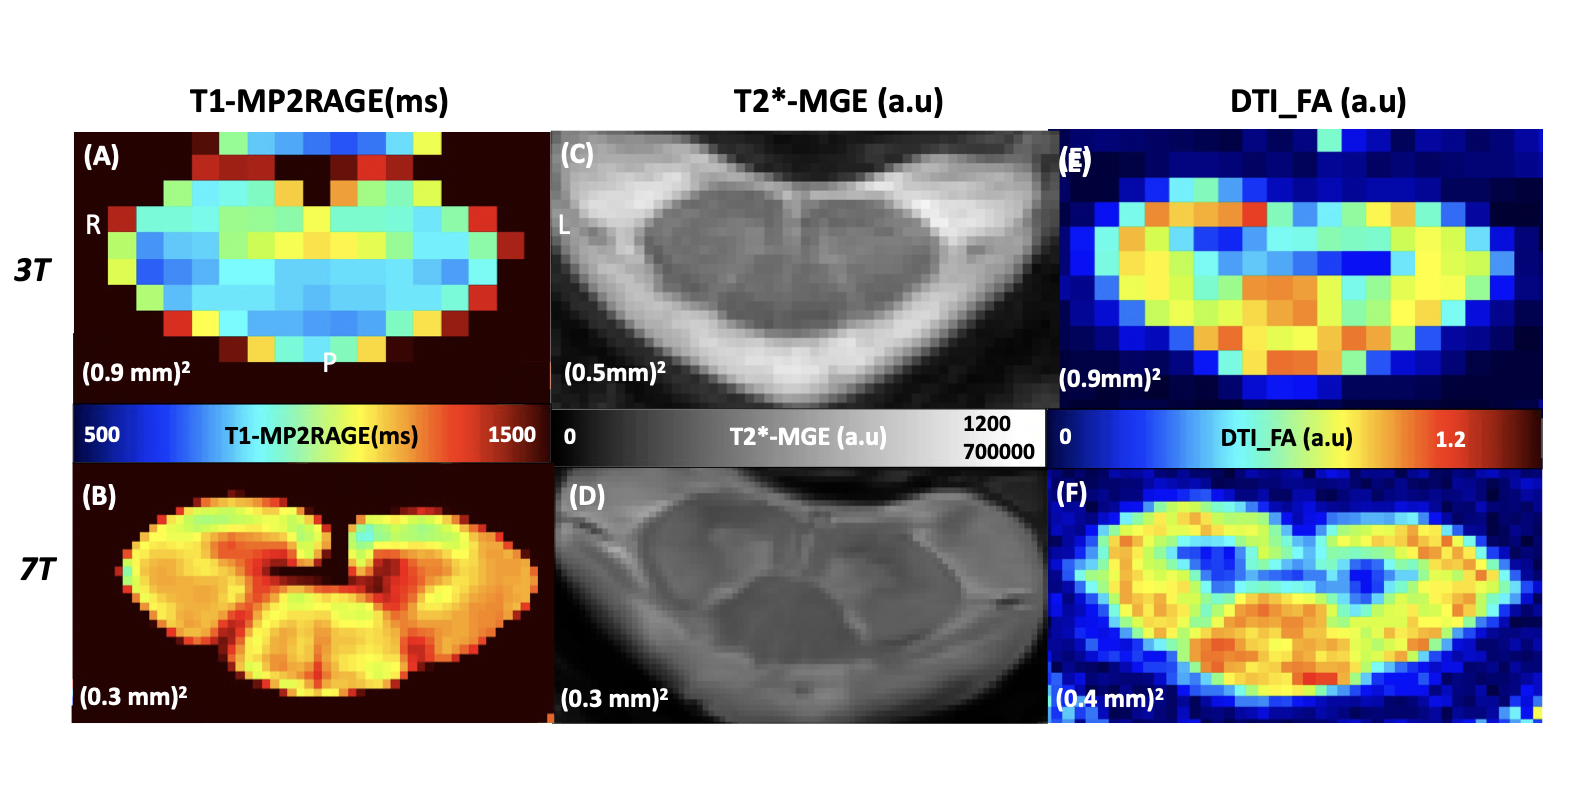
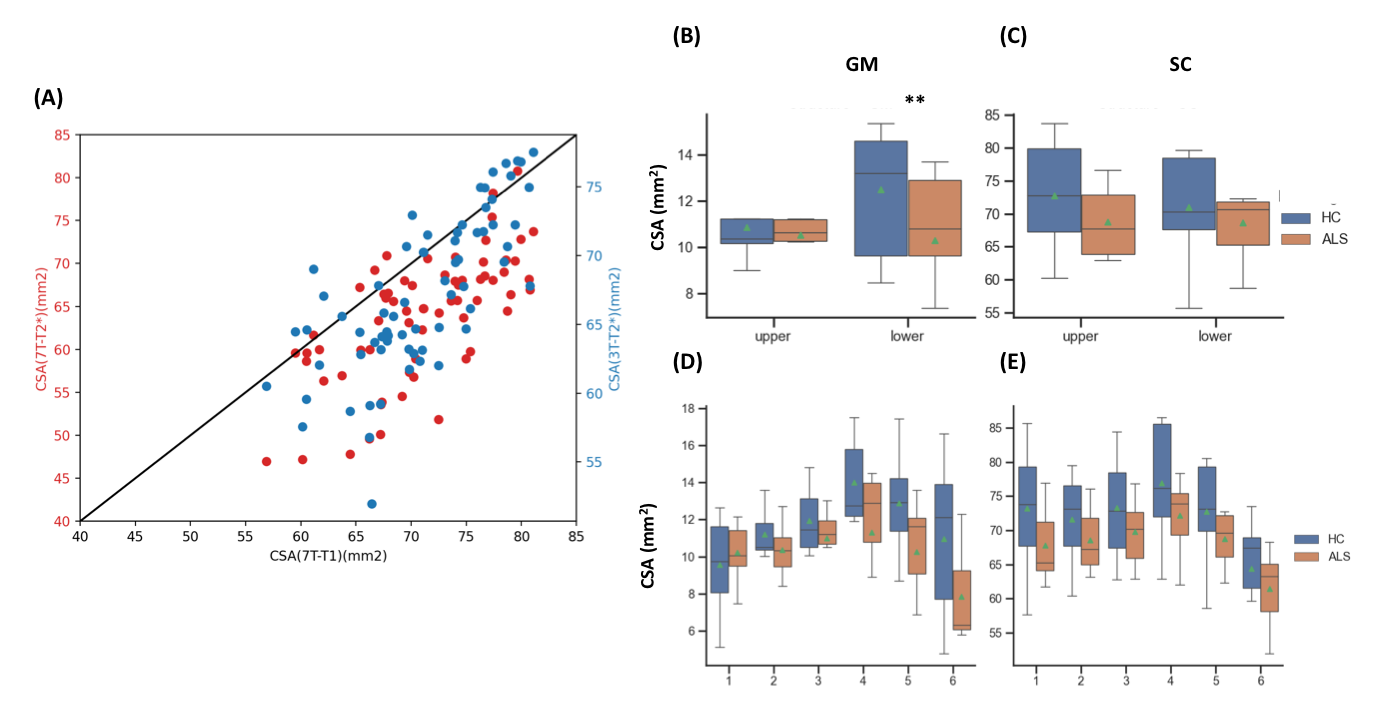

Fig.3:(A) Averaged values of T1(ms) obtained at UCL and LCL in ROIs from the PAM50 template5:(yellow) WM-cst: corticospinal tracts, (red) WM-pst. posterior sensory tract, (green) WM-lst.lateral sensory tracts and (blue)aiGM:anterior and intermediate GM. The green markers in boxplots show mean T1 values in ALS patients(orange) and HC (blue ).*:p<0.5,***:p<0.001Averaged T1 maps ( axial view), in AMU7T template space6 at C2(B-C) and C6 level(D-E), averaged across 8 HC (top) and 8 ALS patients(bottom).Significant impairement in WM-lst for UCL and in all ROIs for LCL are observed.