0385
In-vivo 31P MRSI in healthy and malignant human pancreas at 7 Tesla
Leonard W.F. Seelen1,2, Lieke van den Wildenberg1, Ayhan Gursan1, Tijl A. van der Velden1, Mark Gosselink1, Martijn Froeling1, Wybe J.M. van der Kemp1, Firdaus A.A. Mohamed Hoesein3, Nadia Haj Mohammad4, I. Quintus Molenaar2, Hjalmar C. van Santvoort2, Dennis W.J. Klomp1, and Jeanine J. Prompers1
1Dept. of Radiology, University Medical Center Utrecht, Utrecht, Netherlands, 2Dept. of Surgery, UMC Utrecht Cancer Center and St Antonius Hospital Nieuwegein: Regional Academic Cancer Center Utrecht, Utrecht University, Utrecht, Netherlands, 3Dept. of Radiology, University Medical Center Utrecht, Utrecht University, Utrecht, Netherlands, 4Dept. of Medical Oncology, UMC Utrecht Cancer Center, Regional Academic Cancer Center Utrecht, Utrecht University, Utrecht, Netherlands
1Dept. of Radiology, University Medical Center Utrecht, Utrecht, Netherlands, 2Dept. of Surgery, UMC Utrecht Cancer Center and St Antonius Hospital Nieuwegein: Regional Academic Cancer Center Utrecht, Utrecht University, Utrecht, Netherlands, 3Dept. of Radiology, University Medical Center Utrecht, Utrecht University, Utrecht, Netherlands, 4Dept. of Medical Oncology, UMC Utrecht Cancer Center, Regional Academic Cancer Center Utrecht, Utrecht University, Utrecht, Netherlands
Synopsis
Early response assessment for patients with pancreatic cancer receiving chemotherapy is limited. Detection of alterations in 31P metabolite levels during treatment could change this perspective. However, to date 31P MRS has not yet been demonstrated in the human pancreas in vivo. Here we show in-vivo 31P MRSI data in the pancreas of healthy subjects, using a 31P whole-body transmit coil in combination with a 16-channel receive array at 7T, and show moderate to good test-retest reliability. In addition, we demonstrate the feasibility of performing 31P MRSI in a patient with pancreatic cancer before and after chemotherapy.
Introduction
Pancreatic ductal adenocarcinoma (PDAC) is an aggressive malignancy with a dismal prognosis, of which the incidence is increasing.1-3 Patients with PDAC are usually treated with chemotherapy. However, there are limitations in the assessment of early treatment response.Phosphorus magnetic resonance spectroscopy (31P MRS) is a non-invasive technique that has been shown to enable detection of early treatment-induced metabolic alterations in different tumors.4 Nevertheless, to date 31P MRS has not yet been demonstrated in the human pancreas in vivo. The penetration depth of commonly used 31P surface coils is limited and the pancreas is located more or less in the center of the abdomen, which makes 31P MRS of the pancreas extremely challenging. With the development of a 31P whole-body transmit coil for a 7T MRI scanner5 and by using a multi-channel 31P receive array6, 31P signals can be measured also from deeper lying tissues in the abdomen, providing the opportunity to measure in-vivo 31P MR spectra from the pancreas.
The first aim of this study was to determine the repeatability of 31P MRSI of the pancreas of healthy subjects at 7T. Secondly, we aimed to determine the feasibility of obtaining 31P MRSI data from a patient with PDAC.
Methods
The institutional review board approved this study and all participants gave written informed consent. Ten healthy volunteers (six males and four females, age 34±12y) participated in the repeatability study. In addition, one patient with PDAC (age 27y, tumor 94mmx41mm on CT images) was included. We used a whole-body 7T MR system (Philips Healthcare, Best, NL) with an in-house designed 31P whole-body birdcage transmit coil (diameter 60cm) to perform 31P MRSI at 120.6 MHz.5 In addition, a body array with 16 31P loop coils and 8 transmit-receive fractioned 1H dipole antennas6,7 was used to receive the 31P signals and perform 1H MRI, respectively. All healthy participants were scanned twice on the same day. The patient was also scanned twice, but on different days, i.e., before and after four cycles (8 weeks) of chemotherapy. B0 maps were acquired for B0 shimming and transversal and coronal T1-weighted images were measured with the same field of view and number of slices as for 31P MRSI. 31P spectra were acquired with a pulse-acquire sequence with a block pulse (carrier frequency set to phosphocreatine, B1=6mT), followed by phase encoding gradients for 3D spatial encoding. The following acquisition parameters were used: FOV=500(LR)×280(AP)×360(FH)mm3, nominal resolution=20mm isotropic, TR/TE=60/0.56ms, FA=12°, BW=5000Hz, NSA=20, acquisition time=22:37min. Matlab R2019a (The Mathworks Inc., Natick, MA) was used to reconstruct the 31P MRSI data. Principal component analysis (PCA)-based denoising was performed before applying Roemer channel combination.8,9 A mask around the pancreatic head/body was manually drawn on the T1w images. The data in the mask was quantified using AMARES in the spectroscopy fitting tool (OXSA).10-12 The following metabolites were fitted: a-, b-, and g-ATP, inorganic phosphate (Pi), glycerophosphocholine (GPC), glycerophosphoethanolamine (GPE), phosphocholine (PC), phosphoethanolamine (PE), nicotinamide adenine dinucleotide (NADH), uridine diphosphate glucose (UDPG), phosphatidylcholine (PtdC), and phosphocreatine (PCr). Variability was assessed with Bland-Altman analyses (coefficients of repeatability (CR) and bias), intraclass correlation coefficients (ICC), t-tests (p-value), and within-subject coefficients of variation (CoV).13Results
Figure 1 shows an example of the pancreas mask on the 31P MRSI grid (in one slice) and the 31P MR spectrum in one of the voxels. On average 6±2 voxels were used for quantification of pancreas 31P metabolites in scan 1, and 5±2 voxels in scan 2. No significant differences were observed in 31P metabolite levels between scan 1 and scan 2 of healthy subjects (p-values>0.05; Figure 2). ICC’s were higher than 0.50 for most metabolites, indicating moderate (ICC=0.5-0.75) to good (ICC=0.75-0.9) repeatability, except for b-ATP, PC, PtdC. CoV’s ranged from 4.95% for a-ATP to 38.83% for GPE (excluding PtdC). Bland-Altman plots of variability in relative 31P metabolite levels are shown in Figure 3. In the patient, 10 voxels were selected in the pancreatic tumor before therapy and 7 voxels after therapy, of which 2 were discarded because of contamination with biliary PtdC (Figure 4). Figure 5 shows the GPC, GPE, PC, and PE levels and combined phosphodiester (PDE) and phosphomonoester (PME) levels in the individual tumor voxels in the patient before and after therapy, next to the average values in the pancreas of the healthy subjects. GPC seems higher in the patient compared to controls, and PC, PE and PME increased significantly after therapy.Discussion and conclusion
To the best of our knowledge, we have shown here the first in-vivo 31P MRS data of the human pancreas. Repeatability of 31P MRSI in the healthy pancreas was moderate to good and comparable to the repeatability of 31P MRSI previously determined in the liver at 7T,14 also for the lower-concentration metabolites. In addition, we have shown the feasibility of performing 31P MRSI in a patient with PDAC and detected changes in PME levels in the tumor before and after four cycles of chemotherapy. In conclusion, in-vivo 31P MRSI of the human pancreas is feasible at 7T with the use of a 31P whole-body transmit coil in combination with a 31P receive array, and has potential for monitoring treatment response in pancreatic cancer.Acknowledgements
Dutch Cancer Society and Technical Sciences and St. Antonius Hospital Nieuwegein Research FundReferences
1. Vincent A, Herman J, Schulick R, et al. Pancreatic cancer. Lancet. 2011 Aug 13;378(9791):607-20.2. Siegel RL, Miller KD, Jemal A. Cancer statistics, 2020. CA Cancer J Clin. 2020 Jan;70(1):7-30.
3. Rahib L, Smith BD, Aizenberg R, et al. Projecting cancer incidence and deaths to 2030: the unexpected burden of thyroid, liver, and pancreas cancers in the United States. Cancer Res. 2014 Jun 1;74(11):2913-21.
4. Negendank W. Studies of human tumors by MRS: a review. NMR Biomed. 1992 Sep-Oct;5(5):303-24.
5. Löring J, Van der Kemp WJM, Almujayyaz S, et al. Whole-body radiofrequency coil for 31P MRSI at 7T. NMR Biomed. 2016 Jun;29(6):709-20.
6. Van Houtum Q, Mohamed Hoesein FAA, Verhoeff JJC, et al. Feasibility of 31P spectroscopic imaging at 7 T in lung carcinoma patients. NMR Biomed. 2021 May;34(5):e4204.
7. Raaijmakers AJE, Italiaander M, Voogt IJ, et al. The fractionated dipole antenna: A new antenna for body imaging at 7 Tesla. Magn. Reson. Med. 2016 Mar;75(3):1366-74.
8. Roemer PB, Edelstein WA, Hayes CE, et al. The NMR Phased Array. Magn. Reson. Med. 1990 Nov;16(2):192-225.
9. Froeling M, Prompers JJ, Klomp DWJ, et al. PCA denoising and Wiener deconvolution of 31P 3D CSI data to enhance effective SNR and improve point spread function. Magn Reson Med. 2021;85:2992-3009.
10. Vanhamme L, Van Den Boogaart A, Van Huffel S. Improved Method for Accurate and Efficient Quantification of MRS Data with Use of Prior Knowledge. Journal of Magnetic Resonance. 1997 Nov;129(1):35-43.
11. Purvis LAB, Clarke WT, Biasiolli L, et al. OXSA: An open-source magnetic resonance spectroscopy analysis toolbox in MATLAB. PLoS One. 2017 Sep 22;12(9):e0185356.
12. Purvis LAB, Clarke WT, Biasiolli L, et al. Line-width constraints in Matlab AMARES using pre-Metabolite T2 and per-Voxel Delta B0. in In Proceedings of the 22nd Annual Meeting of ISMRM, p. 2885.
13. Hyslop NP, White WH. Estimating Precision Using Duplicate Measurements. J. Air Waste Manage. Assoc. 2009 Sep;59(9):1032-9.
14. Purvis LAB, Clarke WT, Valkovič L, et al. Phosphodiester content measured in human liver by in vivo 31 P MR spectroscopy at 7 tesla. Magn Reson Med. 2017 Dec;78(6):2095-2105.
Figures
Figure 1: A) One slice of the transversal T1-weighted 7T MRI of subject 5, with the pancreas indicated with the red line; B) 31P MRSI grid; C) Selected voxels (green) in the pancreatic mask with in D) a 31P MR spectrum of one voxel in the pancreas. No apodization was applied in the spectrum.
Figure 2: 31P metabolite quantification results in the pancreatic masks of healthy subjects in scan 1 and scan 2 and the repeatability measures: intraclass correlation coefficient (ICC), t-test results (p-value), intra-subject coefficient of variance (CoV), coefficient of repeatability (CR) and bias. Obtained metabolites are expressed as percentage of the sum of all fitted signals. Combined phosphomonoester (PME) and phosphodiester (PDE) levels were calculated from the fit results of the obtained PC, PE, GPC and GPE metabolites.
Figure 3: Bland-Altman plots of variability in relative 31P metabolite levels. Each colour represents one subject. The green dashed line shows the bias from zero and the blue dashed lines mark the 95% confidence interval.
Figure 4: A/D) One slice of the transversal T1-weighted 7T MRI of the PDAC patient, with the pancreatic tumor indicated with the red line; B/E) Selected voxels (green) in the pancreatic tumor mask with in C/F) a 31P MR spectrum of one voxel in the tumor, before and after four cycles of chemotherapy. The red voxel in the tumor mask after therapy was discarded because of contamination from biliary PtdC. No apodization was applied in the spectra.
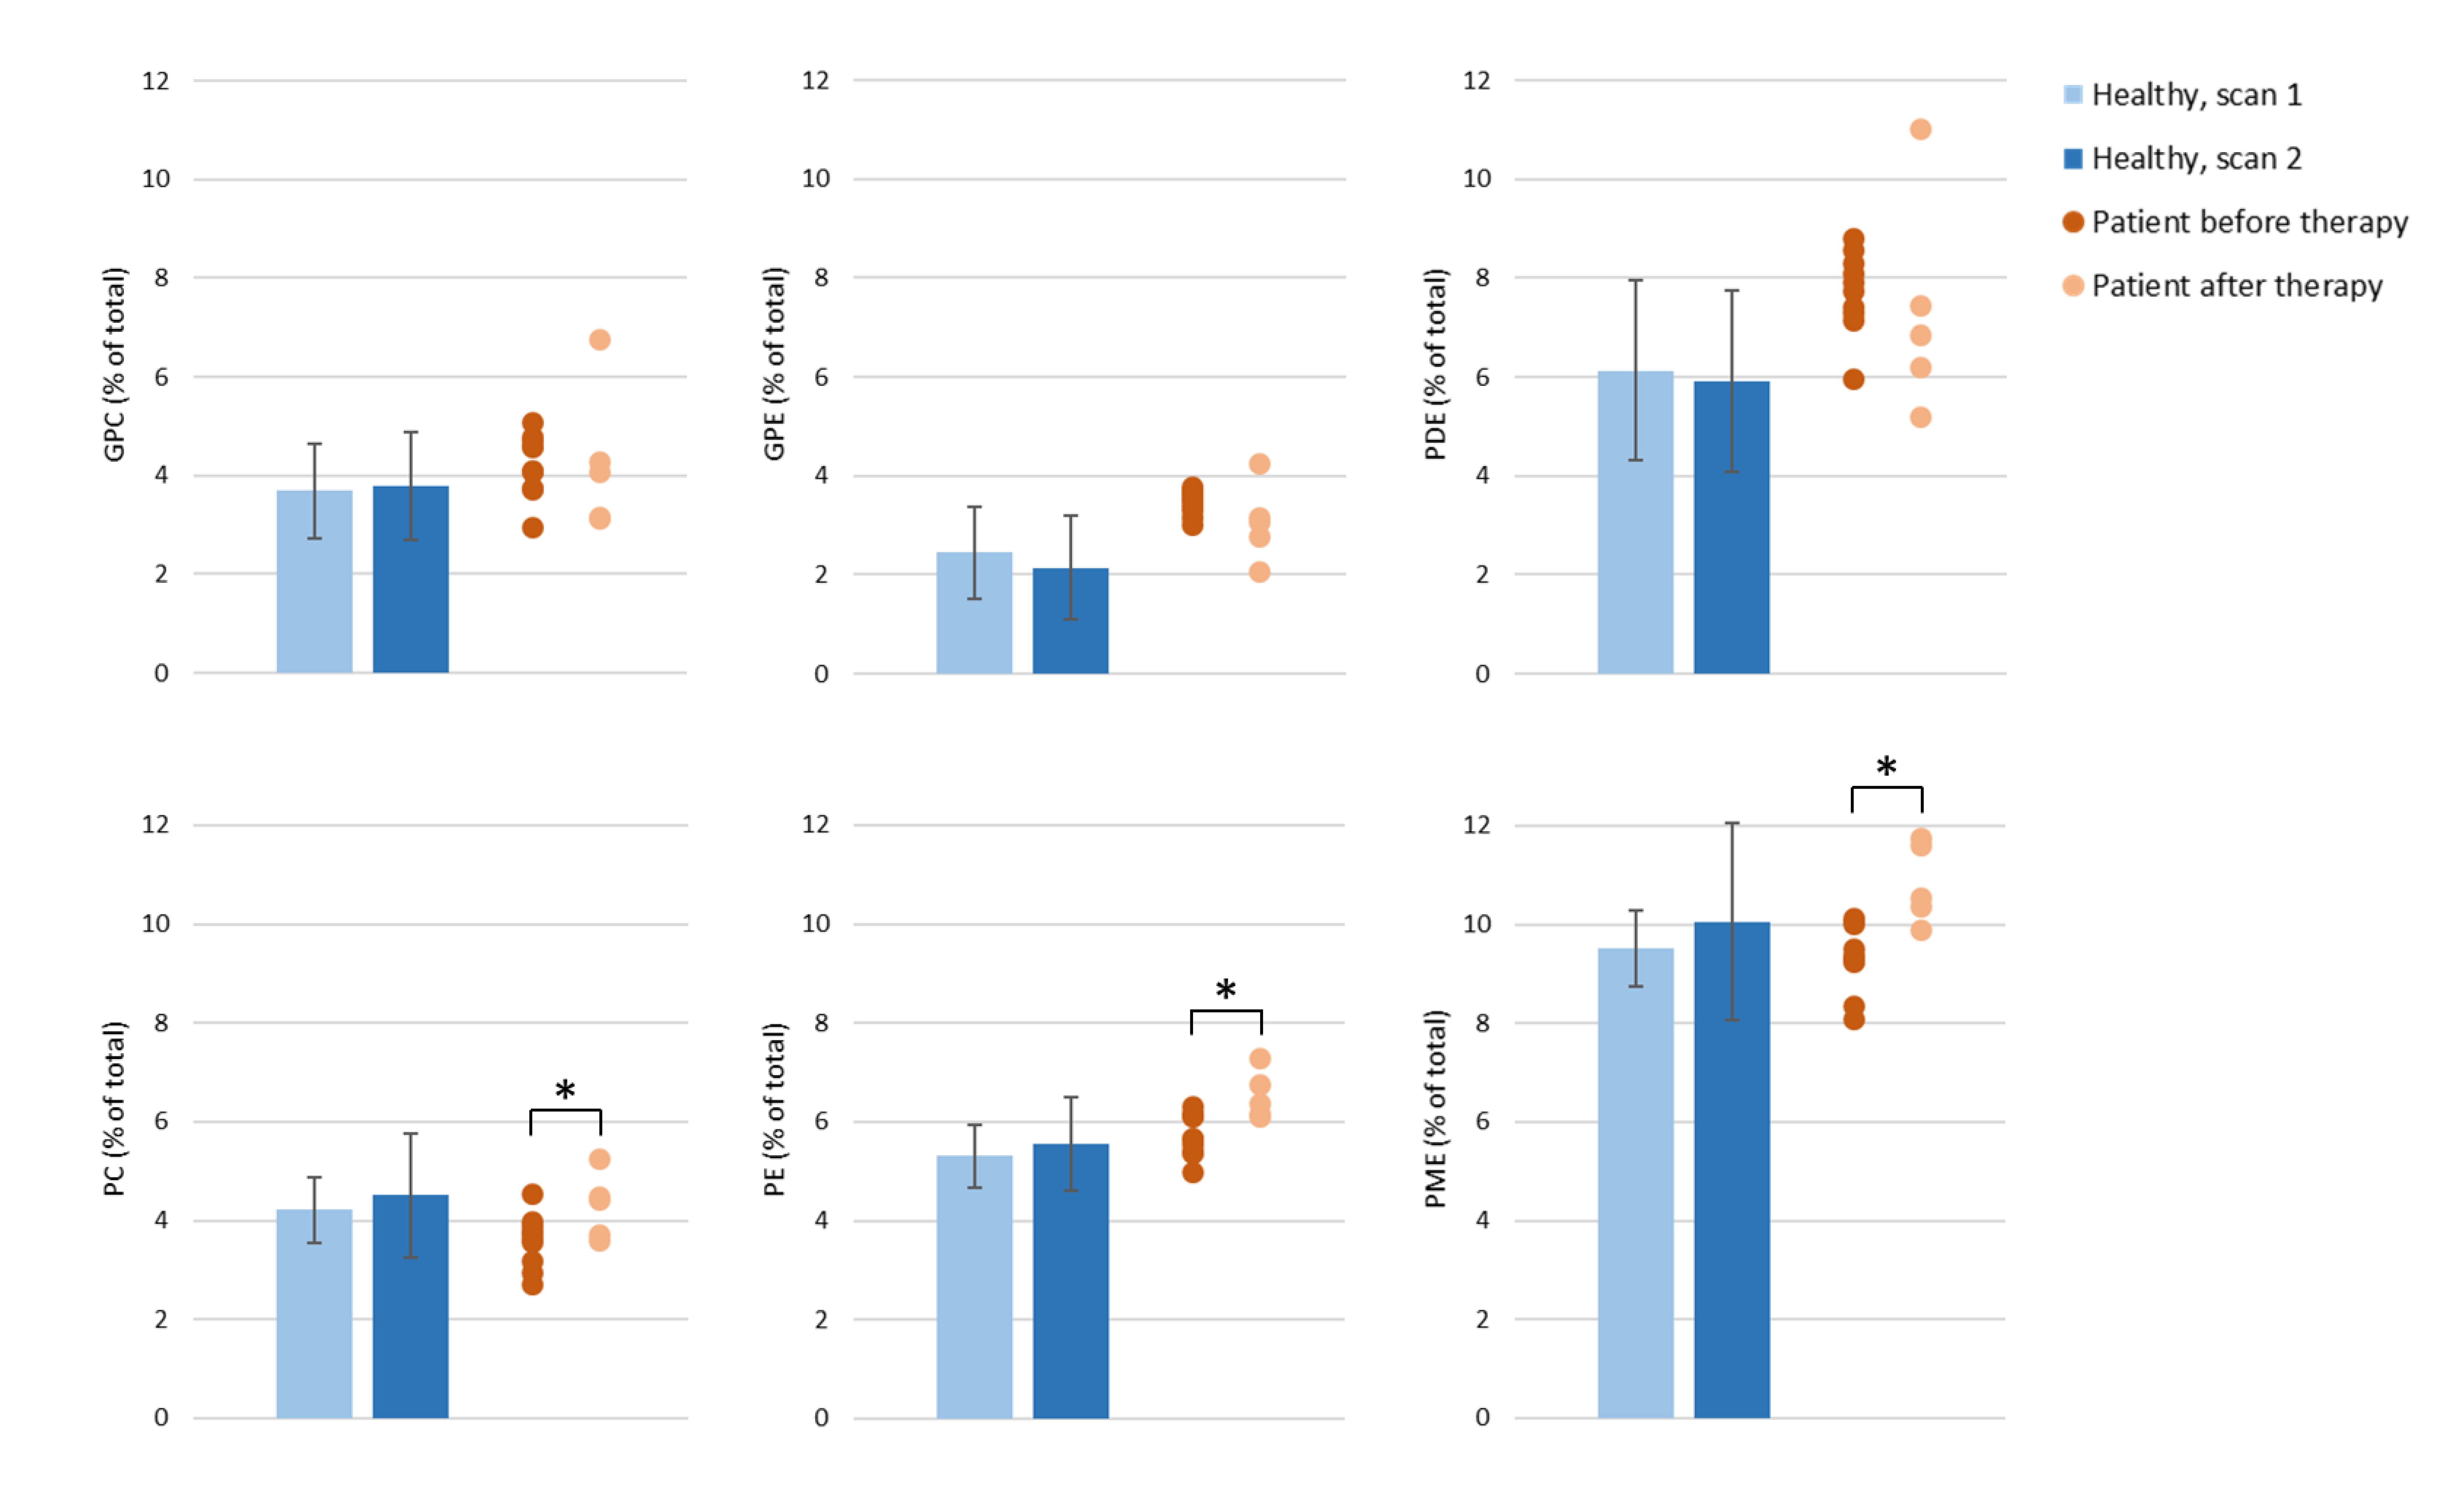
Figure 5: A comparison of the quantified GPC, GPE, PDE, PC, PE and PME levels in the pancreas of healthy subjects (average of scan 1 and average of scan 2) and in the pancreatic tumor of the patient before and after chemotherapy. For the patient, each dot represents a measurement from one voxel in the tumor (10 voxels before therapy and 5 voxels after therapy). The metabolites levels are expressed as percentage of the sum of all fitted signals. * p-value<0.05.
DOI: https://doi.org/10.58530/2022/0385