0380
Diagnostic Performance of Diffusion Weighted Imaging, Arterial Spin Labeling and Amide Proton Transfer in sub-classifications of gliomas1Lanzhou University Second Hospital, Lanzhou, China, 2Philips Healthcare, Xi'an, China
Synopsis
To assess the diagnostic performance of Amide Proton Transfer (APT) and Arterial Spin Labeling (ASL) for distinguishing different sub-classifications of gliomas in comparison with Diffusion Weighted Imaging (DWI). Forty patients underwent sequences including T1W enhancement, DWI, APT and 3D-pCASL. ADCmean, ADCmean-to-ADCNAWM ratio, APTmean, APTmean-to-APTNAWM ratio, regional cerebral blood flow (rCBF) and rCBFmean-to-rCBFNAWM ratio are calculated. The results showed that diagnostic accuracy of APTmean was superior in distinguishing sub-classifications of gliomas than other parameters. We concluded that APT can be used in predicting sub-classification of gliomas based on WHO CNS5, providing more valuable supplementary information for early treatment guidance and surgery.
Introduction
To introduce recent research of molecular biomarkers, the fifth edition of the WHO Classification of Tumors of the Central Nervous System (WHO CNS5) published in 2021, emphasizing the role of molecular diagnostics. Among these molecular biomarkers, isocitrate dehydrogenase (IDH), telomerase reverse transcriptase gene promoter (TERTp), and 1p/19q codeletion played more important role in predicting sub-classifications of gliomas. Based on the three molecular alterations described above, we defined sub-classifications that have different individual effects in treatment response, recurrence pattern, and especially survival rate1. Diffusion-Weighted Imaging (DWI) based apparent diffusion coefficient (ADC) is routinely used in diagnostic of gliomas, indicating diffusion in tissues. John Maynard et al found that ADC could predict isocitrate dehydrogenase status in World Health Organization grade II/III gliomas2. Amide proton transfer (APT) imaging, designed to detect endogenous mobile proteins and peptides in tissues, provides information of the cellular proliferation levels that can be exploited to study the biological behaviors of tumors3. Arterial spin labeling (ASL) can visualize regional cerebral blood flow (rCBF) that is related to cellular proliferation without contrast agent 4. In this study, we intend to assess the diagnostic performance of APT imaging and ASL for distinguishing different sub-classifications of gliomas in comparison with ADC.Methods
Based on CNS5 and Passow’ research1, forty patients with IDH, TERTp, and 1p/19q codeletion alterations, whose pathological confirmed gliomas, were divided into five groups. In grade 2-3, Astrocytoma, IDH-mutation only group (Hereinafter referred to as astrocytoma, 8 cases), Oligodendroglioma, IDH-mutation, 1p/19q-codeleted (Hereinafter referred to as oligodendroglioma) with TERTp-mt group (13cases) and with TERTp-wt group(7cases) was presented. Grade 4 included glioblastoma, IDH-wildtype (Hereinafter referred to as glioblastoma) with TERTp-mt group (7cases) and with TERTp-wt group(5cases). Routine sequences like T1W enhancement, DWI, APT and 3D-pCASL were carried out on a 3T scanner (Ingenia CX, Philips Healthcare, the Netherlands) using a 32 channel head coil. 3D-pCASL imaging was obtained by using a three-dimensional pseudo continuous pulse sequence. DWI, ASL, and APT images were automatically coregistered to the FLAIR and post-contrast 3D-T1W images by performing a rigid transformation of the datasets, in order to accurately define the tumor borders. Three separate ROIs with an area of 25–30 mm2 were placed on the solid portion of each sub-classification, avoiding intra-tumoral blood vessels, hemorrhage, cystic or necrotic regions, and the mean value for each parameter (ADC, APTw, and rCBF) was recorded. Following a previous study5, three “mirror” comparative ROIs were placed in the normal-appearing white matter(NAWM) of the opposite. Thereafter, ADCmean-to-ADCNAWM, APTmean-to-APTNAWMand rCBFmean-to-rCBFNAWM ratios were calculated, resulting in six parameters (ADCmean, ADCmean-to-ADCNAWMratio, APTmean, APTmean-to-APTNAWM ratio, rCBFmean and rCBFmean-to-rCBFNAWM ratio) per patient. Correlation analysis between parameters obtained from DWI, ASL, and APT imaging were analyzed using Spearman correlation analysis. We further employed receiver operating characteristic curve (ROC) analysis to assess the diagnostic performance of all parameters’ metrics.Results
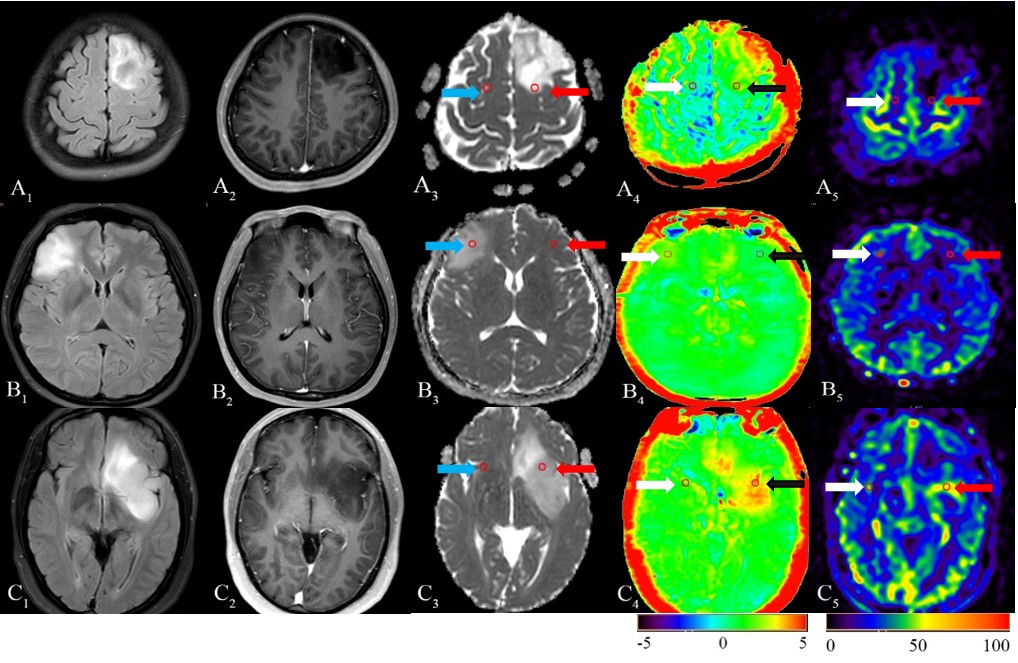
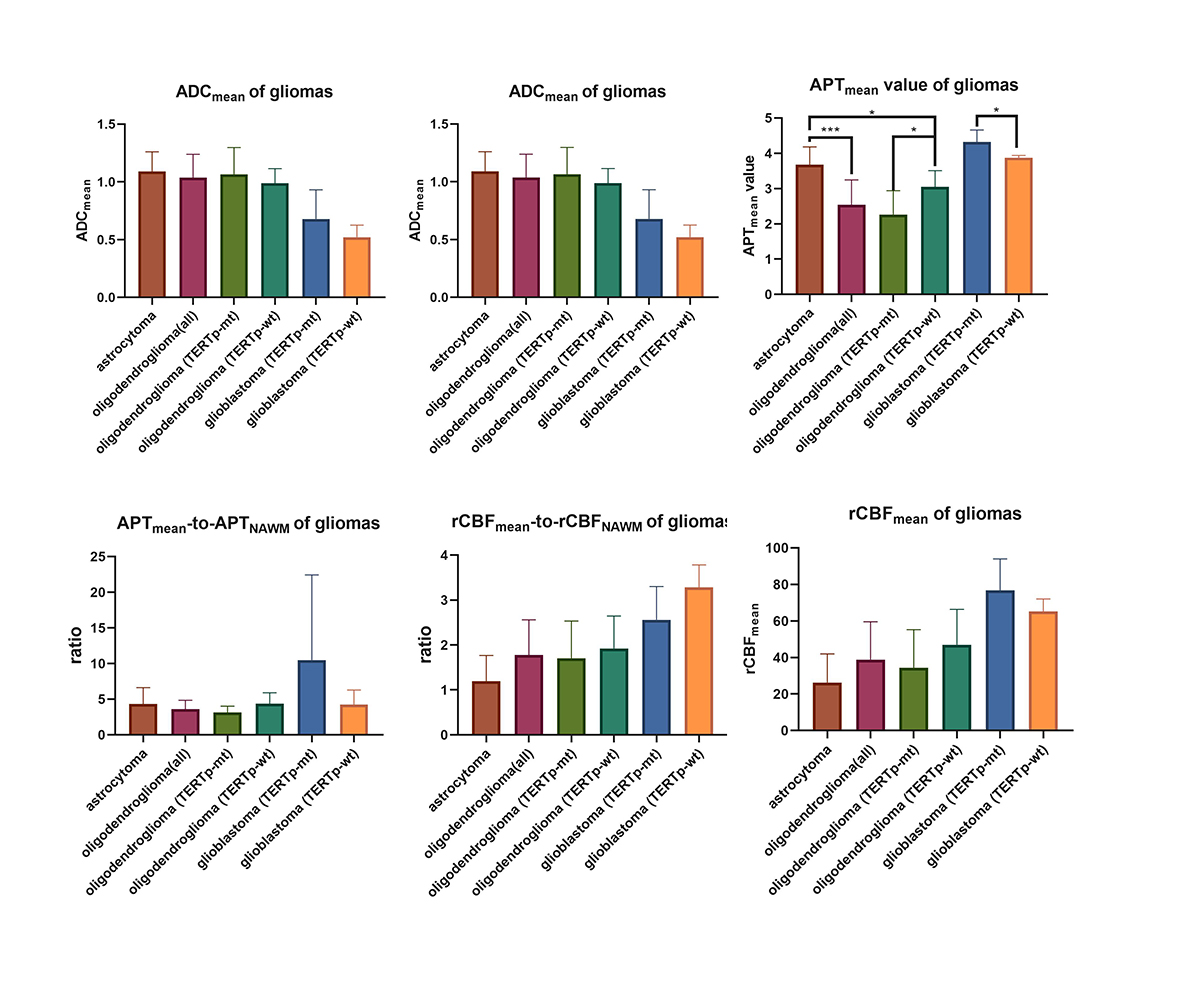
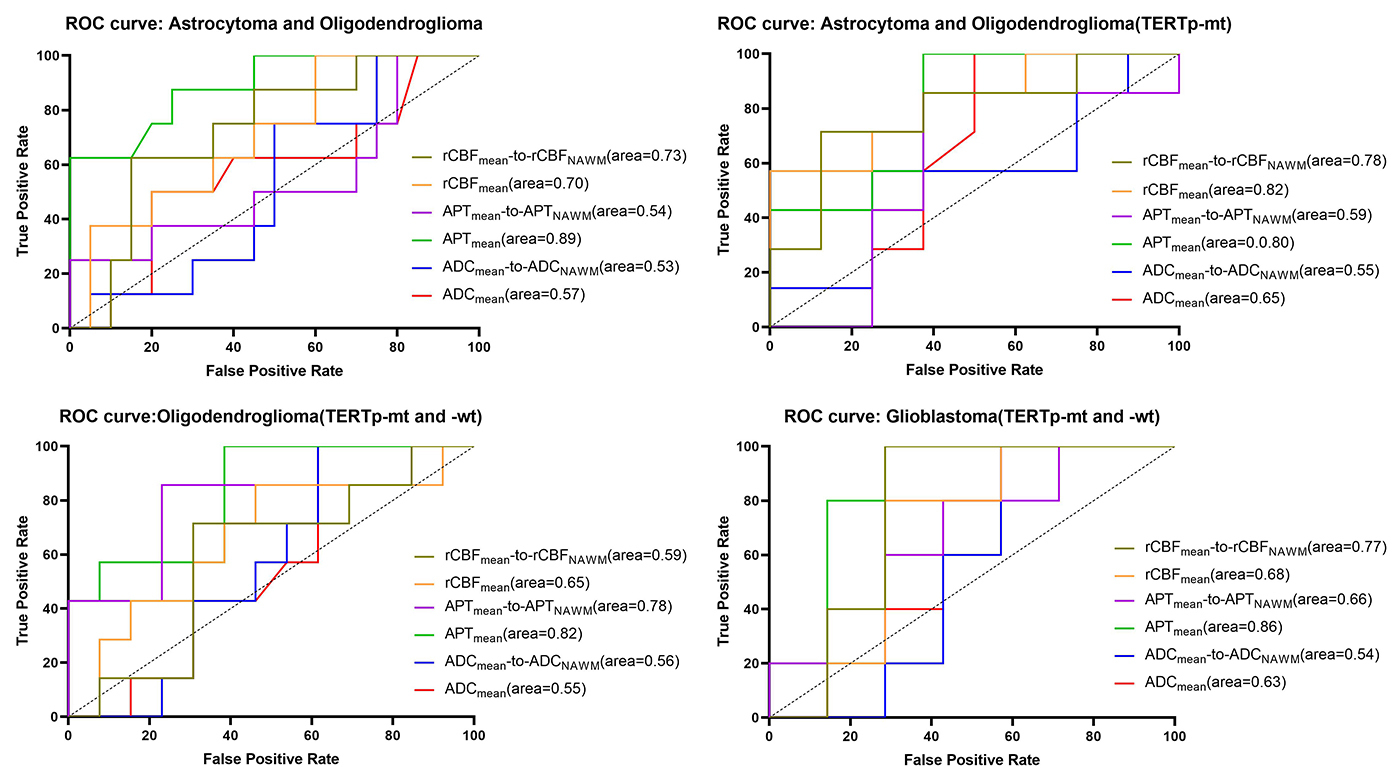
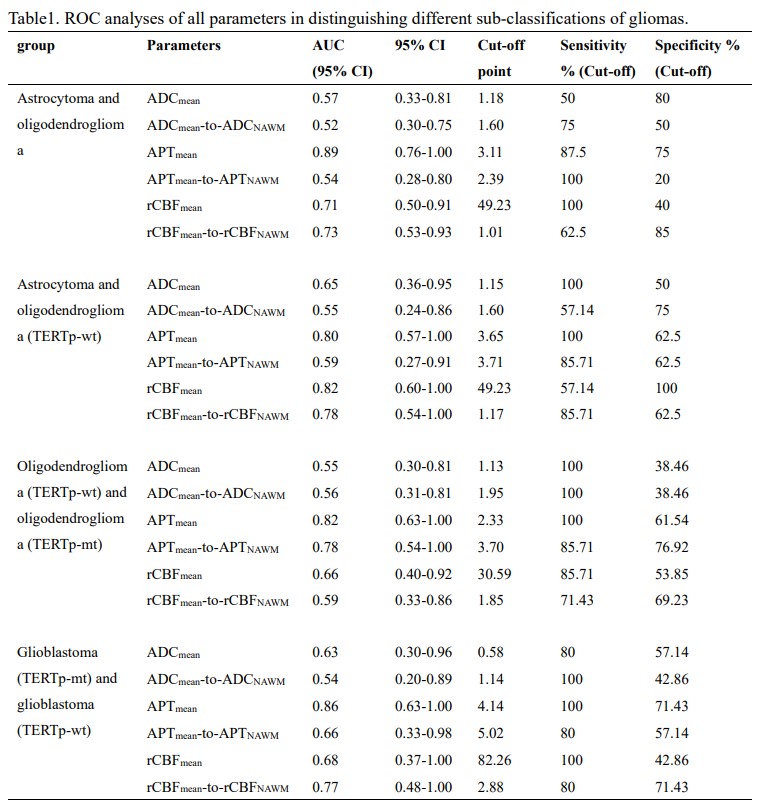
Three typical patients with sub-classifications of 2-3 grade gliomas and related ROIs were listed as reference (figure 1). There were no significant correlations among ADCmean, APTmean, and rCBFmean in different sub-classifications (table1). APTmean was significantly different in all sub-classifications (figure2). The diagnostic accuracy of APTmean was superior in distinguishing sub-classifications of gliomas, with an AUC between 0.80 and 0.89, while other parameters performed variously (figure 3).Discussion
As can be seen from the results, APTmean showed superior ability on discriminating all sub-classifications. In grade 2-3, astrocytoma, APTmean had a higher value than oligodendroglioma. Previous studies suggested that hyperactivation of ionotropic AMPA-type glutamate receptors (AMPAR), which are mostly expressed in isocitrate dehydrogenase (IDH)-mutated astrocytoma cells and was absent in oligodendrogliomas, increased glioma cell proliferation6. Furthermore, compared to astrocytoma, 1p/19q codeletion is the unique molecular characteristic of oligodendroglioma. Some researchers assessed the value of the chromosome arms 1p19q in the 1p/19q non-codel TCGA dataset. Most of the genes were enriched in processes that promote tumor growth and migration, regulate tumor microenvironment and metabolism and promote drug resistance7. Although both were diagnosed as oligodendroglioma, oligodendroglioma (TERTp-mt) displayed a lower APTmean value than oligodendroglioma (TERTp-wt). The proliferative advantage of TERTp mutation may cause accelerated telomere erosion and chromosome instability, which leads to decreased cell proliferation. The final manifestation may be a decrease in APT value. Our results showed that glioblastoma (TERTp-mutation) had a higher APTmean value than glioblastoma (TERTp-wildtype), opposite to the result in astrocytoma and oligodendroglioma. One possible reason is that TERT expression may have a threshold, above which the biological advantage is lost 8. Contrary to expectations, both ADCmean and rCBFmean showed inferior ability on discriminating all sub-classifications. Cell density, which ADC is related to, is not the only histological factor that determines sub-classifications. ADC cannot depict other features such as nuclear atypia and cell metabolism. Besides, some evidence showed that ADC values are related directly to blood flow9. With the recent availability of antiangiogenic pharmacotherapies such as bevacizumab and other agents, evaluation of CBF becomes more difficult, which may be the reason that both rCBFmean and ADCmean performed badly. Another interesting finding was that ADCmean-to-ADCNAWM, APTmean-to-APTNAWM, and rCBF-to-rCBFNAWM ratios sometimes decrease the accuracy of diagnosis. This is probably because that the ‘mirror’ ROI, which is influenced by tumor location, had poor reproducibility and stability.Acknowledgements
This study was supported Health Industry Research Program Funding Project of Gansu Province (GSWSKY2020-68).References
1. Eckel-Passow JE, Lachance DH, Molinaro AM, et al. Glioma groups based on 1p/19q, IDH, and TERT promoter mutations in tumors. N Engl J Med 2015;372: 2499–2508.
2.Maynard J, Okuchi S, Wastling S, et al. World Health Organization Grade II/III Glioma Molecular Status: Prediction by MRI Morphologic Features and Apparent Diffusion Coefficient. Radiology. 2020 Jul;296(1):111-121.
3. Sakata A, Fushimi Y, Okada T, et al. Diagnostic performance between contrast enhancement, proton MR spectroscopy, and amide proton transfer imaging in patients with brain tumors. J Magn Reson Imaging. 2017 Sep;46[3]:732-739.
4. Liu J, Li C, Chen Y, et al. Diagnostic performance of multiparametric MRI in the evaluation of treatment response in glioma patients at 3T. J Magn Reson Imaging. 2020 Apr;51[4]:1154-1161.
5. Thust SC, Hassanein S, Bisdas S, et al. Apparent diffusion coefficient for molecular subtyping of non-gadolinium-enhancing WHO grade II/III glioma: volumetric segmentation versus two-dimensional region of interest analysis. Eur Radiol 2018;28(9):3779–3788.
6. Radin DP, Tsirka SE. Interactions between Tumor Cells, Neurons, and Microglia in the Glioma Microenvironment. Int J Mol Sci. 2020 Nov 11;21(22):8476.
7. Chai RC, Zhang KN, Chang YZ, et al. Systematically characterize the clinical and biological significances of 1p19q genes in 1p/19q non-codeletion glioma. Carcinogenesis. 2019 Oct 16;40(10):1229-1239.
8. Hafezi F, Perez Bercoff D. The Solo Play of TERT Promoter Mutations. Cells. 2020 Mar 19;9(3):749.
9. Patterson DM, Padhani AR, Collins DJ. Technology insight: water diffusion MRI--a potential new biomarker of response to cancer therapy. Nat Clin Pract Oncol. 2008 Apr;5(4):220-33.
Figures