0378
Deciphering the compartmental origin of glucoCEST signal using diffusion-weighted CEST-MRS1Université Paris-Saclay, Commissariat à l’Energie Atomique et aux Energies Alternatives (CEA), Centre National de la Recherche Scientifique (CNRS), Molecular Imaging Research Center (MIRCen), Laboratoire des Maladies Neurodégénératives, Fontenay-aux-Roses, France
Synopsis
Compartmental origin of glucoCEST signal is still an ongoing debate. To address this crucial question, we propose in this study to use diffusion-weighted CEST-MRS in order to disentangle extracellular/extravascular and intracellular contributions to the glucoCEST signal. D-glucose and 2-deoxy-D-glucose were injected intravenously and kinetics of glucoCEST signal were measured over time. The comparison of kinetics acquired with and without diffusion grandients showed that 2-deoxy-D-glucose glucoCEST signal was dominated by intracellular contribution, contrarily of D-glucose. This study could constitute a major step toward glucoCEST quantification and could be beneficial for several applications, especially to study energy metabolism defects in neurodegenerative disorders.
Purpose
Detection of glucose, which is tightly correlated to energy metabolism, using CEST-MRI could offer an radioactive-free alternative to 18F-FDG PET1,2 to map Cerebral Metabolic Rate of glucose consumption with high spatial resolution. However, compared to PET where FDG signal arises from accumulation of radioactive tracer, the origin of glucoCEST signal remains unclear and must be elucidated for further applications. Indeed, glucoCEST signal may arise from three different compartments: vascular, extravascular-extracellular or intracellular (Fig.1.A). There is no consensus among the MRI community as some studies suggest an intracellular origin3 while others concluded in an extravascular-extracellular2 or both1,4,5, as well as non-negligible contribution from the vascular space6. Consistently with previous works3,7, we showed that vascular space did not contribute to the glucoCEST signal using L-glucose (a glucose analogue confined to the vascular space) (Fig.1.C). Nonetheless, we could not discriminate between the other two compartments, i.e. intracellular and extravascular/extracellular. To answer this question, we propose to add a diffusion block in our sequence in order to disentangle the contribution of both compartments to the glucoCEST signal. In this study, we reported for the first time in vivo diffusion-weighted glucoCEST signal kinetics following i) D-glucose (D-Glc) and ii) 2-desoxy-D-glucose (2DG) injection, providing new insights about glucoCEST origin.
Materials & Methods
GlucoCEST sequence: To maximize detection sensitivity over spatial resolution, we used a spectroscopic approach based on fully adiabatic LASER localization preceded by a CEST module consisting in a frequency-selective continuous wave pulse (Tsat = 4s, B1 = 2µT). A diffusion block based on Q-vector magic angle spinning (QMAS) gradients was inserted between CEST and LASER modules (Fig.2). Acquisitions were performed on a horizontal 11.7T Bruker magnet using volume coil in transmission and a quadrature surface coil in reception.Phantom acquisitions: Solutions of 50mM of 2DG and glucose-6-phosphate (G6P) were prepared. B1 intensity was ranged between 1.2 and 4.0 µT with a 0.4µT step and saturation offsets were ranged between -5 to 5 ppm with a 0.2ppm step (Fig.3).
Animal acquisition: Healthy rats anesthetized with isoflurane (1.8%) were injected intravenously (1 g/kg in 8 min) with a 20% w/w solution of either D-Glc or 2DG. Diffusion-weighted GlucoCEST data were acquired in a 2.5x2.5x2.5 mm3 voxel located in the left striatum at resonance frequencies of interest (±2.9, ±2.1, ±1.2 ppm) with diffusion gradients interlaced (b value of 0 and 1000 s/mm²). Kinetics of glucoCEST variations were acquired with a time step of 3 min for each b value, before, during and after injection over 2h.
Results
GlucoCEST signal following D-Glc injection showed a small and continuous increase over time at each frequency of interest (Fig.4.A blue). Signal following 2DG injection, on the other hand, showed a sharper increase followed by a plateau and a return to baseline as measured at 2.1 and 2.9 ppm (Fig.4.B blue).Interestingly, diffusion-weighted glucoCEST signals acquired after D-Glc or 2DG injection showed marked difference (Fig.4 orange). Indeed, uptake of glucoCEST signal after D-Glc injection was cancelled with diffusion gradients while it was preserved after 2DG injection.
Discussion and conclusion
A marked difference was observed between D-Glc and 2DG signals. First, we expected D-Glc signal to increase and then return to baseline, assuming D-Glc would be quickly metabolized inside brain cells, but we observed a quite constant glucoCEST signal after its increase during the 20min post D-Glc injection (Fig.4.A). Recent studies demonstrated that D-Glc could be cleared from brain parenchyma and cerebrospinal fluid through the glymphatic system8, which could explain the steady glucoCEST signal after D-Glc injection. Diffusion-weighted kinetic of D-Glc, which showed reduced uptake as compared to kinetic without diffusion, suggested that glucoCEST signal is arising mostly from a “fast-moving space” i.e. the extravascular-extracellular space. It also supports the hypothesis of D-Glc clearance into the CSF and the glymphatic system.2DG signal without diffusion shows different profiles at 2.1 & 2.9 ppm compared to 1.2 ppm (Fig.4.B). Indeed, the signal increase measured at 2.1 & 2.9 ppm following 2DG injection was twice as high as the uptake measured at 1.2ppm. The CEST signal at these two resonance frequencies being more important in 2DG6P than in 2DG9 (Fig.3), this results could reflect 2DG being phosphorylated in 2DG6P, which therefore stays trapped in cells10. Moreover, 2DG kinetics showed no difference with and without diffusion weighting, suggesting that molecules responsible for glucoCEST signal were mostly in “restricted space” i.e. the intracellular space. These observations argue in favor of an intracellular origin of CEST signal. Note that we cannot fully explain the decrease of 2DG signal observed 40 min after injection. Such effect was already reported3 and may correspond to an intracellular phenomenon, namely: degradation of 2DG6P through pentose phosphate pathway11,12, glycogen conversion13,14, further metabolism in 2DG-1-P and 2DG-1-6-P2 15 or passive washout due to osmotic pressure.
The use of diffusion gradients in addition to our LASER sequence helped us studying in details the compartmental origin of CEST signal. We showed that glucoCEST signal was sensible to intracellular space, especially using 2DG analog. This work illustrates the potential of glucoCEST MRI as a tool to study brain energy metabolism and especially energy metabolism defects in neurodegenerative diseases.
Acknowledgements
This work was supported by a grant from Agence Nationale pour la Recherche (“nrjCEST” project, ANR-18-CE19-0014-01), and a grant from the European Research Council (ERC) under the European Union’s Horizon 2020 research and innovation programmes (grant agreement No 818266). The 11.7 T scanner was funded by a grant from NeurATRIS: A Translational Research Infrastructure for Biotherapies in Neurosciences (“Investissements d'Avenir”, ANR-11-INBS-0011).References
1. K. W. Y. Chan et al., « Natural D-glucose as a biodegradable MRI contrast agent for detecting cancer », Magnetic Resonance in Medicine, vol. 68, no 6, p. 1764‑1773, 2012, doi: 10.1002/mrm.24520.
2. S. Walker-Samuel et al., « In vivo imaging of glucose uptake and metabolism in tumors », Nat Med, vol. 19, no 8, p. 1067‑1072, août 2013, doi: 10.1038/nm.3252.
3. F. A. Nasrallah, G. Pagès, P. W. Kuchel, X. Golay, et K.-H. Chuang, « Imaging brain deoxyglucose uptake and metabolism by glucoCEST MRI », J Cereb Blood Flow Metab, vol. 33, no 8, p. 1270‑1278, août 2013, doi: 10.1038/jcbfm.2013.79.
4. T. Jin, H. Mehrens, K. S. Hendrich, et S.-G. Kim, « Mapping brain glucose uptake with chemical exchange-sensitive spin-lock magnetic resonance imaging », J Cereb Blood Flow Metab, vol. 34, no 8, p. 1402‑1410, août 2014, doi: 10.1038/jcbfm.2014.97.
5. D. Wu, J. Xu, J. Lei, M. Mclane, P. C. van Zijl, et I. Burd, « Dynamic glucose enhanced MRI of the placenta in a mouse model of intrauterine inflammation », Placenta, vol. 69, p. 86‑91, sept. 2018, doi: 10.1016/j.placenta.2018.07.012.
6. X. Xu et al., « GlucoCEST imaging with on-resonance variable delay multiple pulse (onVDMP) MRI », Magnetic Resonance in Medicine, vol. 81, no 1, p. 47‑56, 2019, doi: 10.1002/mrm.27364.
7. Y. Mathieu-Daudé, M. Vincent, J. Valette, et J. Flament, « Elucidating the compartmental origin of glucoCEST signal using glucose analogues », in Proc. Intl. Soc. Mag. Reson. Med. 29, mai 2021, p. 0145.
8. J. Huang et al., « Altered d-glucose in brain parenchyma and cerebrospinal fluid of early Alzheimer’s disease detected by dynamic glucose-enhanced MRI », Sci Adv, vol. 6, no 20, p. eaba3884, mai 2020, doi: 10.1126/sciadv.aba3884.
9. Y. Mathieu-Daudé, M. Vincent, J. Valette, et J. Flament, « Unveiling the fate of glycolytic substrates using multi-spectral CEST: proof of concept with 2DG in the rat brain », présenté à 2020 ISMRM annual exhibition, août 2020.
10. M.-T. Huang et R. L. Veech, « Metabolic Fluxes Between [14C]2-Deoxy-D-Glucose and [14C]2-Deoxy-D-Glucose-6-Phosphate in Brain In Vivo », Journal of Neurochemistry, vol. 44, no 2, p. 567‑573, 1985, doi: 10.1111/j.1471-4159.1985.tb05450.x.
11. M. Suzuki, J. D. O’Dea, T. Suzuki, et N. S. Agar, « 2-deoxyglucose as a substrate for glutathione regeneration in human and ruminant red blood cells », Comparative Biochemistry and Physiology Part B: Comparative Biochemistry, vol. 75, no 2, p. 195‑197, janv. 1983, doi: 10.1016/0305-0491(83)90312-7.
12. S.-M. Jeon, N. S. Chandel, et N. Hay, « AMPK regulates NADPH homeostasis to promote tumour cell survival during energy stress », Nature, vol. 485, no 7400, p. 661‑665, mai 2012, doi: 10.1038/nature11066.
13. R. Southworth, C. R. Parry, H. G. Parkes, R. A. Medina, et P. B. Garlick, « Tissue-specific differences in 2-fluoro-2-deoxyglucose metabolism beyond FDG-6-P: a 19F NMR spectroscopy study in the rat », NMR in Biomedicine, vol. 16, no 8, p. 494‑502, 2003, doi: 10.1002/nbm.856.
14. T. Nelson, E. E. Kaufman, et L. Sokoloff, « 2-Deoxyglucose Incorporation into Rat Brain Glycogen During Measurement of Local Cerebral Glucose Utilization by the 2-Deoxyglucose Method », Journal of Neurochemistry, vol. 43, no 4, p. 949‑956, 1984, doi: 10.1111/j.1471-4159.1984.tb12829.x.
15. G. A. Dienel, N. F. Cruz, et L. Sokoloff, « Metabolites of 2-Deoxy-[14C]Glucose in Plasma and Brain: Influence on Rate of Glucose Utilization Determined with Deoxyglucose Method in Rat Brain », J Cereb Blood Flow Metab, vol. 13, no 2, p. 315‑327, mars 1993, doi: 10.1038/jcbfm.1993.40.
Figures
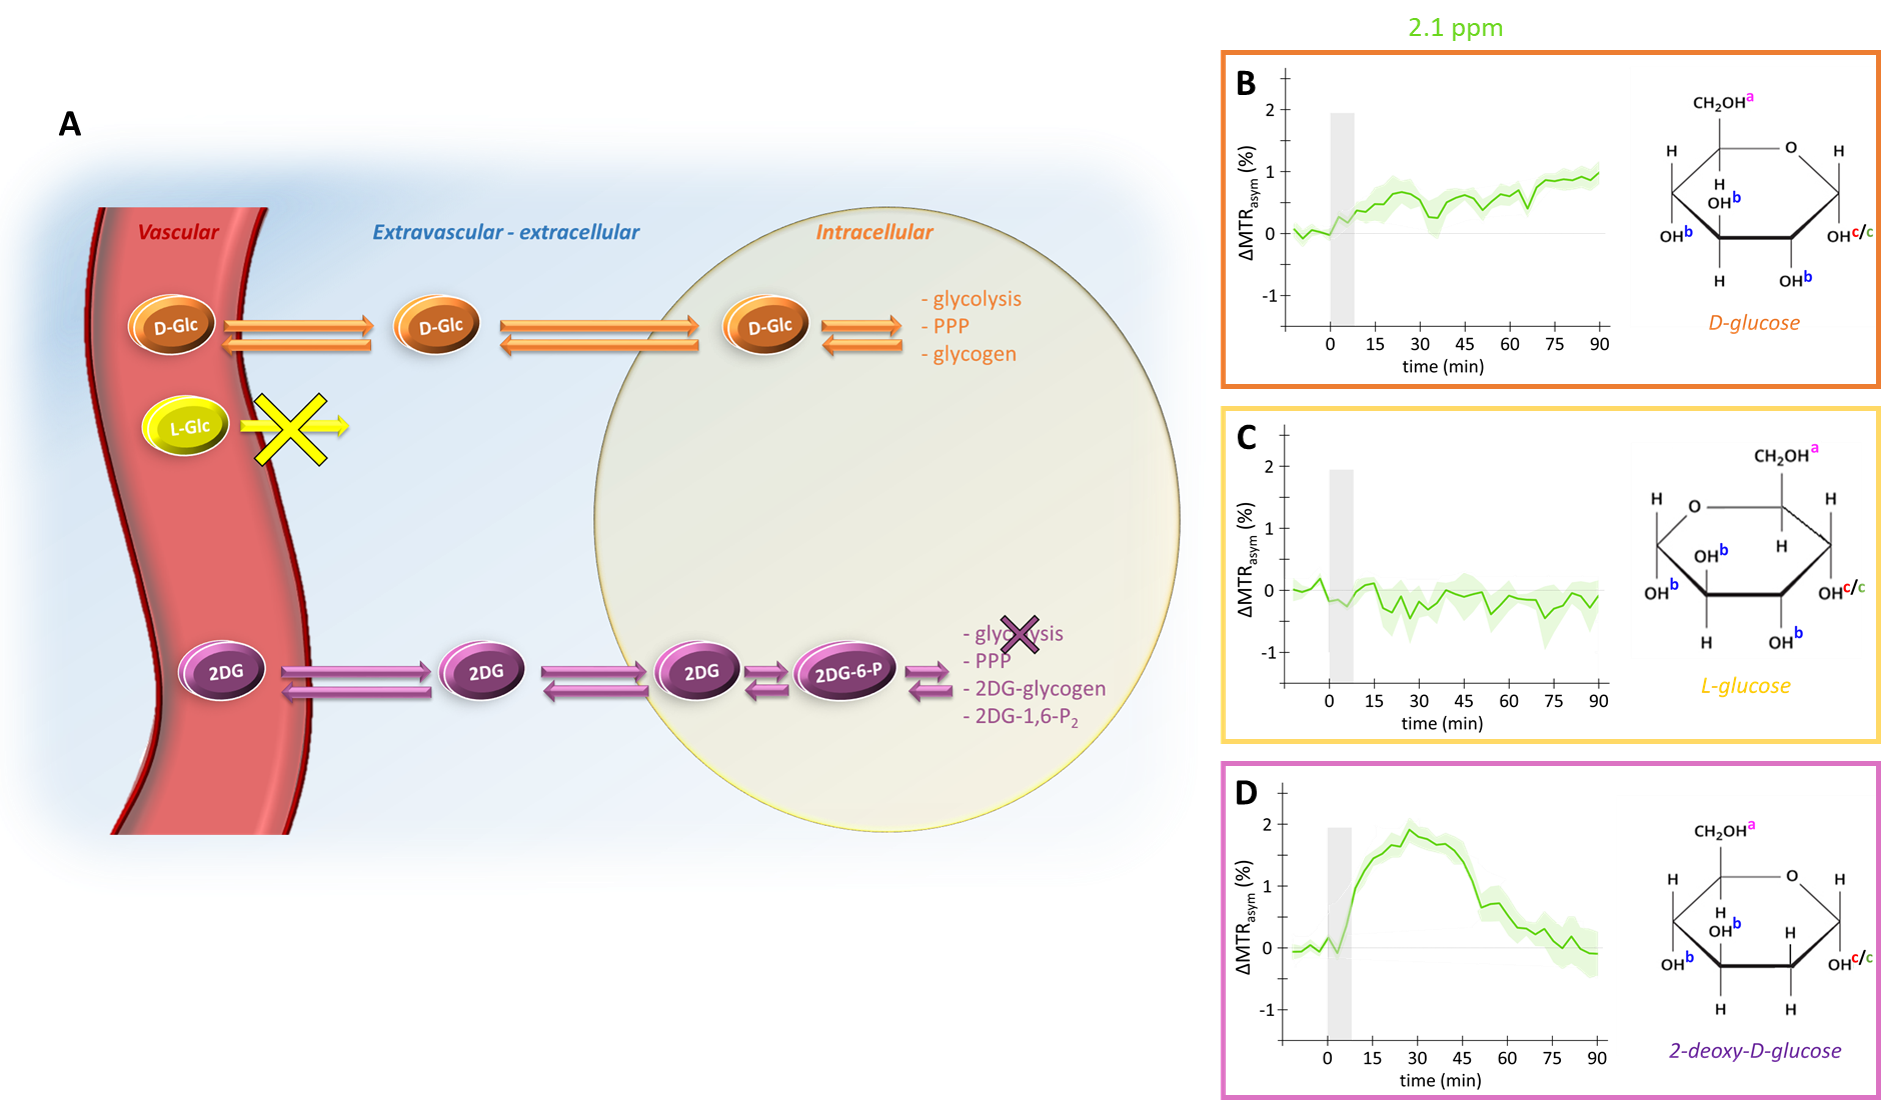
After injection into the vascular space, molecules of interest are transported similarly into the extravascular-extracellular space (except for L-glucose), then into the intracellular space by GLUTs transporters. D-glucose is transported in cells where it is then metabolized through different pathways. L-glucose does not cross the blood brain barrier and stays confined in the vascular space. 2DG is transported in cells where it is phosphorylated by hexokinase into 2DG6P but does not undergo glycolysis.
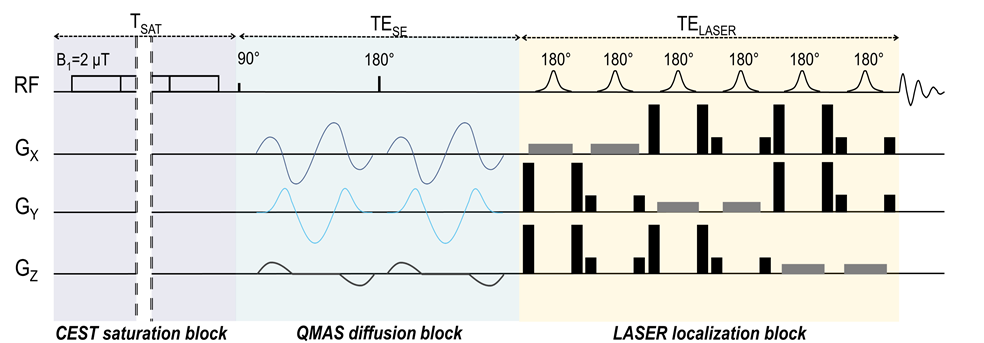
Figure 2: Chronogram of diffusion weighted CEST sequence
A classic spectroscopic LASER sequence is preceded by a CEST saturation module and diffusion gradients. CEST module consists in a pseudo-continuous saturation applied with B1 = 2 µT and tsat = 4 s (40 pulses of 100 ms with a 20 µs interval). Q-vector magic angle spinning (QMAS) gradients are used, allowing isotropic diffusion encoding.
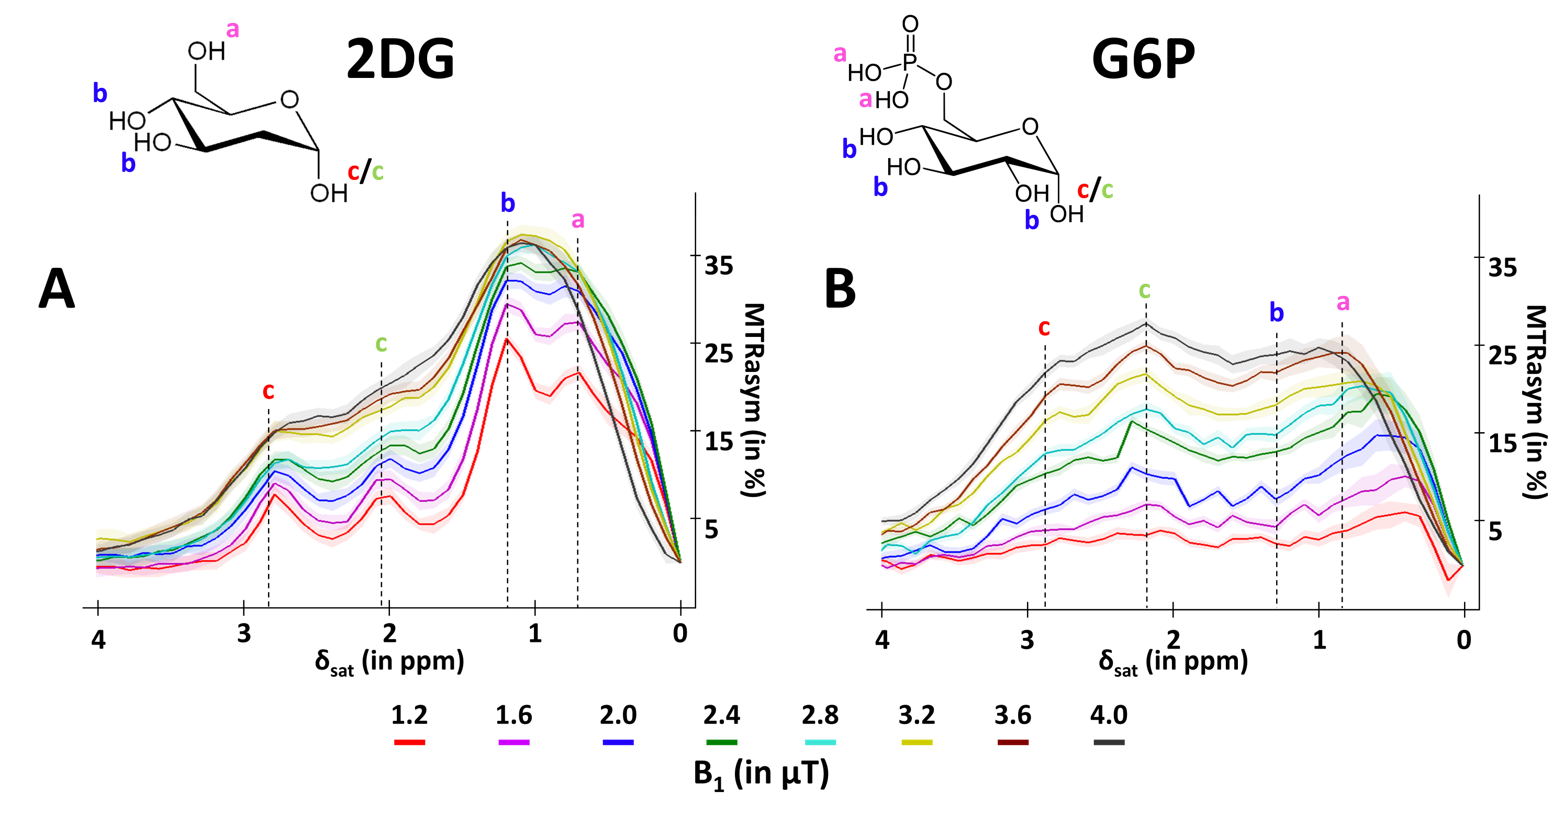
Figure 3: in vitro characterization of 2DG and G6P CEST effectsMTRasym were acquired in 50mM solution of 2DG (A) and G6P (B) with peaks attributed to each hydroxyl groups.
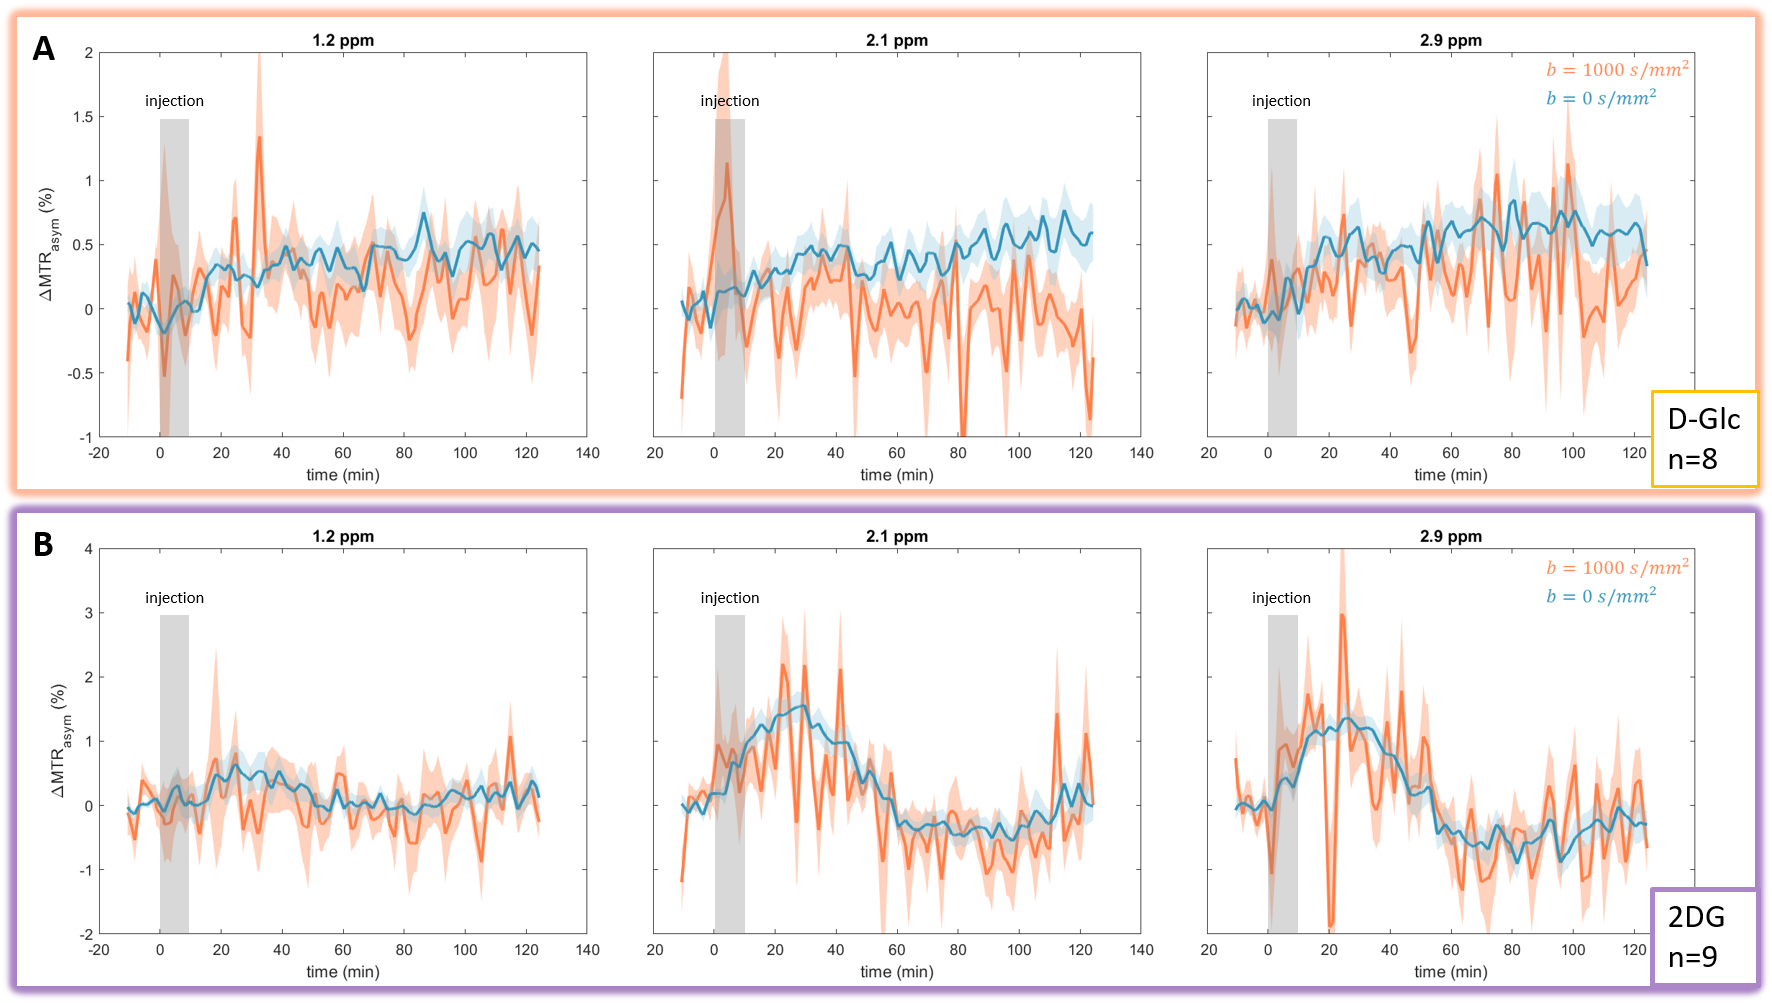
Figure 4: in vivo kinetics of glucoCEST signal with and without diffusion gradients Intravenous injection of D-Glc (A) and 2DG (B). GlucoCEST variations were measured before, during and after intravenous injection (grey area) at 1.2ppm, 2.1ppm and 2.9ppm. Signal was acquired in left striatum of rat brain. Mean ± SEM variations of CEST signal compared to baseline are shown.