0376
Feasibility of magnetization transfer measurement in distinct white matter connections1Department of Computer Science, University of Verona, Verona, Italy, 2Department of Molecular Biotechnology and Health Sciences, University of Turin, Turin, Italy, 3McConnell Brain Imaging Centre, Montreal Neurological Institute, McGill University, Montreal, QC, Canada, 4Department of Neuroscience, Rehabilitation, Ophthalmology, Genetics, Maternal and Child Health (DINOGMI), University of Genoa, Genova, Italy, 5Department of Neurology and Neurosurgery, McGill University, Montreal, QC, Canada, 6Hotchkiss Brain Institute and Departments of Radiology and Clinical Neuroscience, University of Calgary, Calgary, AB, Canada, 7Department of Biomedical Engineering, McGill University, Montreal, QC, Canada
Synopsis
Magnetization Transfer (MT) imaging is a MR technique that sensitizes image contrast to protons bound to macromolecules such as protein and lipids. Using an innovative sequence that combines MT and diffusion- imaging, and Convex Optimization Modeling for Microstructure Informed Tractography (COMMIT), a method that allows estimation of bundle tissue properties, we investigate bundle specific MT ratio (MTR) values.
Main findings
Using an innovative sequence that combines magnetization transfer and diffusion imaging we evaluate bundle-specific MTR as an index of myelination.Introduction
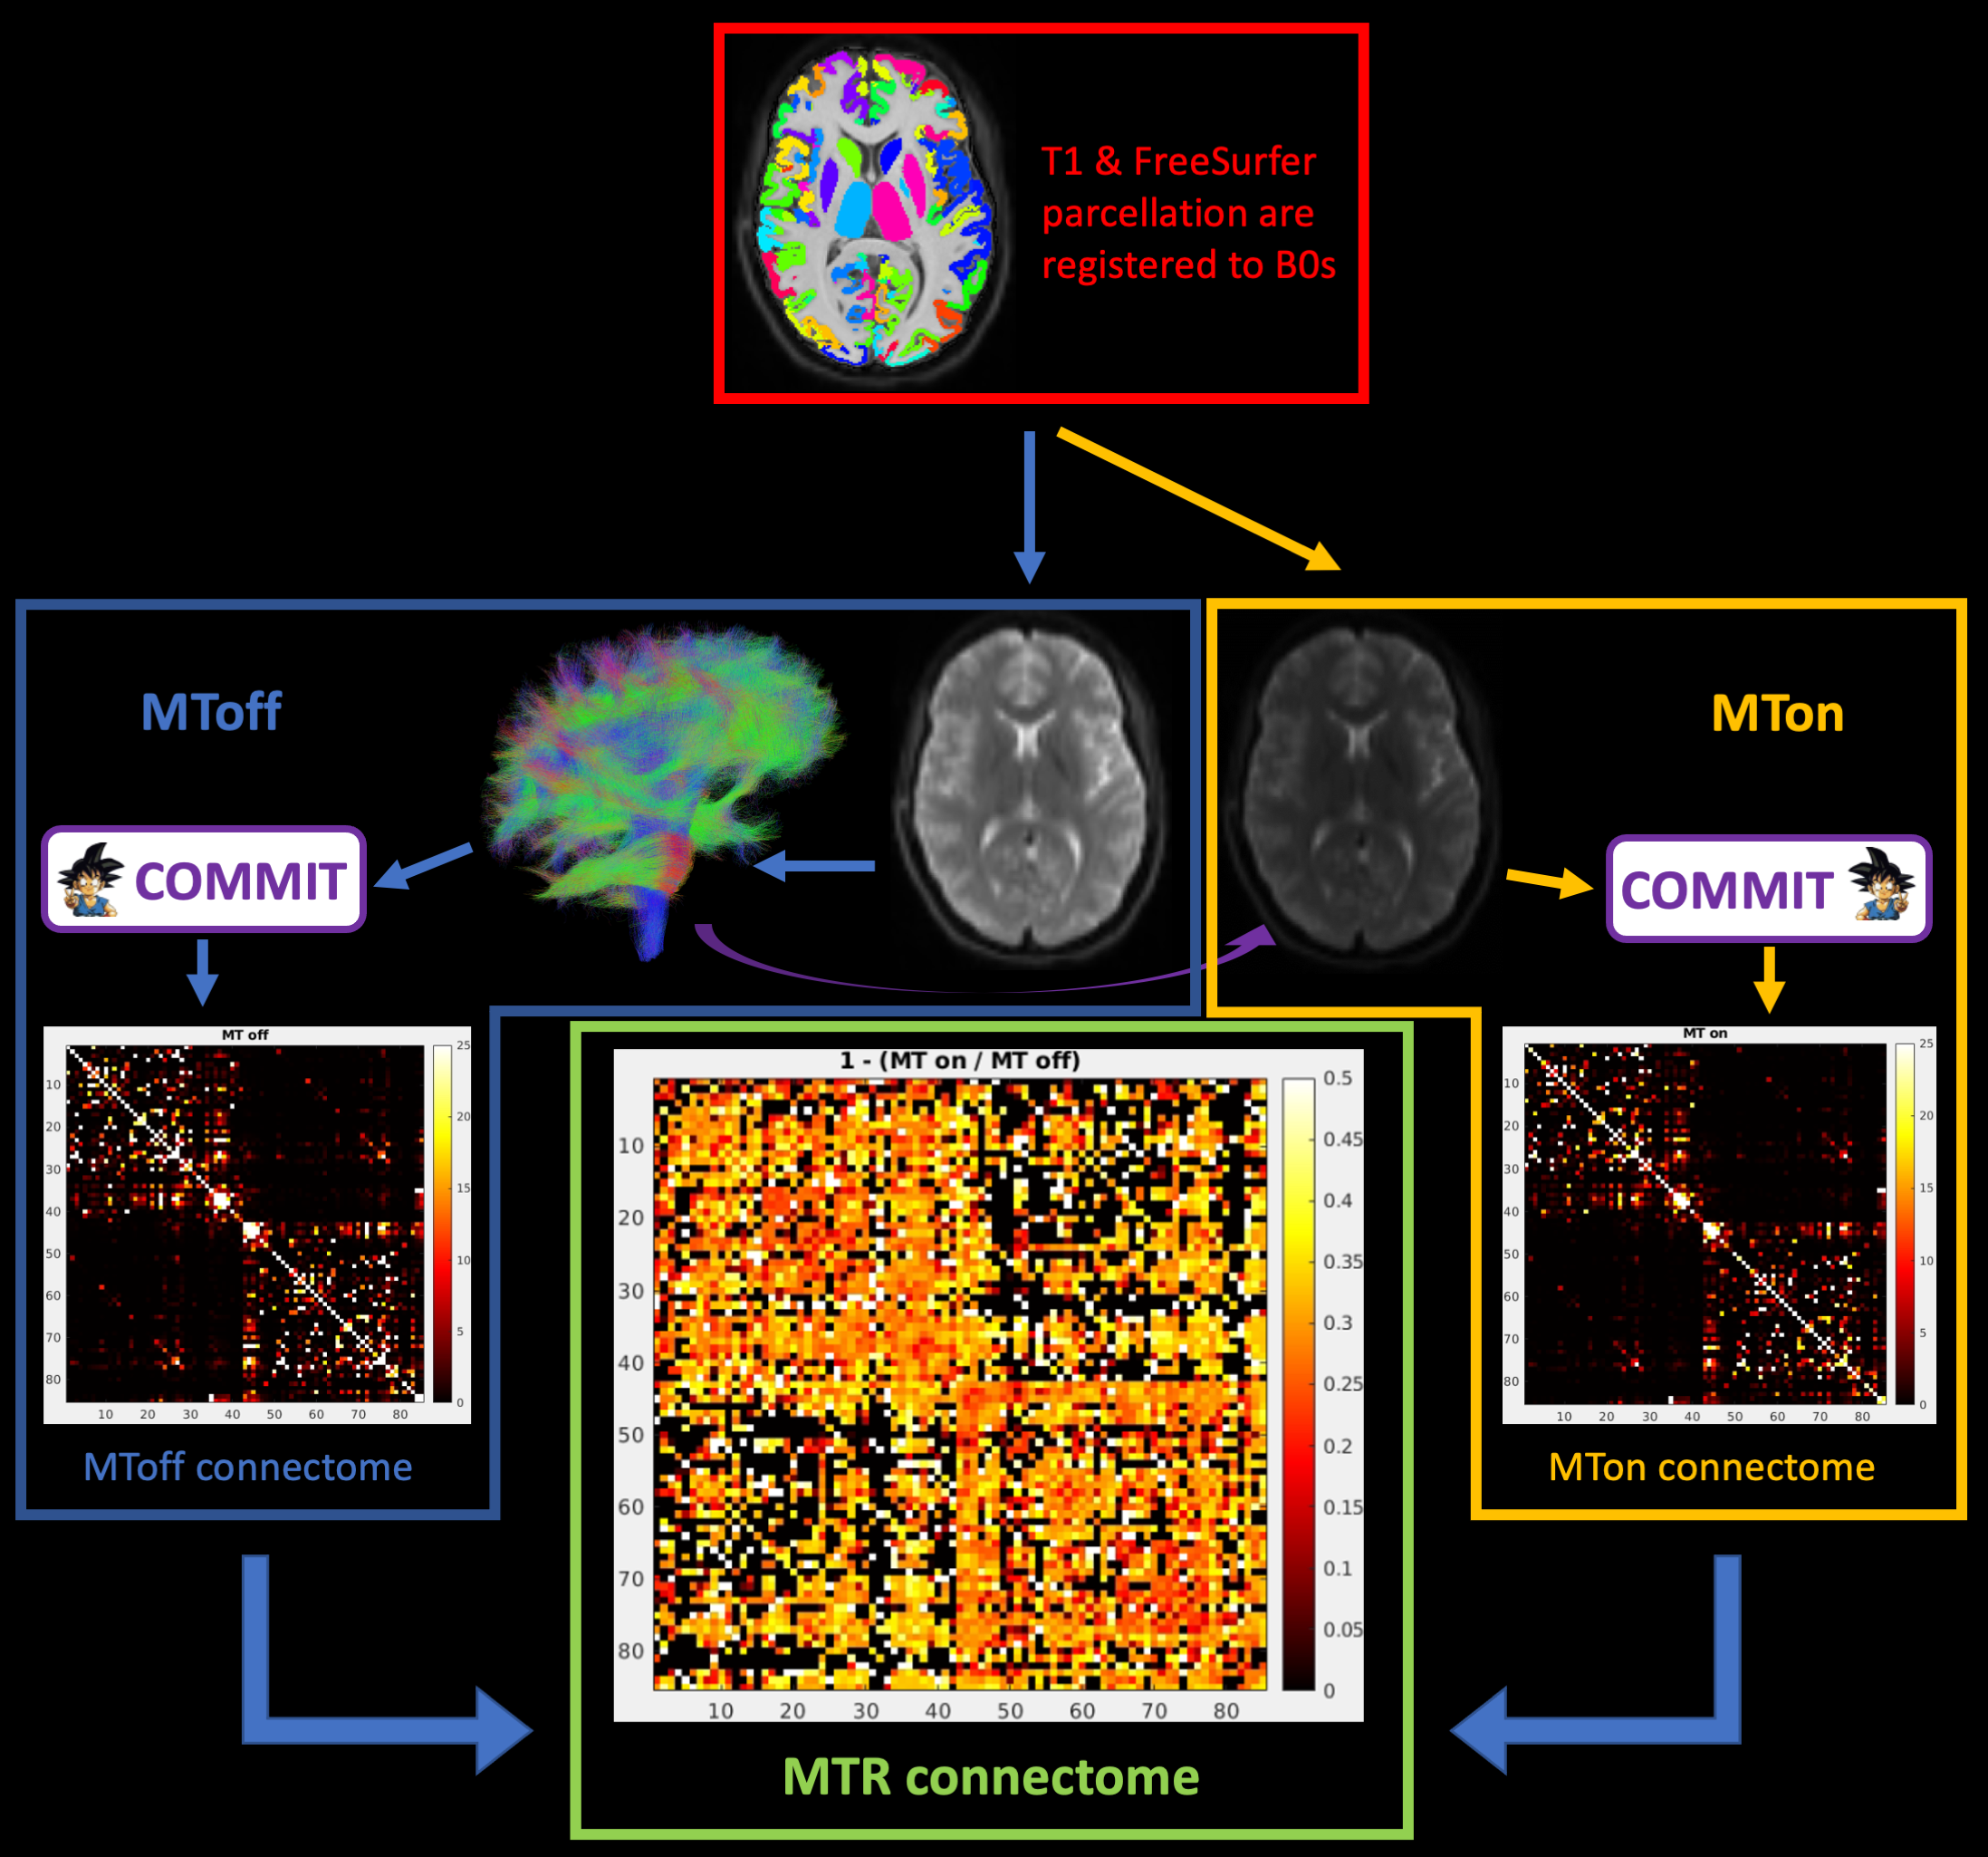
Magnetization transfer (MT) is an MRI technique that sensitizes image contrast to protons bound to macromolecules (such as protein and lipids) by the application of an off-resonance pulse that saturates the bound-pool magnetization. Due to the MT process, the water proton pool becomes partially saturated and a reduction in signal intensity is measured1. The extent of such transfer is defined by the MT ratio (MTR) and voxel-wise MTR maps are usually calculated as follows:MTR=(MToff–MTon)/MToff,
where MTon and MToff represent the voxel signal intensity with and without the application of the off-resonance saturation pulse respectively.
Tractometry, on the other hand, is an analysis technique that tries to overcome the qualitative nature of tractography by sampling a pre-defined scalar map at each vertex of a reconstructed tract2,3. Such a measure, however, lacks accuracy when multiple fiber populations coexist in the same voxels (there are at least two fiber populations in ~90% of white matter voxels)4–6.
In this work we propose a method that allows for the assessment of bundle-specific MTR by combining a co-encoded diffusion and MT weighted sequence with Convex Optimization Modeling for Microstructure Informed Tractography (COMMIT)7, a framework that allows estimation of bundle-specific tissue properties by assigning the specific signal contribution to each individual streamline. The assumption behind this framework is that the microstructural feature under investigation is constant along the trajectory of a streamline.
Methods
Four healthy subjects (HS) were imaged with a 3D MPRAGE with 1mm3 isotropic spatial resolution (TI/TE/TR=900/2.98/2300ms, FA=9deg), and a novel MT-prepared diffusion-weighted (DW) sequence used to acquire dual-encoded data. The MT preparation block consisted of 12 Hanning pulses of 2ms duration, with a gap of 1.2ms, off-resonance frequency of 4kHz and a B1rms of 5uT. Diffusion encoding was done using a b-value of 1500 s/mm2 and 30 directions. Other protocol parameters were TE=58ms, TR=8400ms, 62 slices, resolution=2.6x2.6x2.6mm3. The sequence was repeated with (MTon) and without (MToff) the MT preparation, for a total scan time of 9min. DW images (DWIs) were pre-processed to account for subject movement, susceptibility and eddy current induced distortions with FSL8,9. Then, DWIs were upsampled, registered to MP2RAGE and aligned to the Desikan-Killiany atlas with FreeSurfer10. Anatomically constrained probabilistic tractography was performed on the MToff data only using the iFOD2 algorithm11 (3M streamlines), as implemented in MRtrix3, and non-connecting streamlines were discarded. COMMIT was applied separately to the MTon and MToff datasets using the same tractogram as input to estimate the actual contributions of the streamlines to the signal in both datasets. MT induced signal reduction is expected to occur in the intra- and extra-axonal water near the myelin sheaths, in COMMIT we used a Zeppelin as the forward model for the streamlines and a Ball for the remaining tissue12. Streamlines whose contribution was greater than 0 were grouped in bundles according to the pair of cortical regions they connect. Finally, the total contribution of a bundle was calculated as the weighted average of the streamlines’ contribution assigned by COMMIT to each streamline as in13. We took the following approach to calculate a bundle specific MTR estimated by COMMIT:MTRbundle = ( MToffbundle – MTonbundle ) / MToffbundle ,
where MTonbundle and MToffbundle are the sum of the contributions of each streamline belonging to a specific bundle for MTon and MToff datasets respectively. A representation of the pipeline is presented in Figure 1.
The proposed method was compared to tractometry which, for each streamline in a specific bundle, averages the MTR values along the streamlines path. The standard tractometry approach was applied to the MTR maps calculated with b0 images.
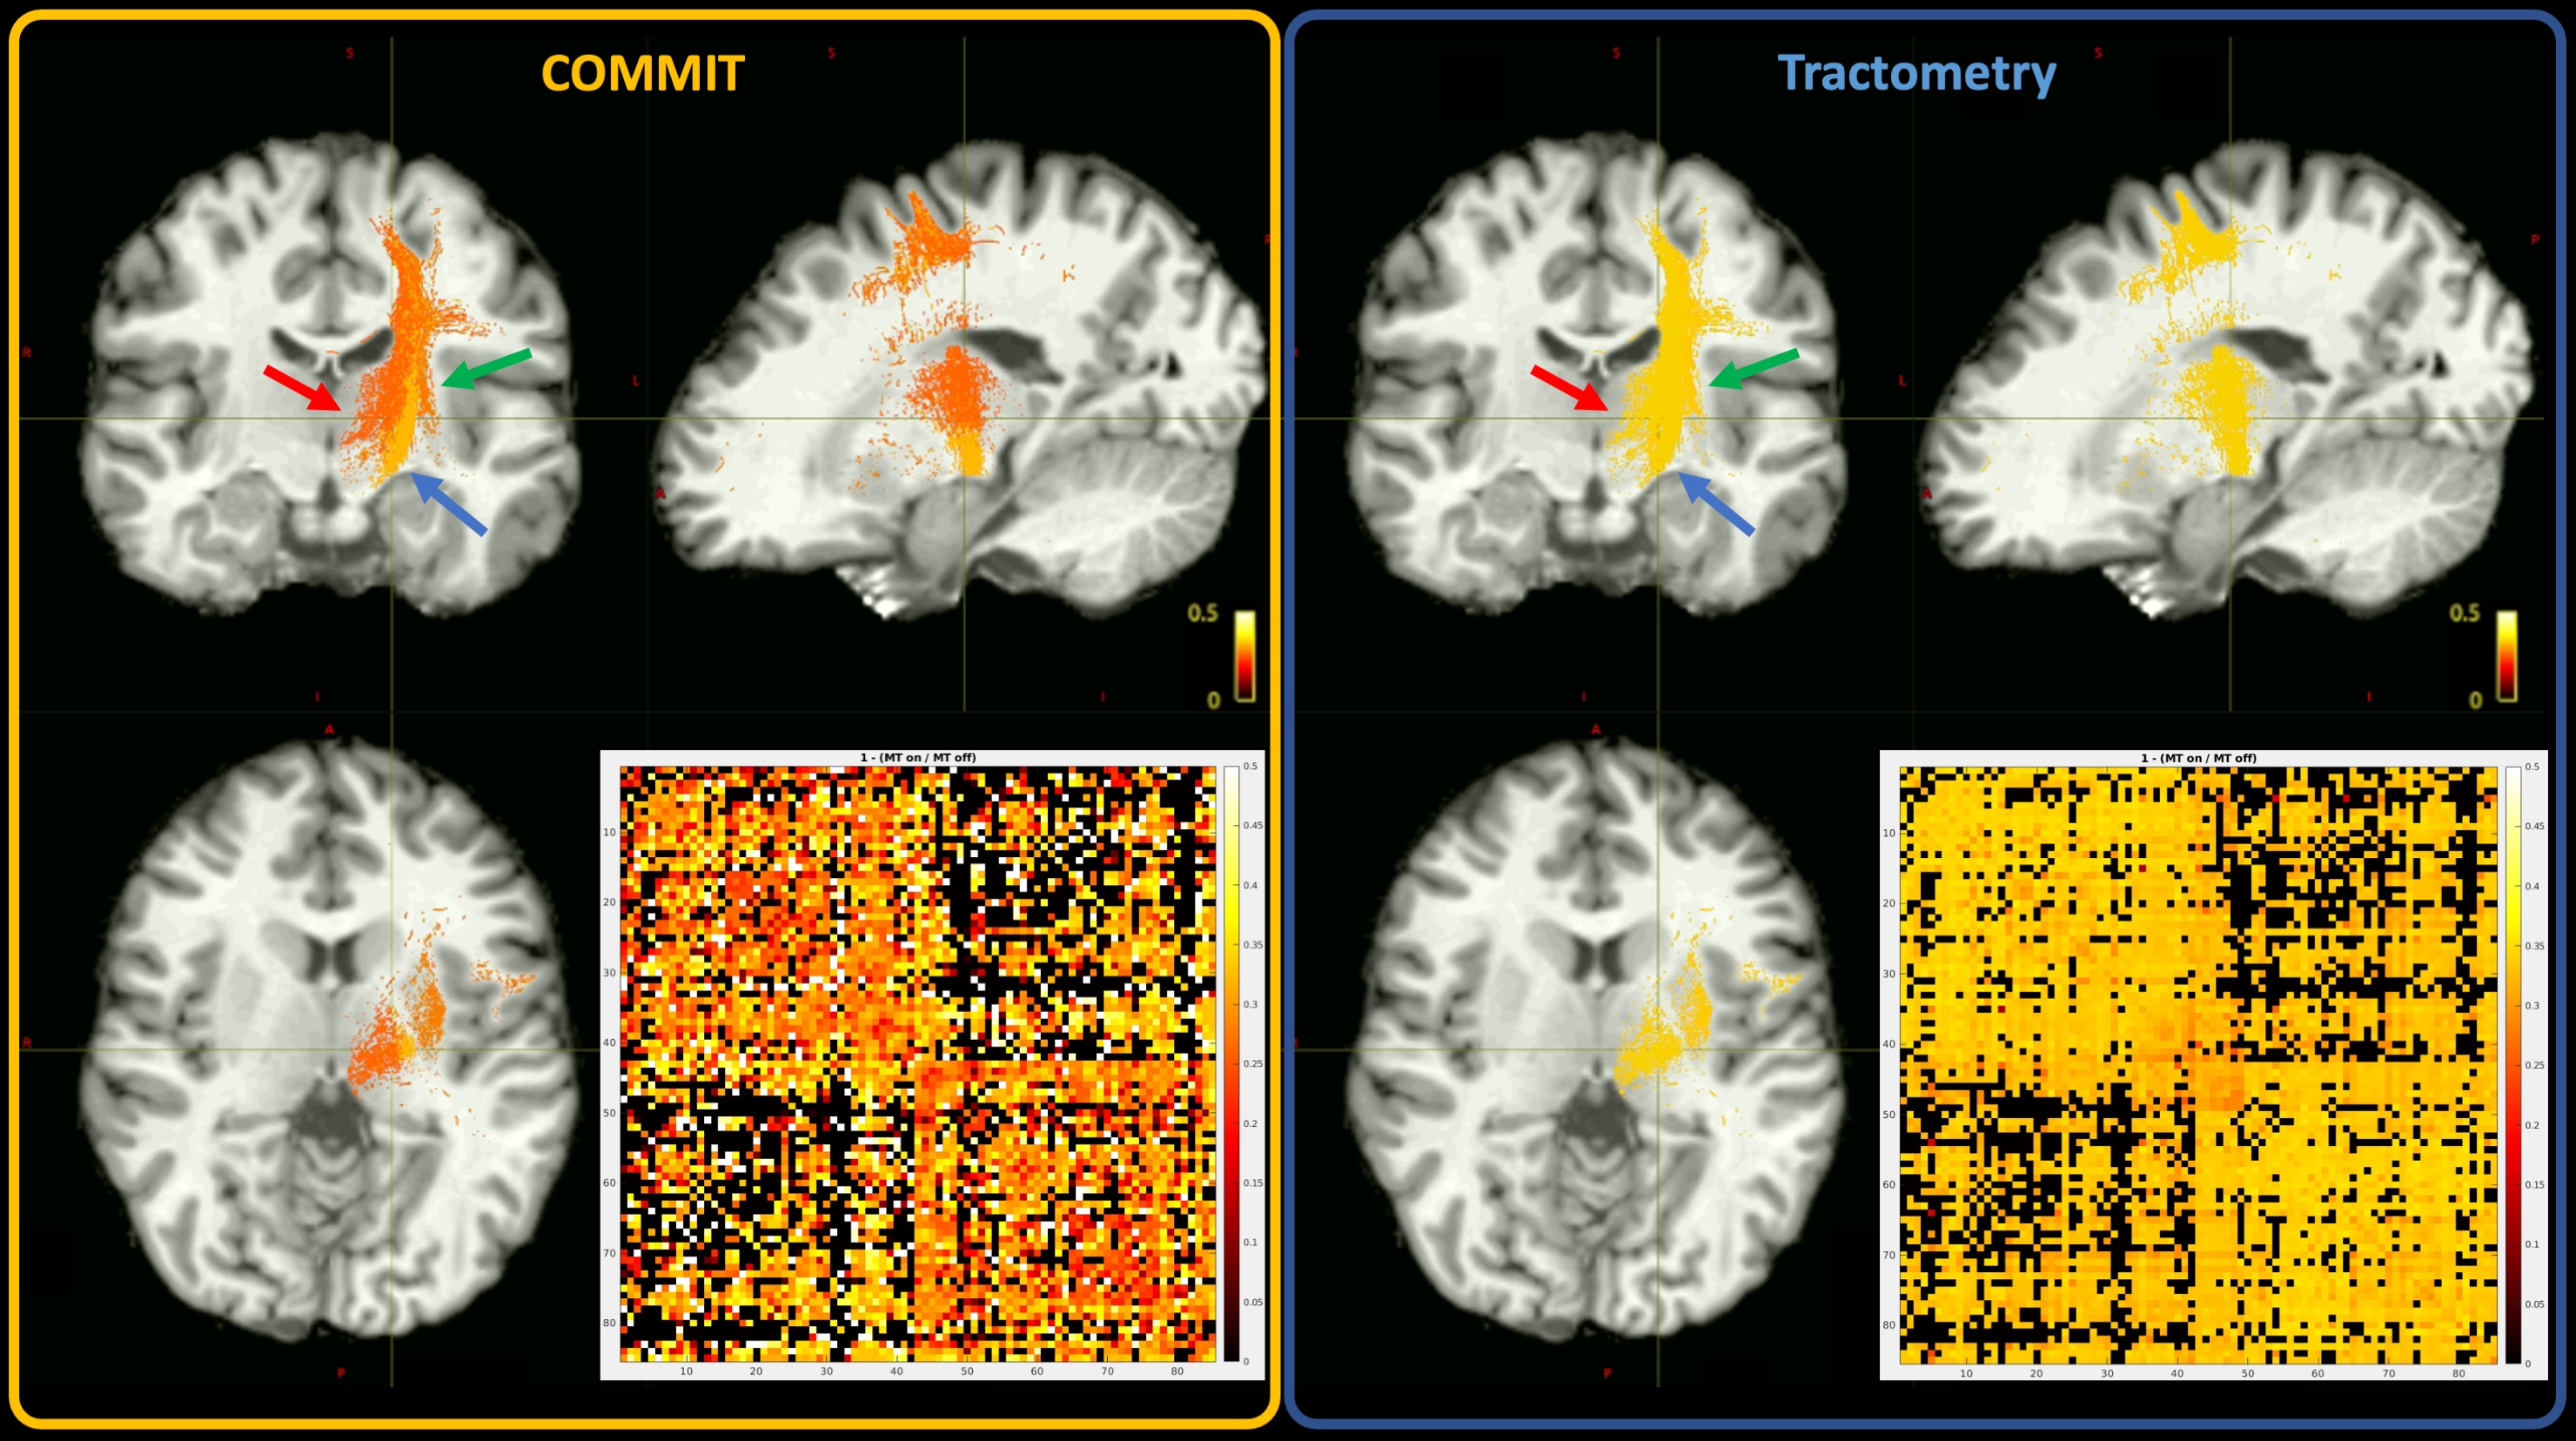
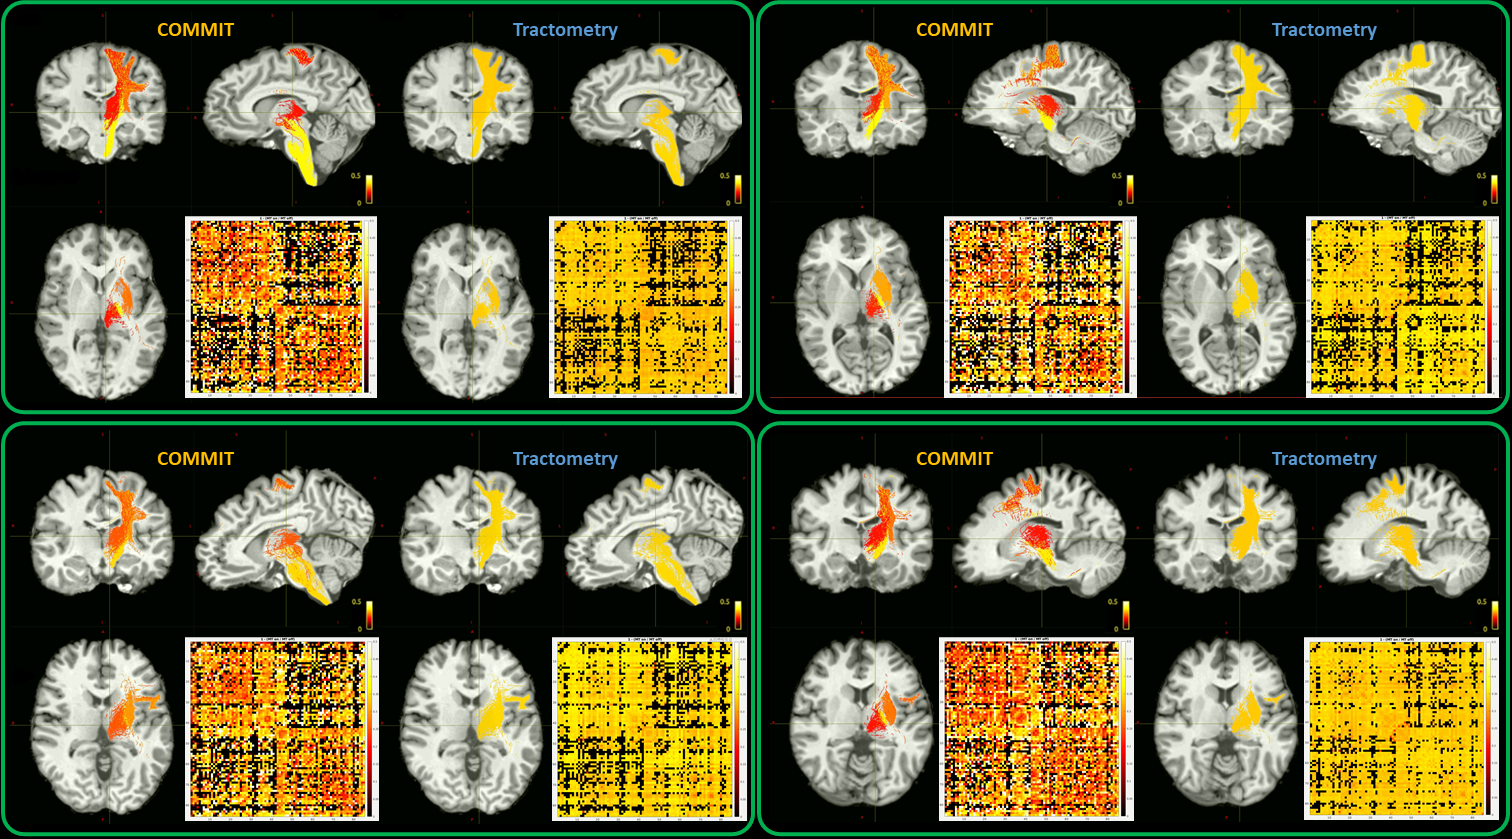
Results and Discussion
Given that MTR is an indirect measure of myelination, we show in Figure 2 only a few bundles that belong to the left motor network area and that have been previously used as a benchmark for myelin bundle decomposition4,5. To compare COMMIT and tractometry the bundles have been colour-coded by the MTR values recovered by each approach. The MTR estimated with COMMIT are higher for the bundles connecting the left precentral gyri (PrCG) with the medulla than those that connect the left PrCG with the left subcortical nuclei14. In contrast, the tractometry approach appears flat, as also suggested by the connectomes.In Figure 3 we show a summary of the reproducibility assessment made on the 4 HS. In all the subjects it is possible to observe a consistently higher MTR recovered by COMMIT in the left PrCG - medulla bundles compared to the left PrCG – left subcortical nuclei bundles. The connectomes reported in the bottom-right panels of Figure 3 show a high level of similarity.
Conclusions
For the first time we are able to measure bundle-specific MTR by applying COMMIT to an innovative dual-encoded MT-dMRI weighted sequence. The method proposed here could allow the evaluation of altered macromolecular content at the bundle level and improve our understanding of pathological progression in various neurological diseases.Acknowledgements
The following sources of funding have supported this work:Quebec Bio-Imaging Network (QBIN), Fonds de Recherche du Québec – Santé (FRQS), Healthy Brains for Healthy Lives (HBHL), the Canadian Institutes for Health Research (CIHR), and Brain Research Foundation Verona (BRFV).References
1. Henkelman, R. M., Stanisz, G. J. & Graham, S. J. Magnetization transfer in MRI: A review. NMR in Biomedicine (2001). doi:10.1002/nbm.683
2. Lipp, I. et al. Comparing MRI metrics to quantify white matter microstructural damage in multiple sclerosis. Hum. Brain Mapp. (2019). doi:10.1002/hbm.24568
3. Bells, S., Cercignani, M., Deoni, S. & Assaf, Y. “Tractometry” – comprehensive multi-modal quantitative assessment of white matter along specific tracts. Proc. Int. Soc. Magn. Reson. Med. (2011).
4. Schiavi, S. et al. Myelin weighted tractography: a new way to investigate bundles myelination in-vivo? in Proceedings of the International Society for Magnetic Resonance in Medicine 28 (2020).
5. Schiavi, S. et al. Bundle Myelin Fraction (BMF) Mapping of Different White Matter Connections Using Microstructure Informed Tractography. Under Rev. (2021).
6. Jeurissen, B., Leemans, A., Tournier, J. D., Jones, D. K. & Sijbers, J. Investigating the prevalence of complex fiber configurations in white matter tissue with diffusion magnetic resonance imaging. Hum. Brain Mapp. (2013). doi:10.1002/hbm.22099
7. Daducci, A., Dal Palù, A., Lemkaddem, A. & Thiran, J. P. COMMIT: Convex optimization modeling for microstructure informed tractography. IEEE Trans. Med. Imaging (2015). doi:10.1109/TMI.2014.2352414
8. Andersson, J. L. R., Skare, S. & Ashburner, J. How to correct susceptibility distortions in spin-echo echo-planar images: Application to diffusion tensor imaging. Neuroimage (2003). doi:10.1016/S1053-8119(03)00336-7
9. Andersson, J. L. R. & Sotiropoulos, S. N. An integrated approach to correction for off-resonance effects and subject movement in diffusion MR imaging. Neuroimage (2016). doi:10.1016/j.neuroimage.2015.10.019
10. Desikan, R. S. et al. An automated labeling system for subdividing the human cerebral cortex on MRI scans into gyral based regions of interest. NeuroImage (2006).
11. Tournier, J.-D. & , F. Calamante, and a. C. Improved probabilistic streamlines tractography by 2 nd order integration over fibre orientation distributions. Ismrm (2010).
12. Panagiotaki, E. et al. Compartment models of the diffusion MR signal in brain white matter: A taxonomy and comparison. Neuroimage (2012). doi:10.1016/j.neuroimage.2011.09.081
13. Schiavi, S. et al. Sensory-motor network topology in multiple sclerosis: Structural connectivity analysis accounting for intrinsic density discrepancy. Hum. Brain Mapp. (2020). doi:10.1002/hbm.24989
14. Kimura, F. & Itami, C. Myelination and isochronicity in neural networks. Frontiers in Neuroanatomy (2009). doi:10.3389/neuro.05.012.2009
Figures