0372
Mapping the inversion efficiency (finv): Comparison between adiabatic pulses for use in MP2RAGE-based T1-mapping1Medical Radiation Physics, Lund University, Lund, Sweden
Synopsis
Accuracy in MP2RAGE-based T1-mapping relies on knowledge of the imperfect inversion efficiency (finv) of the inversion pulse. Here we map the inversion efficiency of different adiabatic inversion pulses in human brain at 7T. We identified a mean finv=0.87, which is substantially lower than the finv=0.96 typically assumed in MP2RAGE. We further observed a lower finv in white matter (WM) than in the rest of the cerebrum. Subsequent T1 estimates differed by approximately 80 ms in WM and 200 ms in gray matter (GM) when assuming either finv=0.87 or finv=0.96.
Introduction
Adiabatic inversion pulses do not fully invert the longitudinal magnetization due to T2 relaxation1. It has further been shown that a low-power adiabatic pulse only affects the free water pool, while leaving the semi-bound macromolecular pool unaffected2. This leads to an imbalance between the two pools and subsequent MT effects will manifest as a biexponential behavior of the T1 relaxation until exchange equilibrium between the two pools has been restored. For inversion recovery-based T1-mapping, the short component can be avoided by setting the minimum TI longer than this interval (approximately 200 ms at 7T)3. If the inversion efficiency (finv) is estimated as a free parameter in a monoexponential T1-model it will thus appear reduced in tissue with high macromolecular content. This is often overlooked since T1 is most often the parameter of interest. However, when knowledge of finv is required in a monoexponential model for T1-estimation, it is this smaller apparent finv that should be applied to obtain accurate T1 estimates. This will be the case in MP2RAGE-based T1-mapping4. Here we study the variation in apparent finv between different different adiabatic inversion pulses and between different tissue types. After finv is determined, we further explore how this will affect the accuracy in MP2RAGE-based T1-mapping.Methods
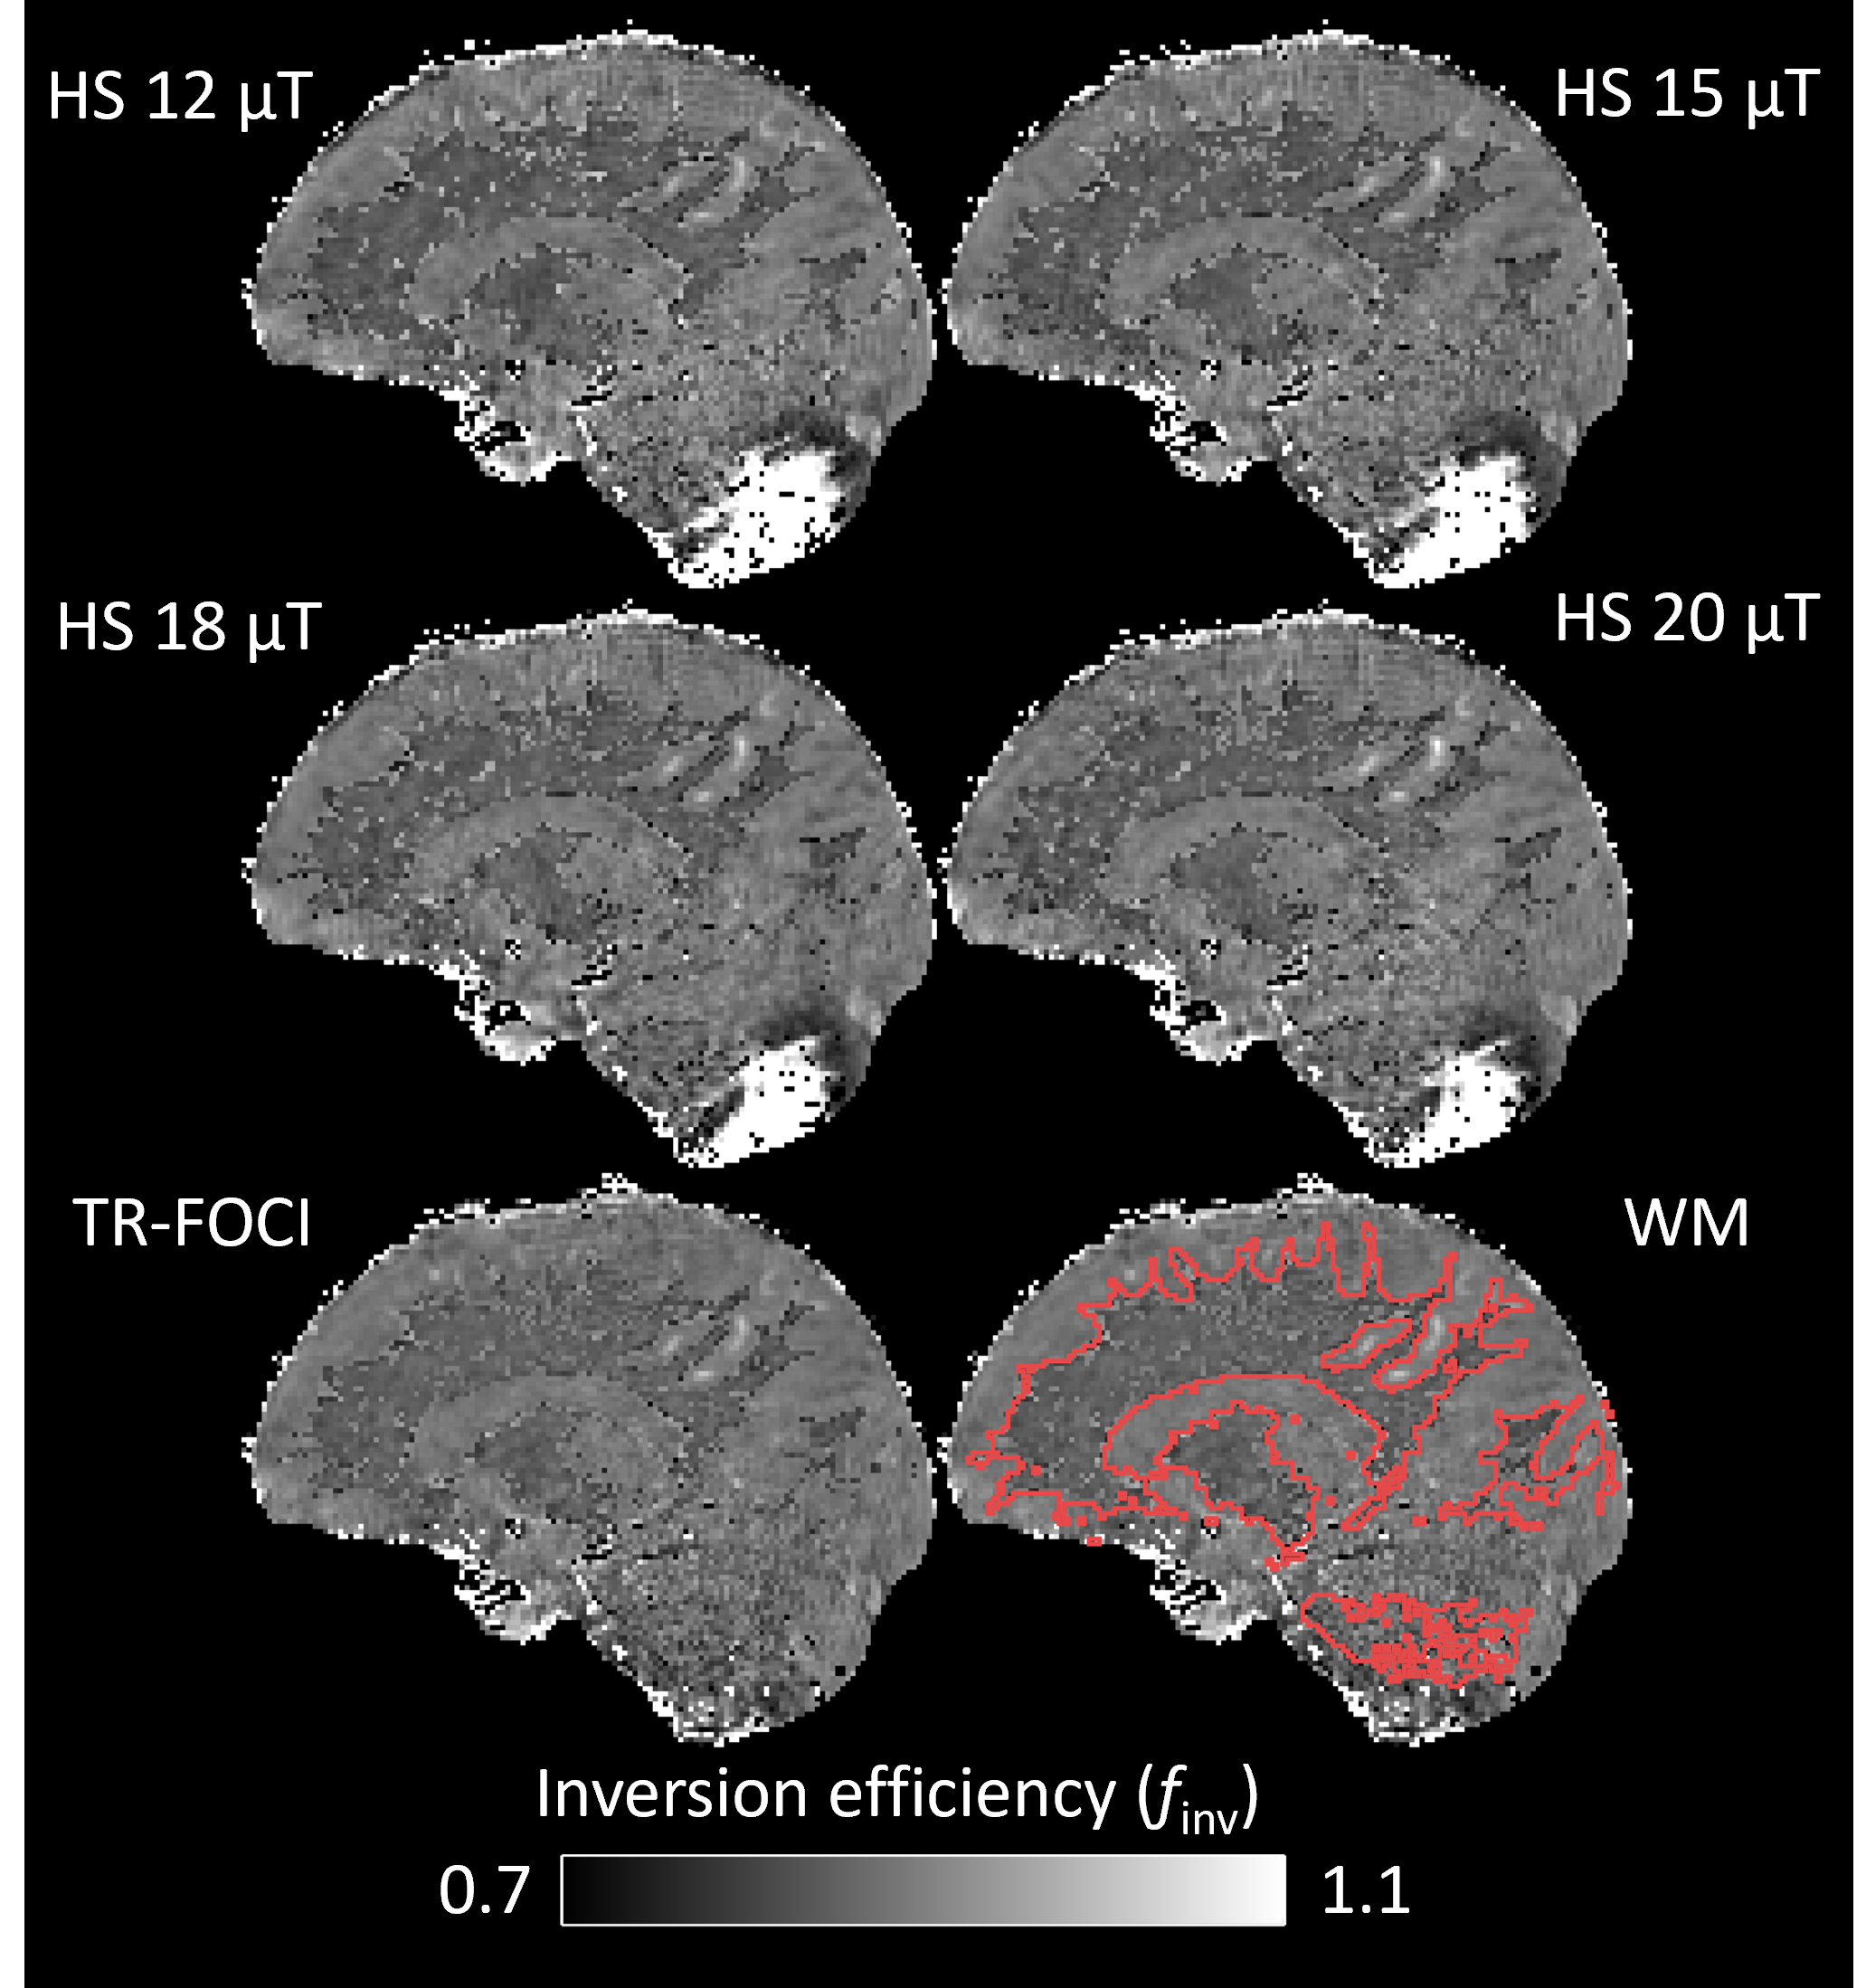
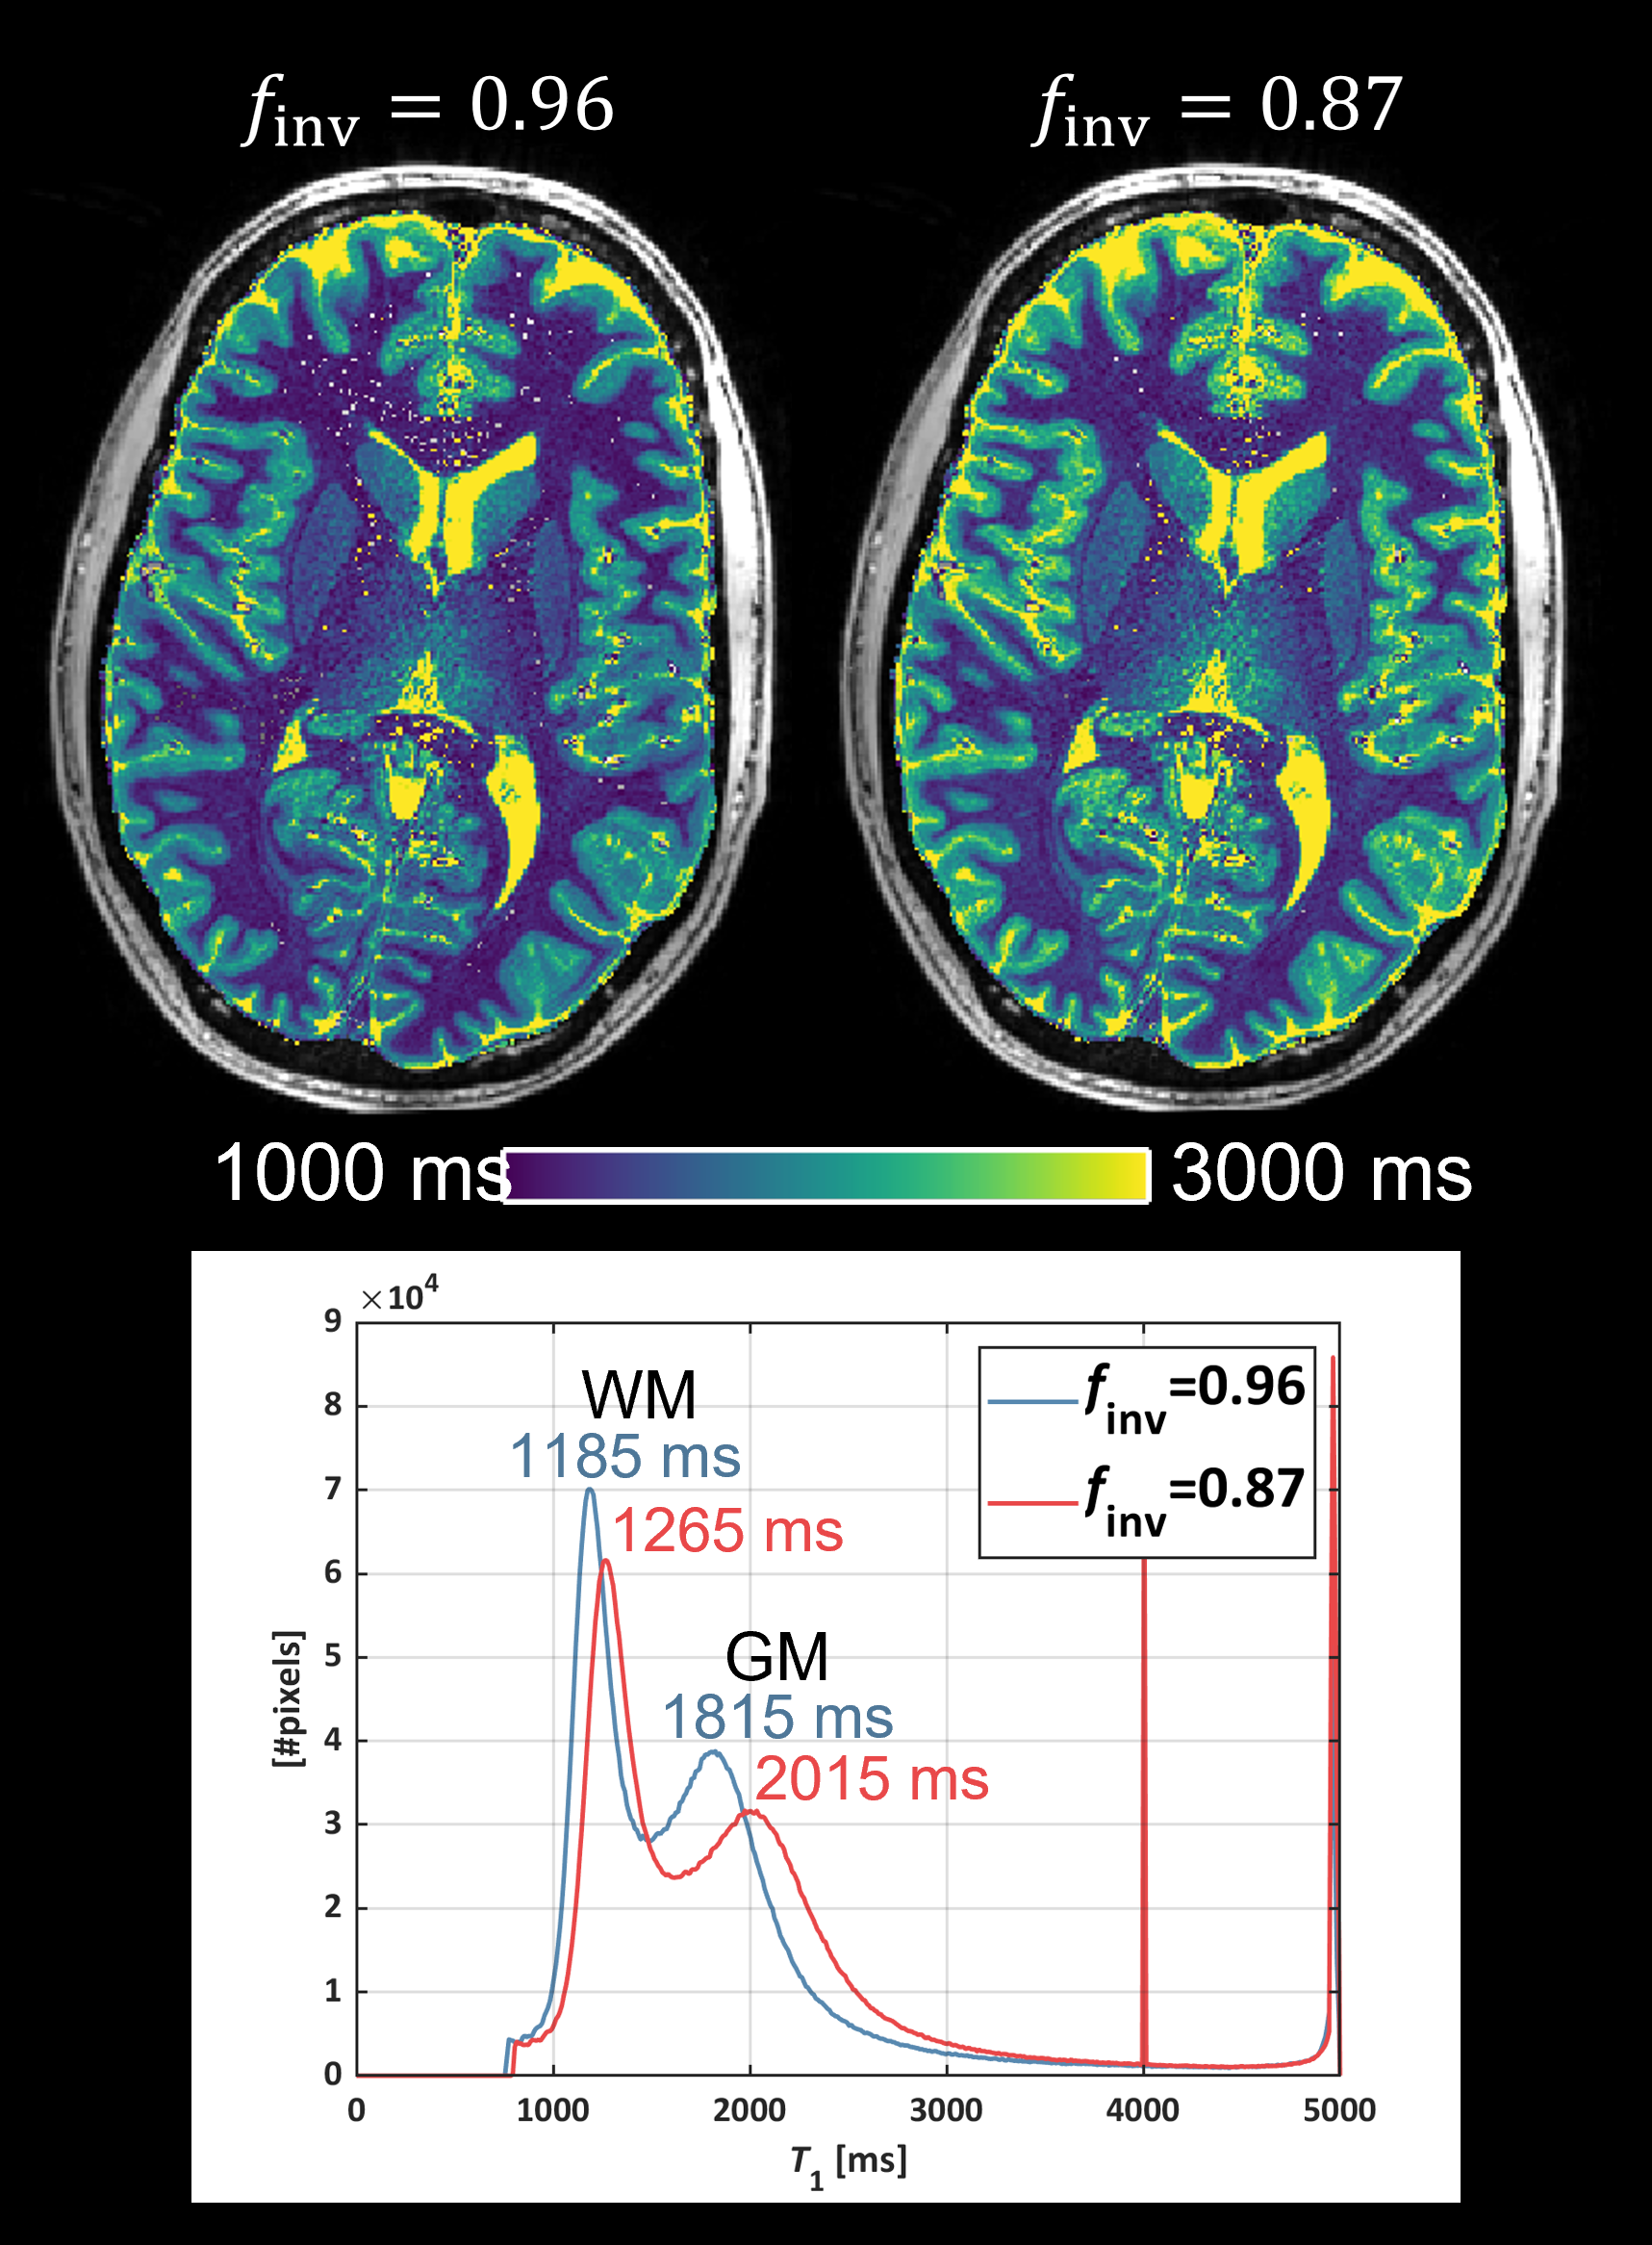
Healthy adults were scanned on a 7T Philips Achieva MR system (Philips Healthcare, Best, NL), using a dual channel transmit head coil with 32 receive elements (Nova Medical, Wilmington, MA) after giving informed written consent. MPRAGE scans with four interleaved RAGEs each (identical α=2° and TR/TE=7.45/2.94 ms) were acquired using a 1800° hyperbolic secant (HS) pulse with a peak B1 of 12/15/18/20 μT corresponding to pulse durations of 25.67/20.54/17.11/15.41 ms. A fifth MPRAGE was acquired using a 2230° TR-FOCI pulse with a peak B1 of 20 μT and duration of 13 ms5. Each scan was acquired at (1.25 mm)3 isotropic resolution without any period of free relaxation, linear phase encoding orders at TI=715/2146/3576/5006 ms (TI defined from center of inversion pulse to acquisition of k0), TurboFactor (TF)=192 and a SENSE factor of 2 in the outer loop right-left direction. The timings had to be slightly adjusted based on the inversion pulse durations. The inversion efficiency was determined pixelwise using a three-parameter fit of the uninterrupted $$$T_1^*=[1/T_1-1/{TR}\cdot\ln(\cos(\alpha))]^{-1}<T_1$$$ transition6. Mean finv in brain was determined across a sagittal slice for each inversion pulse (noise pixels of finv<0.6 or finv>1 were excluded). The mean in segmented white matter (WM), gray matter (GM) and cerebrospinal fluid (CSF) was also calculated and compared. Using the mean finv across the slice, an MP2RAGE-based T1 map was derived using freely available MATLAB code (https://github.com/JosePMarques/MP2RAGE-related-scripts) and compared to the T1 map obtained when using the default finv=0.96. The TR-FOCI pulse was used for MP2RAGE, which was acquired at (0.7 mm)3, TI1/TI2=911/2761 ms, TR/TE=6.80/2.45 ms and TF=256. A SENSE factor of 2 and partial Fourier of 75% was applied in the outer loop direction as well as an elliptical phase encoding. Residual B1+-bias was removed through separate flip angle mapping7 using a DREAM protocol8.Results
The mean finv values are listed in Table 1. The pulses yielded quite similar results with an overall mean of finv=0.87, substantially lower than the MP2RAGE-default finv=0.96. A somewhat lower finv was observed in the WM (finv=0.86) compared to GM (finv=0.89) and CSF (finv=0.88). As the peak B1 of the HS pulse was increased, the adiabatic condition was fulfilled for progressively lower B1+, manifesting as increased coverage in the cerebellum (Figure 1). The best coverage was obtained using the TR-FOCI pulse. The experimentally determined finv=0.87 resulted in substantially higher T1 estimates compared to finv=0.96 (Figure 2). The whole brain histograms showed a shift in the WM/GM modes by 80/200 ms respectively.Discussion
MP2RAGE-based T1 estimates have been reported as systematically lower than those of other techniques, particularly in WM9. The source of this underestimation has been suggested to be the assumed monoexponential behaviour of T19. Here we argue that although an finv=0.96 may be technically more correct for free water, it is the apparent finv that accounts for imperfections due to T2 relaxation and/or MT and should thus be applied in a monoexponential model. When applying finv=0.87 instead of finv=0.96, we observed higher WM T1 estimates, more in line with estimates reported using other techniques at 7T9,10. Ideally, a map of finv should be used in the signal modeling as the efficiency will vary across tissue types based on macromolecular content.Conclusions
When performing MP2RAGE-based T1-mapping, a lower inversion efficiency than the one typically used should be applied to avoid underestimated T1 values. This pertains particularly to WM.Acknowledgements
Grant support by the Swedish Research Council (NT 2014-6193). Lund University Bioimaging Center (LBIC) is acknowledged for experimental resources (equipment grant VR RFI 829-2010-5928).References
1. Hagberg GE, Bause J, Ethofer T, et al. Whole brain MP2RAGE-based mapping of the longitudinal relaxation time at 9.4T. Neuroimage. 2017;144(Pt A):203-216. doi:10.1016/j.neuroimage.2016.09.047.
2. Reynolds L, Morris SR, Vavasour IM, et al. T1 Relaxation of White Matter Following Adiabatic Inversion. In proceedings of the 2021 ISMRM Annual Meeting & Exhibition. Abstract no. 3074.
3. Dortch RD, Moore J, Li K, et al. Quantitative magnetization transfer imaging of human brain at 7 T. Neuroimage. 2013;64:640-649. doi:10.1016/j.neuroimage.2012.08.047.
4. Marques JP, Kober T, Krueger G, van der Zwaag W, Van de Moortele PF, Gruetter R. MP2RAGE, a self bias-field corrected sequence for improved segmentation and T1-mapping at high field. Neuroimage. 2010;49(2):1271-1281. doi:10.1016/j.neuroimage.2009.10.002.
5. Hurley AC, Al-Radaideh A, Bai L, et al. Tailored RF pulse for magnetization inversion at ultrahigh field. Magn Reson Med. 2010;63(1):51-58. doi:10.1002/mrm.22167.
6. Deichmann R, Good CD, Josephs O, Ashburner J, Turner R. Optimization of 3-D MP-RAGE sequences for structural brain imaging. Neuroimage. 2000;12(1):112-127. doi:10.1006/nimg.2000.0601.
7. Marques JP, Gruetter R. New developments and applications of the MP2RAGE sequence--focusing the contrast and high spatial resolution R1 mapping. PLoS One. 2013;8(7):e69294. Published 2013 Jul 16. doi:10.1371/journal.pone.0069294.
8. Olsson H, Andersen M, Helms G. Reducing bias in DREAM flip angle mapping in human brain at 7T by multiple preparation flip angles. Magn. Reson. Imaging. 2020;72:71–77. doi: 10.1016/j.mri.2020.07.002.
9. Rioux JA, Levesque IR, Rutt BK. Biexponential longitudinal relaxation in white matter: Characterization and impact on T1 mapping with IR-FSE and MP2RAGE. Magn Reson Med. 2016;75(6):2265-2277. doi:10.1002/mrm.25729.
10. Olsson H, Andersen M, Lätt J, Wirestam R, Helms G. Reducing bias in dual flip angle T1 -mapping in human brain at 7T. Magn Reson Med. 2020;84(3):1347-1358. doi:10.1002/mrm.28206.
Figures