0369
Quantitative atlas of T1 relaxation times in the cerebral cortex for personalized characterization of pathology1Advanced Clinical Imaging Technology, Siemens Healthcare AG, Lausanne, Switzerland, 2Department of Radiology, Lausanne University Hospital and University of Lausanne, Lausanne, Switzerland, 3LTS5, École Polytechnique Fédérale de Lausanne (EPFL), Lausanne, Switzerland, 4Department of Radiology, First Faculty of Medicine, Charles University and General University Hospital, Prague, Czech Republic, 5Department of Neurology and Center of Clinical Neuroscience, First Faculty of Medicine, Charles University and General University Hospital, Prague, Czech Republic, 6Department of Neuroradiology, Medical Center – University of Freiburg, Faculty of Medicine, University of Freiburg, Freiburg, Germany, 7Divsion of Neuroradiology, Department of Radiology and Medical Informatics, Hôpitaux Universitaires de Genève (HUG), Geneva, Switzerland
Synopsis
Comparing single-patient data to atlases of normative relaxation times in the brain enables personalized characterization of pathological tissue. However, an accurate comparison is challenging in the cortex due to the gyrification of gray matter and resulting registration problems. This work addresses this problem for parametric T1 maps that were acquired from 285 healthy subjects. A method aligning inter-subject brain cortices was developed to enable the comparison of cortical T1 values. We thus established a normative atlas accounting for healthy T1 values in brain cortical tissues, to be used to detect and characterize pathology-induced T1 alterations in patients.
Introduction
Recent studies on brain relaxometry have shown the potential of comparing single-patient data to atlases of normative tissue parameters for the personalized characterization of pathological tissue in white matter (WM)1–4. However, achieving the same goal in cortical gray matter (GM) is challenging; the complex cortical folding patterns as well as the large anatomical inter-subject variability of the cortices hinder an accurate spatial normalization of MR data.To address this issue, this study introduces a method for inter-subject brain cortex alignment to enable the comparison of T1 measurements in cortical GM between an atlas of normative relaxation times and a map acquired in a single subject. The feasibility and sensitivity of the established atlas in the detection of tissue alterations is demonstrated in three case reports.
Methods
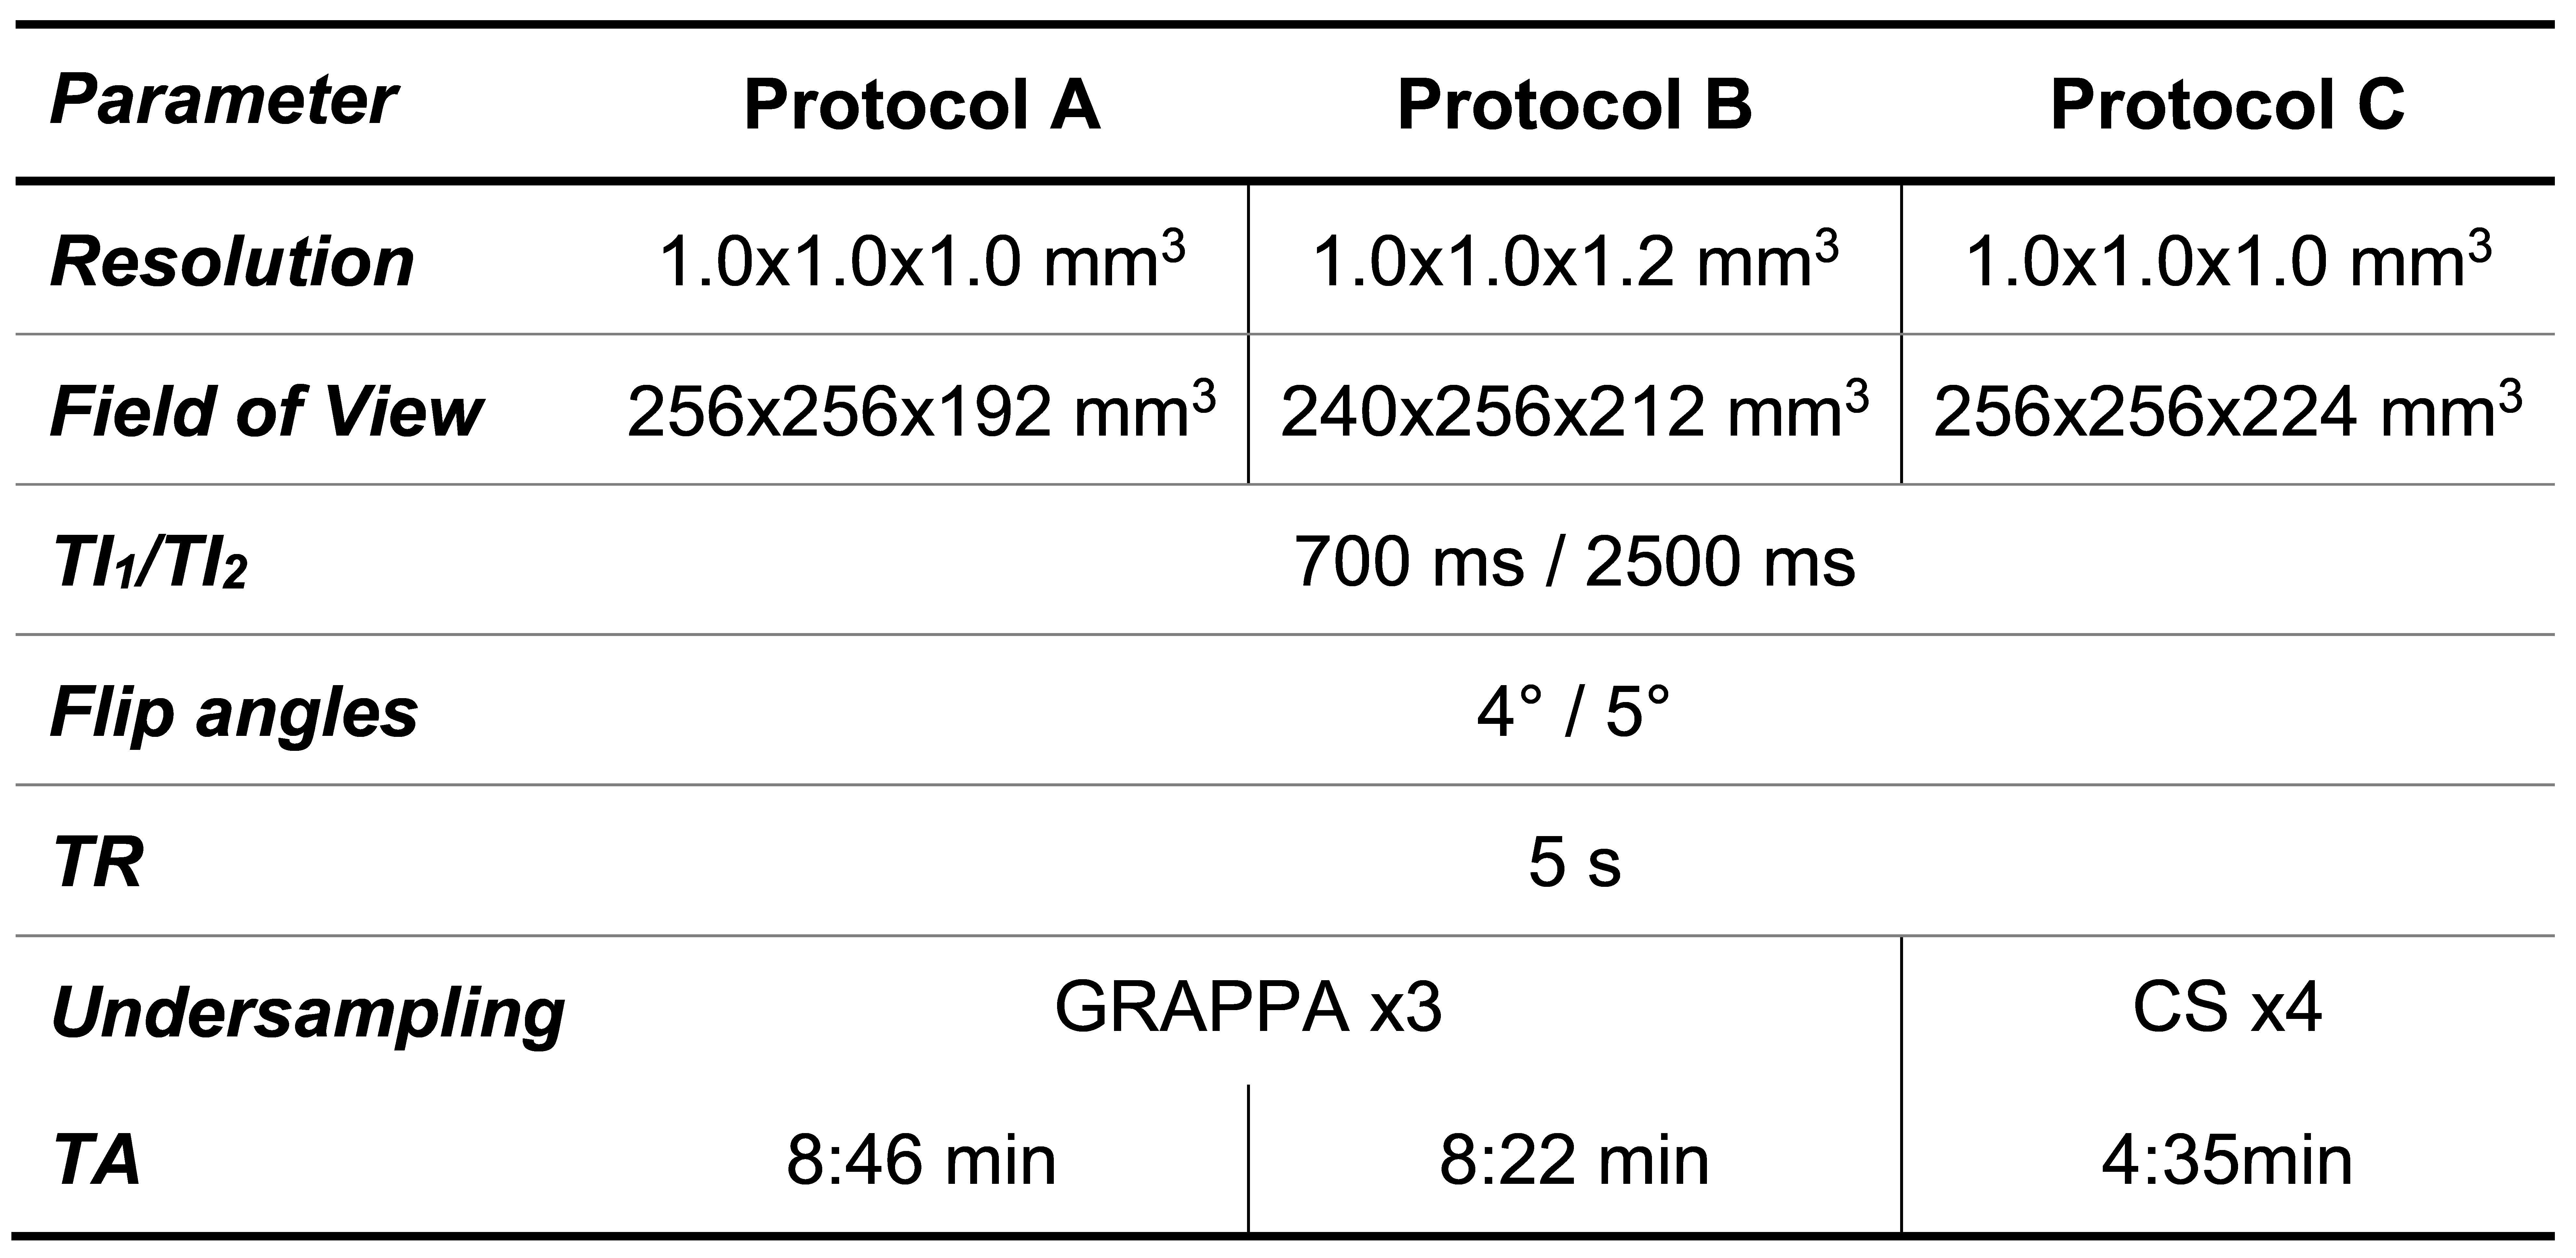
Study population and MR protocolTwo cohorts of healthy individuals were scanned in two different centers:
- Site A: 201 subjects (123 females, age = [20-64] y/o);
- Site B: 84 subjects (53 females, age = [21-58] y/o).
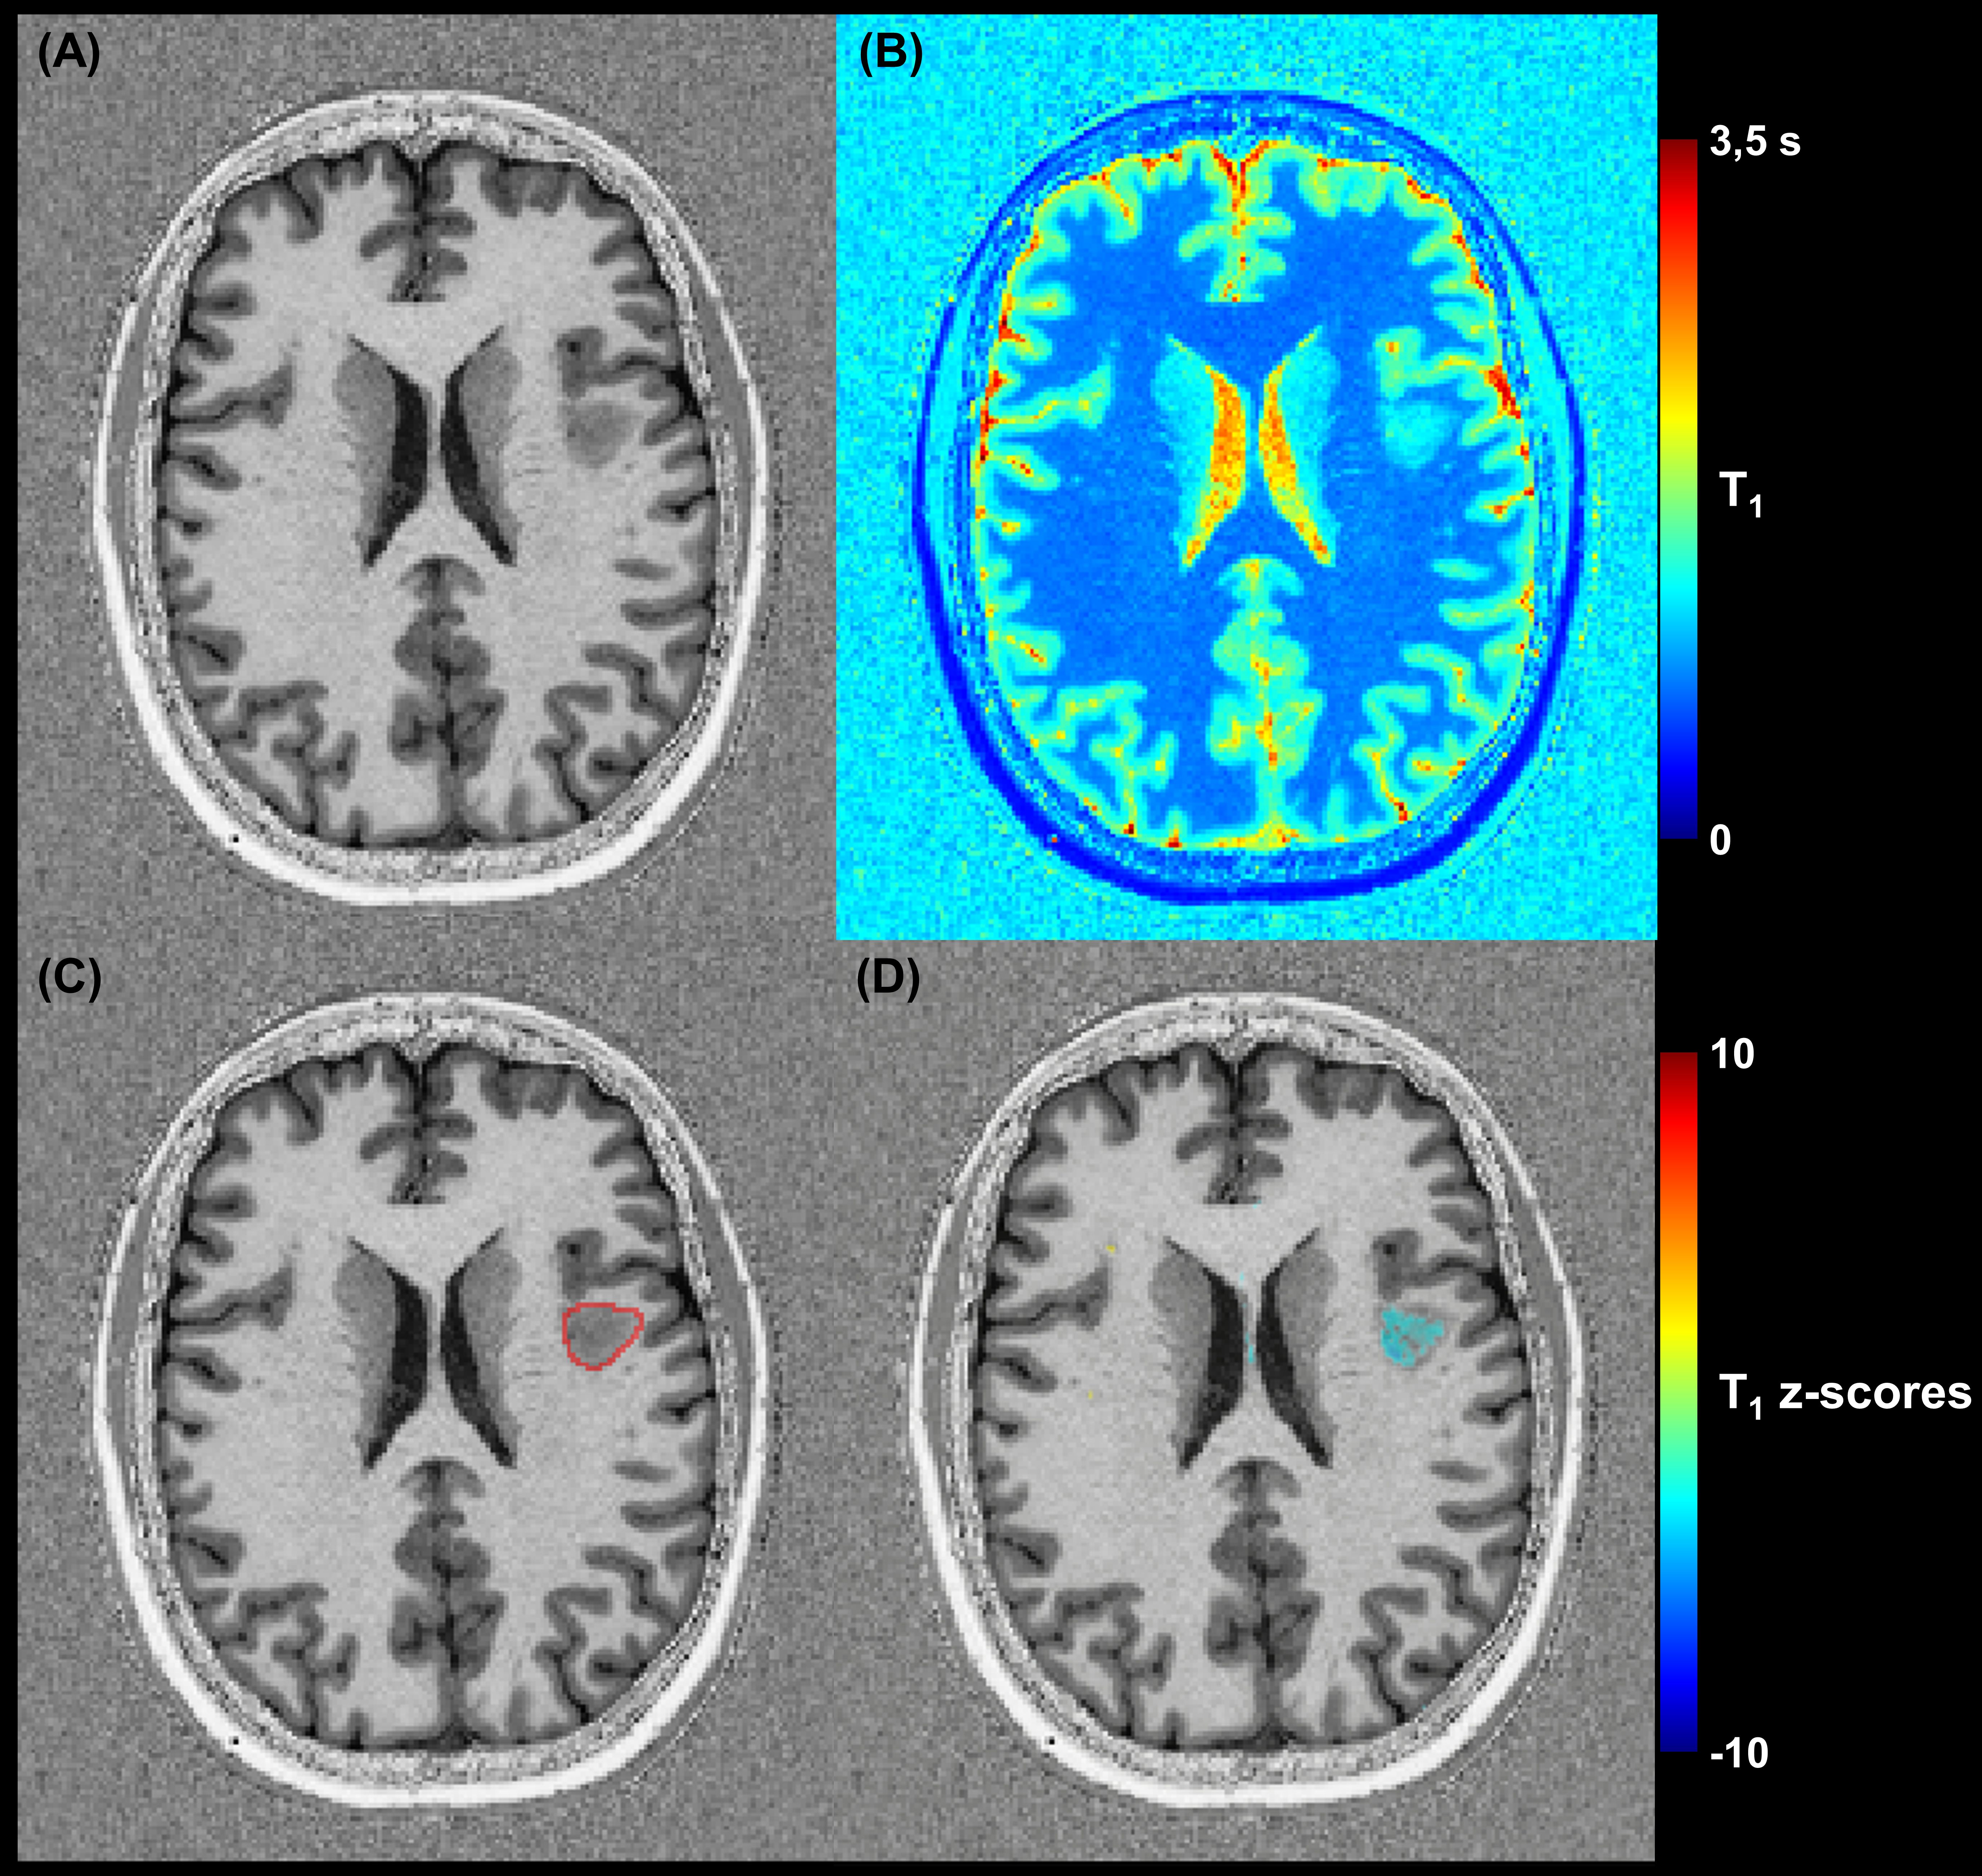
For a proof-of-concept, MP2RAGE data were also acquired in a patient (female, 36 y/o) with focal cortical dysplasia (FCD) (Table 1, protocol A) and two patients (male, 53 y/o; and female, 61 y/o) with multiple sclerosis (MS) (Table 1, protocol C), in agreement with the institutional regulations. One radiology resident and one neuroradiologist (4 and 20 years of experience, respectively) manually segmented abnormal tissue regions in the FCD data.
Brain cortices alignment
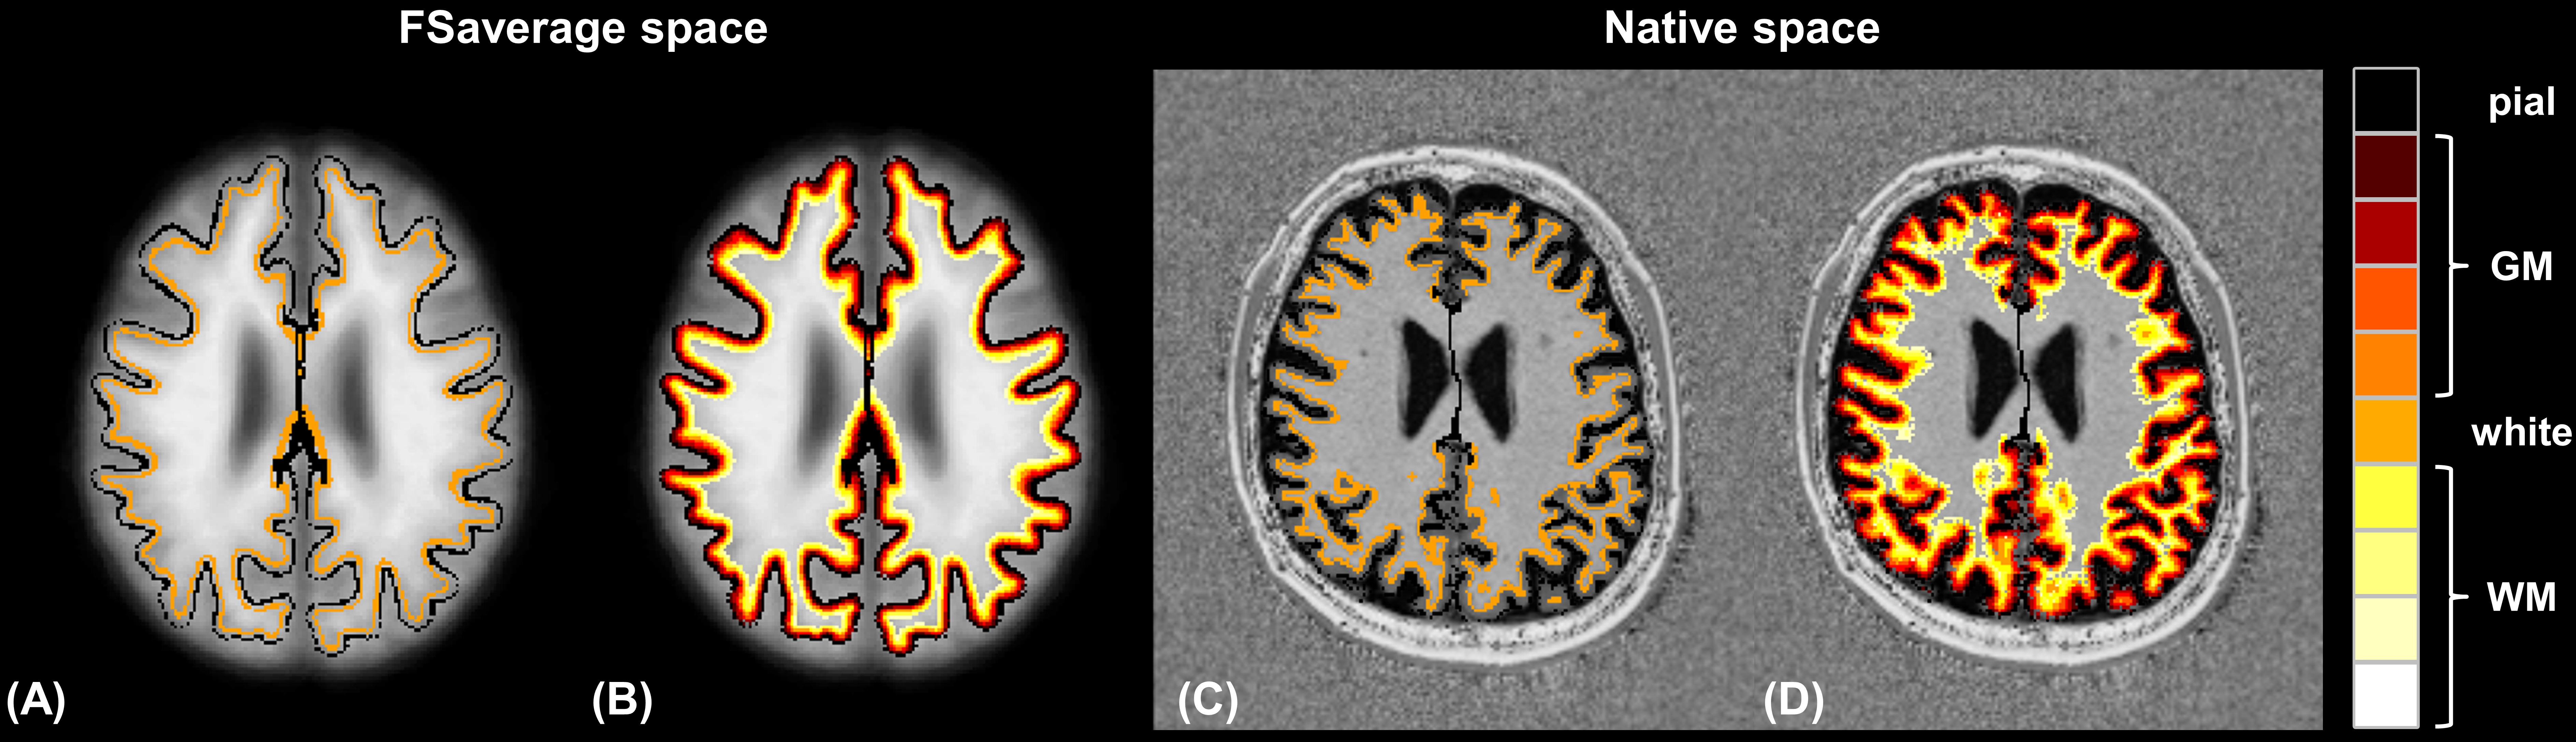
To enable the inter-subject and voxel-wise comparison of T1 relaxation times in cortical tissues, the brain surface reconstruction pipeline of FreeSurfer was employed6. A watershed algorithm was first used to remove the skull from the MP2RAGE uniform T1-weighted contrast (“UNI”)7. After spatially registering the skull-stripped UNI image onto the FreeSurfer MNI305 template, the exact spatial locations of the WM/GM boundaries (“white surface”) and GM to cortical cerebrospinal fluid boundaries (“pial surface”) were extracted with a surface-based algorithm8. The healthy subjects’ cortices were subsequently resampled onto the FreeSurfer average surfaces, resulting in accurate brain alignment that accounts for inter-individual differences in cortical folding patterns. To extract T1 values from multiple cortical layers, vectors orthogonal to the white surface at each vertex along the surface were computed and used to project the white surface along them. A projection fraction of 1/5 was used to obtain four GM layers, at 20%, 40%, 60% and 80% depth of the cortex (with 0% and 100% depths corresponding to the white and pial surfaces, respectively). Similarly, four juxtacortical WM layers were estimated by projecting the white surface in the inward direction (see Figure 1).
Normative atlases
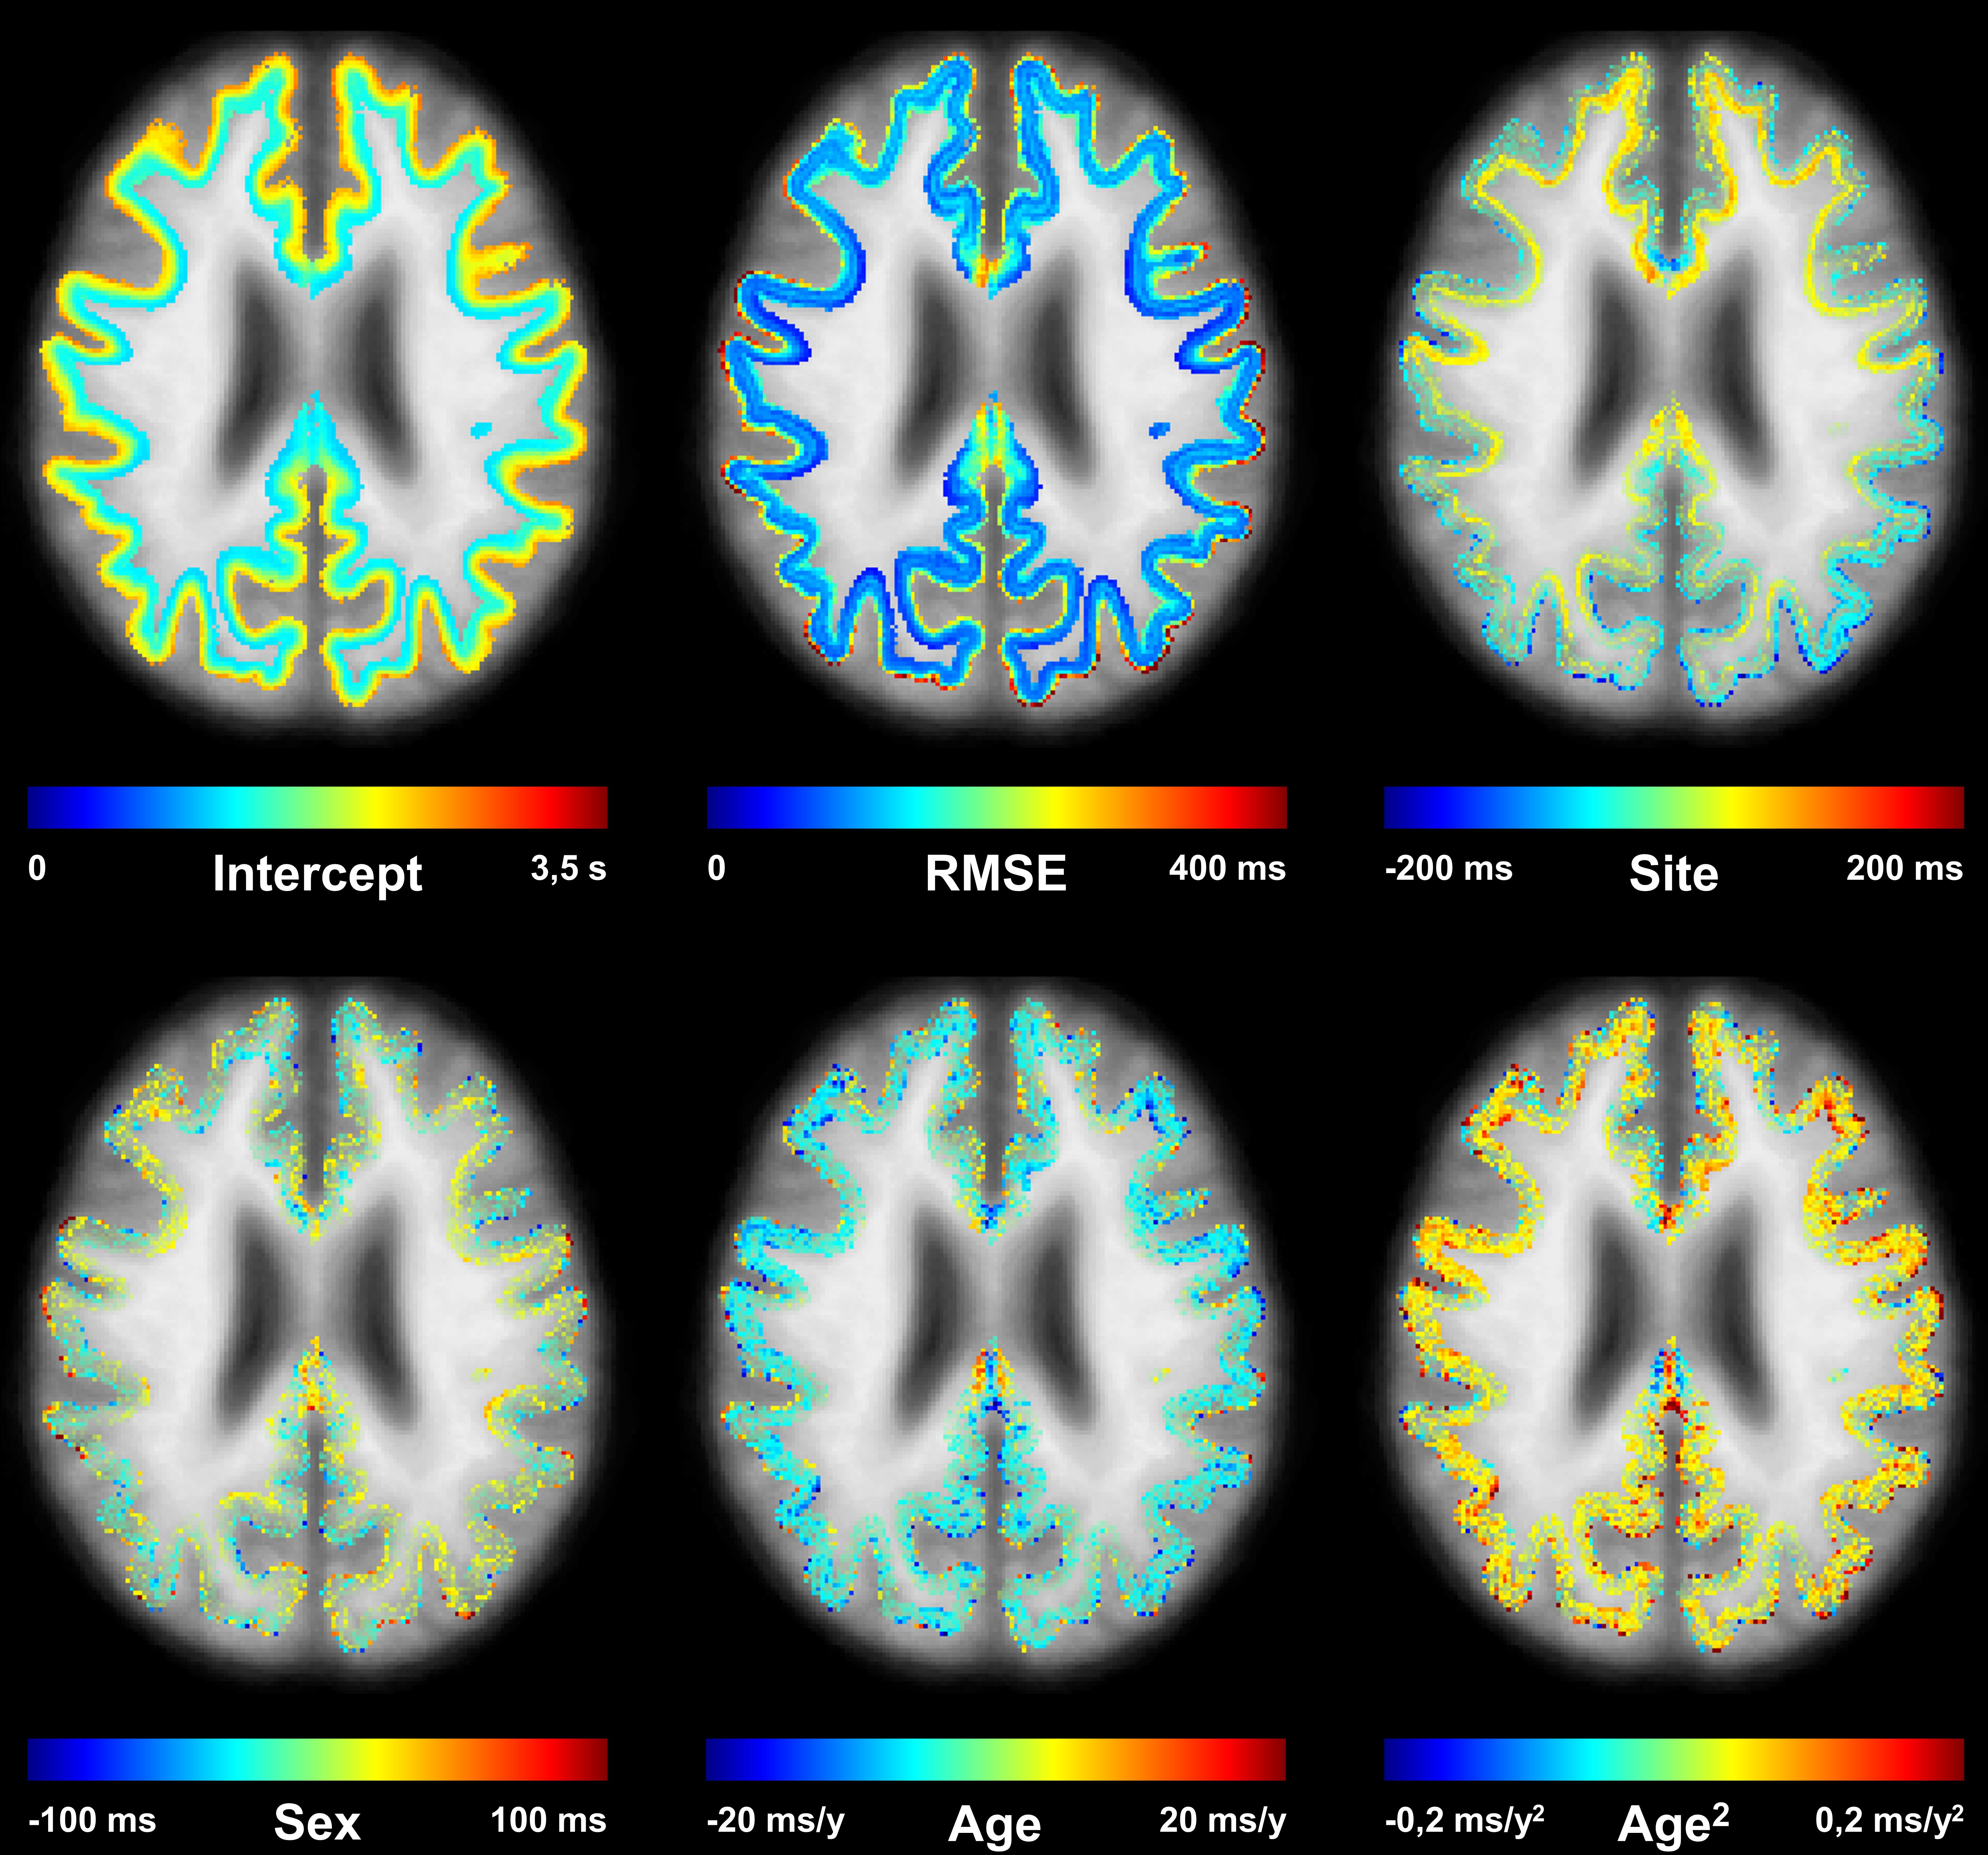
A mixed-effects model (fixed effects: sex, age, age2; random effect: site) was used to establish a voxel-wise normative atlas of T1 relaxation times in the FreeSurfer average space:$$\mathit{E}\left\{T_{1,j}\right\}=\ {(\beta}_0+u_{0,j})+\beta_{sex}\ast sex+\beta_{age}\ast age+\beta_{{age}^2}\ast{age}^2\qquad\qquad \textrm{(Eq. 1)}$$with $$$j$$$=(1,2) referring to the two sites, $$$\beta_i$$$ being the coefficients of the fixed effects and $$$u_{0,j}$$$ the coefficient of the random effect.
Method for single-subject comparison
To characterize abnormal T1 values on a single-subject basis, the T1 map of a patient is transformed into the FreeSurfer average space by applying the same processing as previously described. Abnormal T1 values are then characterized in a voxel-wise manner by computing z-scores within each surface. Subsequently, each resulting surface in the FreeSurfer average space is resampled, together with its z-scores, into the corresponding subject’s native surface, converted back to volumetric intensities, and concatenated into a unique deviation map.
Results
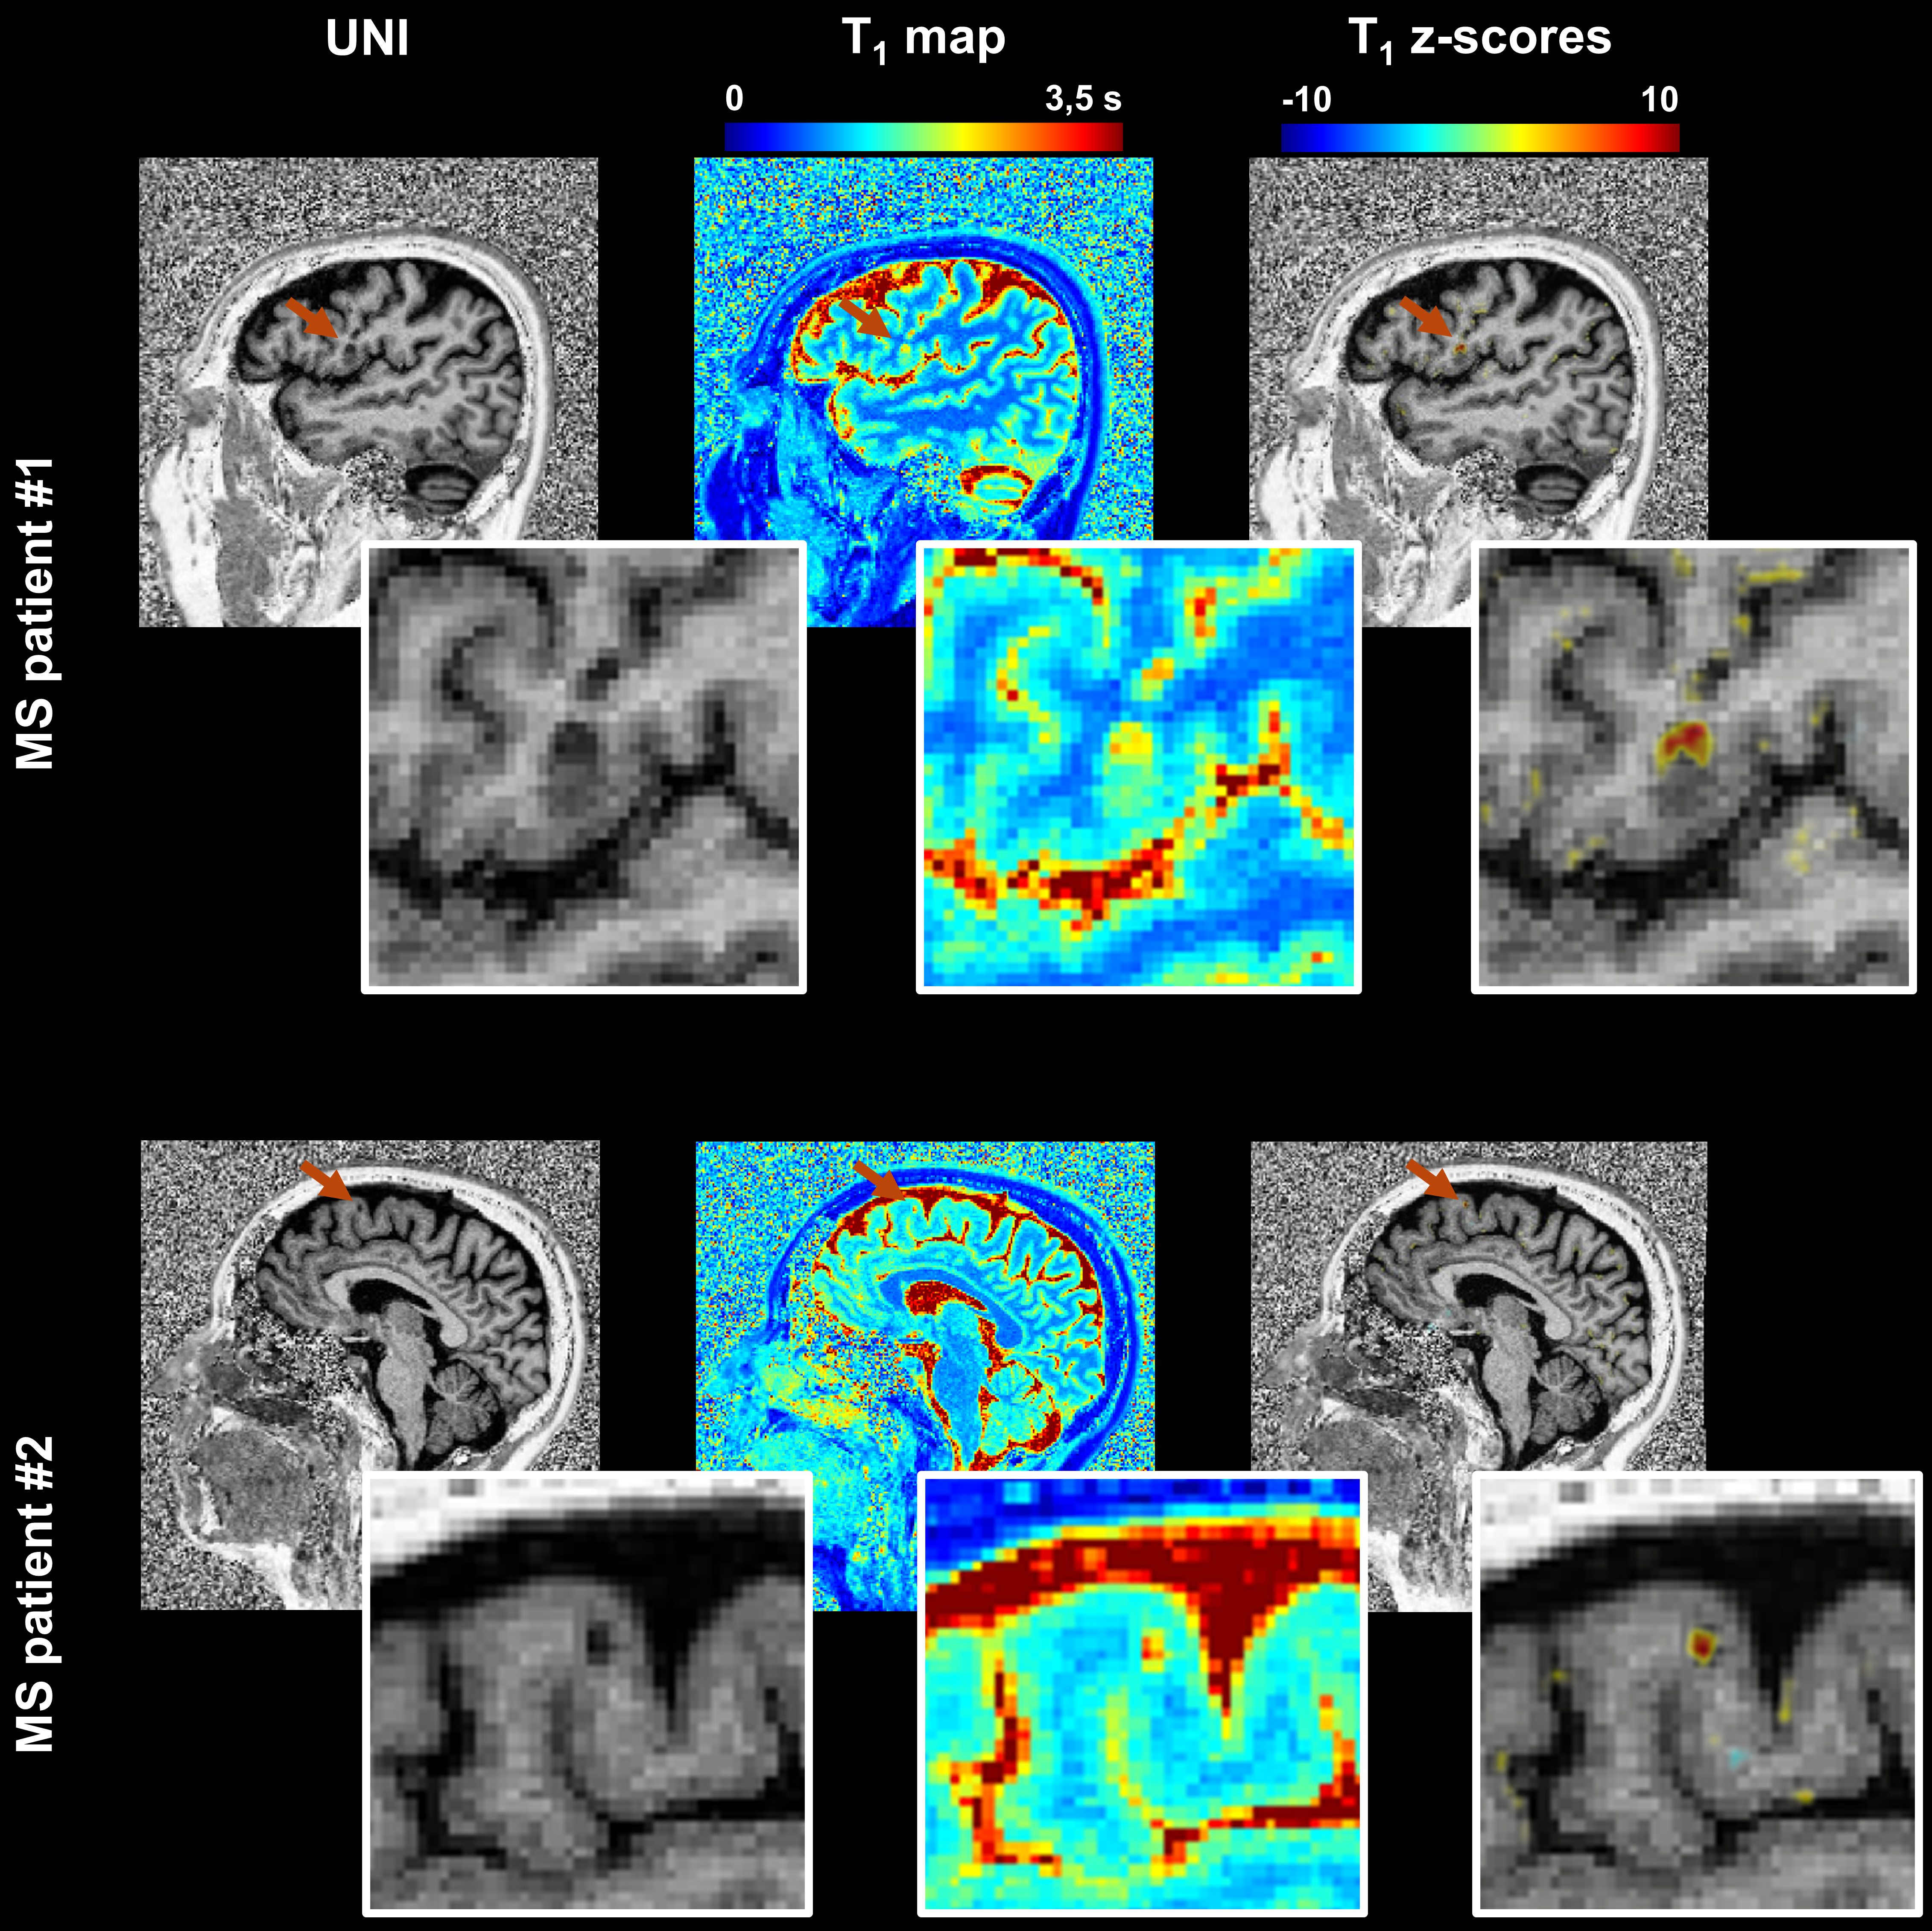
Example axial slices of the established T1 atlas are shown in Figure 2. The average T1 values (i.e., intercept coefficient at mean age of the healthy cohort) were found to range from 745 ms to 2187 ms according to the cortical depth and to differ among brain regions. The RMSE of the models was found to increase when moving from WM to GM and to be higher in the frontal lobe, a brain region that also showed the largest T1 variations due to the different sites (Figure 2).The deviation map computed from the FCD patient’s data identified an area of abnormally reduced T1 values (mean z-score of -2.25), which corresponded with the expert’s manual segmentation (Figure 3). Lesions in juxtacortical WM and cortical GM of the MS patients were also detected by the method (Figure 4), exhibiting increased T1 values (i.e., positive z-scores).
Discussion and Conclusion
This work introduced a new method to determine normative T1 values in the juxtacortical WM and cortical GM. The potential to detect cortical tissue alterations with the established atlas was demonstrated in three case patients with neurological conditions affecting cortical regions. The resolution of the acquired images limits the maximum number of cortical layers that can be extracted. Ultra-high field strength imaging thus represents a good option for future work to overcome this limitation.In conclusion, promising proof-of-concept results were obtained which could enable robust pathology characterization on a single-subject basis in cortical GM.
Acknowledgements
No acknowledgement found.References
1. Piredda GF, Hilbert T, Granziera C, et al. Quantitative brain relaxation atlases for personalized detection and characterization of brain pathology. Magn Reson Med. 2020;83(1):337-351. doi:10.1002/mrm.27927
2. Piredda GF, Hilbert T, Vaneckova M, et al. Periventricular gradients of brain pathology in early and progressive MS revealed by qMRI. In: Proceedings of the International Society of Magnetic Resonance in Medicine. 2021. Abstract number: 2795.
3. Ravano V, Piredda GF, Vaneckova M, et al. T1 abnormalities in atlas-based white matter tracts: reducing the clinico-radiological paradox in multiple sclerosis using qMRI. In: Proceedings of the International Society of Magnetic Resonance in Medicine. 2021. Abstract number: 2796.
4. Chamberland M, Genc S, Tax CMW, et al. Detecting microstructural deviations in individuals with deep diffusion MRI tractometry. Nat Comput Sci. 2021;1(9):598-606. doi:10.1038/s43588-021-00126-8
5. Marques JP, Kober T, Krueger G, van der Zwaag W, Van de Moortele P-F, Gruetter R. MP2RAGE, a self bias-field corrected sequence for improved segmentation and T1-mapping at high field. Neuroimage. 2010;49(2):1271-1281. doi:10.1016/j.neuroimage.2009.10.002
6. Fischl B. FreeSurfer. Neuroimage. 2012;62(2):774-781. doi:10.1016/j.neuroimage.2012.01.021
7. Fujimoto K, Polimeni JR, van der Kouwe AJW, et al. Quantitative comparison of cortical surface reconstructions from MP2RAGE and multi-echo MPRAGE data at 3 and 7T. Neuroimage. 2014;90:60-73. doi:10.1016/j.neuroimage.2013.12.012
8. Fischl B, Sereno MI, Dale AM. Cortical Surface-Based Analysis. Neuroimage. 1999;9(2):195-207. doi:10.1006/nimg.1998.0396
Figures