0368
Microscopic neuropathology can be seen using accelerated combined diffusion-relaxation MRI1National Institute on Aging, Baltimore, MD, United States, 2National Institute of Child Health and Human Development, Bethesda, MD, United States, 3Uniformed Services University of the Health Sciences, Bethesda, MD, United States
Synopsis
Here we present MRI acquisitions that maximize the amount of information in an image by using a combination of magnetic field profiles to probe relaxation and diffusion mechanisms simultaneously, thus resolving sub-voxel information from ex vivo brain segments of human subjects that sustained traumatic brain injury. We then propose a strategy to refine the ensuing abundance of high-dimensional data, and to sort and recover biologically relevant information into actionable and quantitative injury biomarker images that capture subtle neuropathology.
Introduction
A fundamental obstacle for using MRI to characterize tissue heterogeneity is the averaging that occurs within a voxel. Voxel-averaged images can only provide macroscopic information with respect to the voxel size, which is typically ~1-3 mm3. In a mammalian brain, a voxel contains multiple chemical and physical microenvironments such as neurons, glia, myelin, and cerebrospinal fluid. Many biological processes-of-interest take place at a microscopic scale that only affects a small portion of any given voxel, which makes them undetectable using conventional voxel-averaged MRI methods.By simultaneously encoding multiple MR ``dimensions'', such as relaxation times1 ($$$T_1$$$ and $$$T_2$$$) and diffusion2-3, multidimensional distributions of those MR parameters can provide fingerprints of various chemical and physical microenvironments, which can be traced back to specific materials and cellular components. If combined with imaging4, multidimensional MRI has the potential to overcome the voxel-averaging limitation by accomplishing two goals: (1) it provides unique intra-voxel distributions instead of an average over the whole voxel; this allows identification of multiple components within a given voxel5-7, while (2) the multiplicity of dimensions inherently facilitates their disentanglement; this allows higher accuracy and precision in derived quantitative values8-11.
A recent study12 used multidimensional MRI to investigate brain samples derived from human subjects who had sustained traumatic brain injury (TBI) and control brain donors using MRI, followed by co-registered histopathology that included amyloid precursor protein (APP) immunoreactivity to define axonal injury severity13. Abnormal $$$T_1$$$-$$$T_2$$$, mean diffusivity-$$$T_2$$$ (MD-$$$T_2$$$), and MD-$$$T_1$$$ spectral signatures that were strongly correlated with injured voxels were identified and used to generate axonal injury biomarker maps12. Here we study the effect of applying a nonlocal estimation of multispectral magnitudes (NESMA) filter14 on three representative cases from that study (a control and two TBI cases), with the main goal of evaluating its performance on reduced datasets to limit the total acquisition time required for reliable multidimensional MRI characterization of brain tissue. The co-registered APP histology images serve as a ``ground truth'' reference, thus providing a unique opportunity to quantitatively evaluate to what extent the accuracy of the injury biomarkers maps is preserved under substantial data reduction.
Methods
Corpora Callosa derived from two subjects that sustained TBI, and one control brain donors underwent post-mortem ex vivo MRI at 7 T. Multidimensional data were acquired with a total of 56 and 302 images for $$$T_1$$$-$$$T_2$$$ and MD-$$$T_2$$$, respectively, and with 300 $$$\mu$$$m isotropic spatial resolution12. To test the feasibility of data reduction using NESMA we derived reduced datasets by sub-sampling the full datasets. The total number of $$$T_1$$$-$$$T_2$$$ images was reduced from 56 to 36 (35.7% decrease), while the total number of MD-$$$T_2$$$ images was reduced from 302 to 122 (59.6% decrease).Following MRI acquisition, slices from the same tissue were tested for APP immunoreactivity to define injury severity. A robust image co-registration method was applied to accurately match MRI-derived parameters and histopathology, after which 12 regions of interest per subject were selected based on APP density. Abnormal multidimensional $$$T_1$$$-$$$T_2$$$, and MD-$$$T_2$$$ components strongly associated with the injury were identified using a spectral thresholding algorithm12, and were then used to generate axonal injury maps (Fig. 1).
Results
We first investigated the spatially-resolved subvoxel $$$T_1$$$-$$$T_2$$$ and MD-$$$T_2$$$ spectral components to assess the effect of NESMA on the derived voxelwise spectra (Figs. 2 and 3 for control and TBI cases, respectively). The filtered maps exhibit lower random variations, in particular at the lower ends of the spectra, with no apparent loss of spectral information.Figure 4 shows histological images and multidimensional MR-derived injury biomarker maps of the three representative cases, obtained using the unfiltered full dataset, the filtered full dataset, and the filtered reduced dataset. Importantly, the data reduction did not significantly affect the resulting injury biomarker maps.
Evaluation of filtering performance was quantified by computing the structural similarity index (SSIM) values15 between the injury biomarker maps under the different experimental conditions and the co-registered APP density histological image as reference. Compared with the unfiltered and reduced data injury biomarker maps, the SSIM values of the filtered and reduced data images increased by 11.1%, 0.9%, and 14.3% for the MD-$$$T_2$$$ biomarker, and increased by 8.6%, 7.7%, and 4.6% for the $$$T_1$$$-$$$T_2$$$ biomarker for Subjects 1 to 3, respectively ($$$p<0.001$$$).
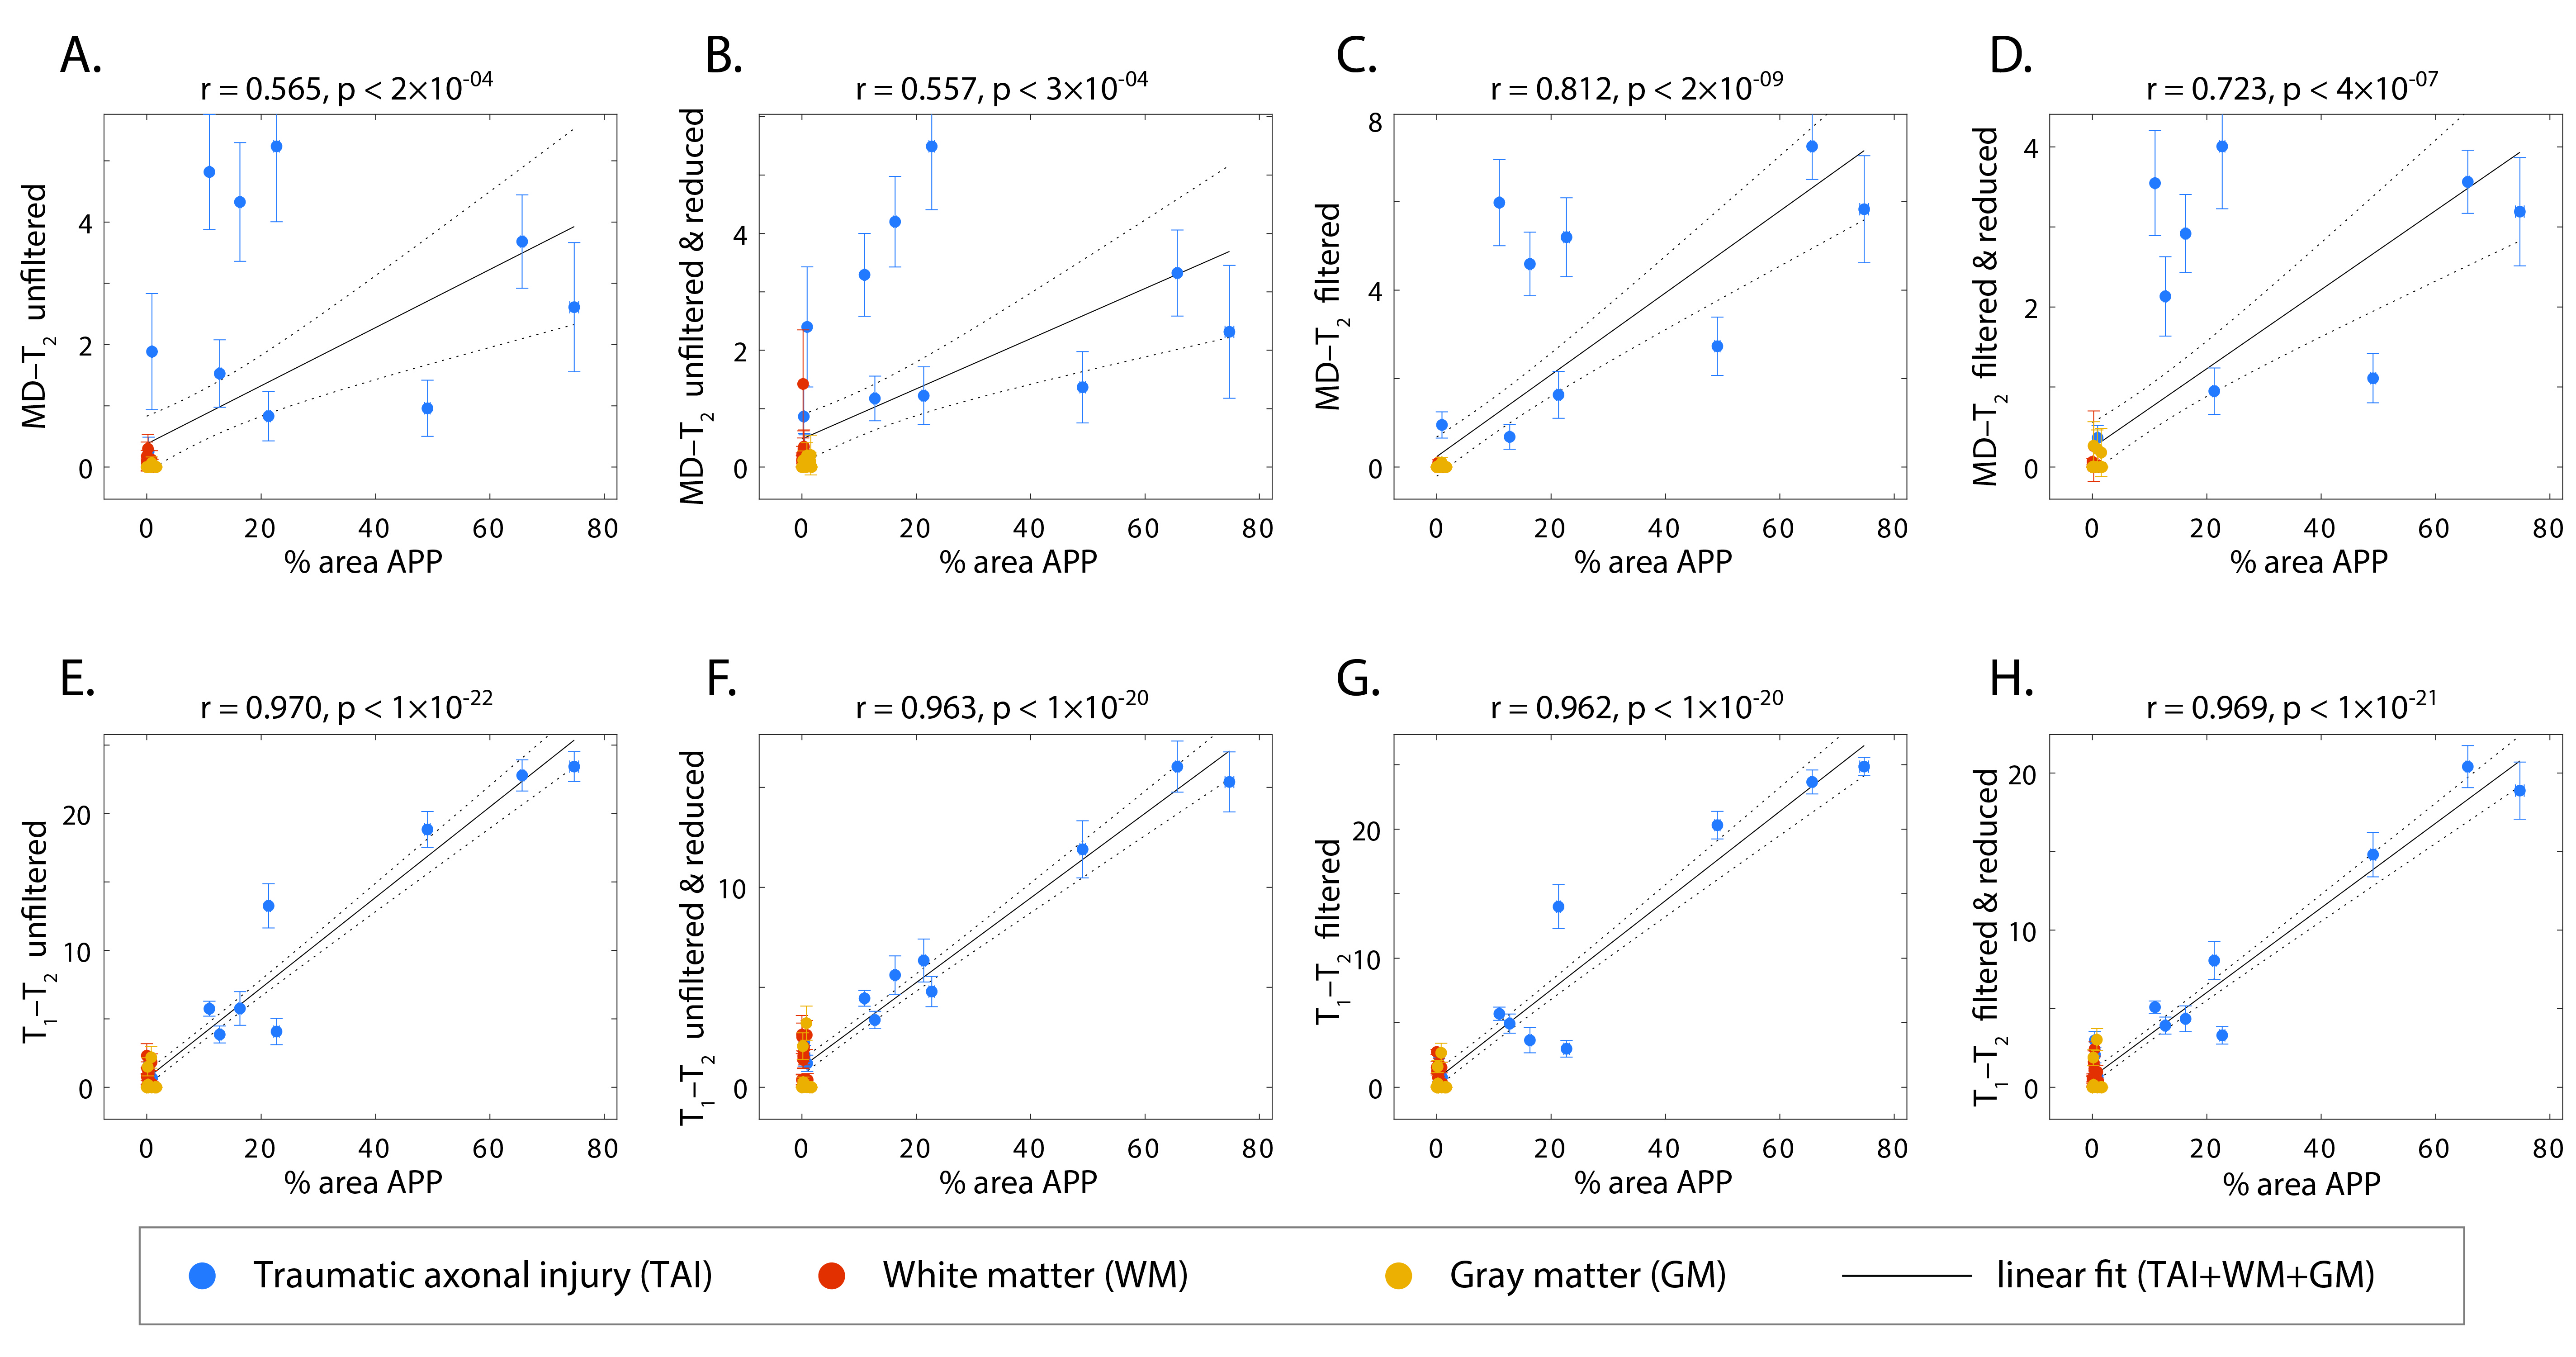
To further evaluate the performance of the NESMA filter and the subsequent data reduction, we performed radiological–pathological correlation analyses with histological APP density and all the investigated MRI parameters under the different experimental conditions. Figure 5 summarizes the association between the investigated MR metrics and the pathological findings in normal white matter, cortical gray matter, and injury ROIs. Marked improvement was observed after filtering the MD-$$$T_2$$$ data, which led to significantly stronger correlation compared with the unfiltered data, even after reducing the dataset by 59.6%.
Discussion
We showed that noise reduction in the multidimensional MRI data using an adaptive nonlocal multispectral filter improved the accuracy of the resulting injury biomarker maps, and furthermore, allowed for data reduction of 35.7% and 59.6% from the full dataset, which led to using only 36 and 122 images in the $$$T_1$$$-$$$T_2$$$ and MD-$$$T_2$$$ cases, respectively. These results suggest that by learning what is "normal", multidimensional MRI is able to detect microscopic neuropathology.Acknowledgements
The opinions expressed herein are those of the authors and are not necessarily representative of those of the Uniformed Services University of the Health Sciences (USUHS), the Department of Defense (DOD), the NIH or any other US government agency.References
- English AE, Whittall KP, Joy MLG, and Henkelman RM. Quantitative Two-Dimensional Time Correlation Relaxometry. Magn Reson Med (1991) 22: 425–34.
- Hürlimann MD, Flaum M, Venkataramanan L, Flaum C, Freedman R, and Hirasaki GJ. Diffusion-relaxation Distribution Functions of Sedimentary Rocks in Different Saturation States. Magn Reson Imaging (2003) 21: 305–10.
- Topgaard D. Multidimensional Diffusion MRI. J Magn Reson (2017) 275: 98–113.
- Benjamini D, and Basser PJ. Multidimensional Correlation MRI. NMR Biomed (2020) 33:e4226.
- de Almeida Martins JP, and Topgaard D. Two-Dimensional Correlation of Isotropic and Directional Diffusion Using NMR. Phys Rev Lett (2016) 116: 087601.
- Kim D, Doyle EK, Wisnowski JL, Kim JH, and Haldar JP. Diffusion-relaxation Correlation Spectroscopic Imaging: A Multidimensional Approach for Probing Microstructure. Magn Reson Med (2017) 78:2236–49.
- Benjamini D, and Basser PJ. Water Mobility Spectral Imaging of the Spinal Cord: Parametrization of Model-free Laplace MRI. Magn Reson Imaging (2019) 56:187–93.
- Benjamini D, and Basser PJ. Magnetic Resonance Microdynamic Imaging Reveals Distinct Tissue Microenvironments. NeuroImage (2017) 163:183–96.
- Slator PJ, Hutter J, Palombo M, Jackson LH, Ho A, Panagiotaki E, et al. Combined Diffusion-relaxometry MRI to Identify Dysfunction in the Human Placenta. Magn Reson Med (2019) 82:95–106.
- Slator PJ, Palombo M, Miller KL, Westin C, Laun F, Kim D, et al. Combined Diffusion-Relaxometry Microstructure Imaging: Current Status and Future Prospects. Magn Reson Med (2021) 86:2987–3011.
- Reymbaut A, Critchley J, Durighel G, Sprenger T, Sughrue M, Bryskhe K, et al. Toward Nonparametric Diffusion- Characterization of Crossing Fibers in the Human Brain. Magn Reson Med (2021) 85:2815–27.
- Benjamini D, Iacono D, Komlosh ME, Perl DP, Brody DL, and Basser PJ. Diffuse Axonal Injury Has a Characteristic Multidimensional MRI Signature in the Human Brain. Brain (2021) 144:800–16.
- Johnson VE, Stewart W, and Smith DH. Axonal Pathology in Traumatic Brain Injury. Exp Neurol (2013) 246:35–43.
- Bouhrara M, Bonny J-M, Ashinsky BG, Maring MC, and Spencer RG. Noise Estimation and Reduction in Magnetic Resonance Imaging Using a New Multispectral Nonlocal Maximum-Likelihood Filter. IEEE Trans Med Imaging (2017) 36:181–93.
- Wang Z, Bovik AC, Sheikh HR, and Simoncelli EP. Image Quality Assessment: From Error Visibility to Structural Similarity. IEEE Trans Image Process (2004) 13:600–12.
Figures
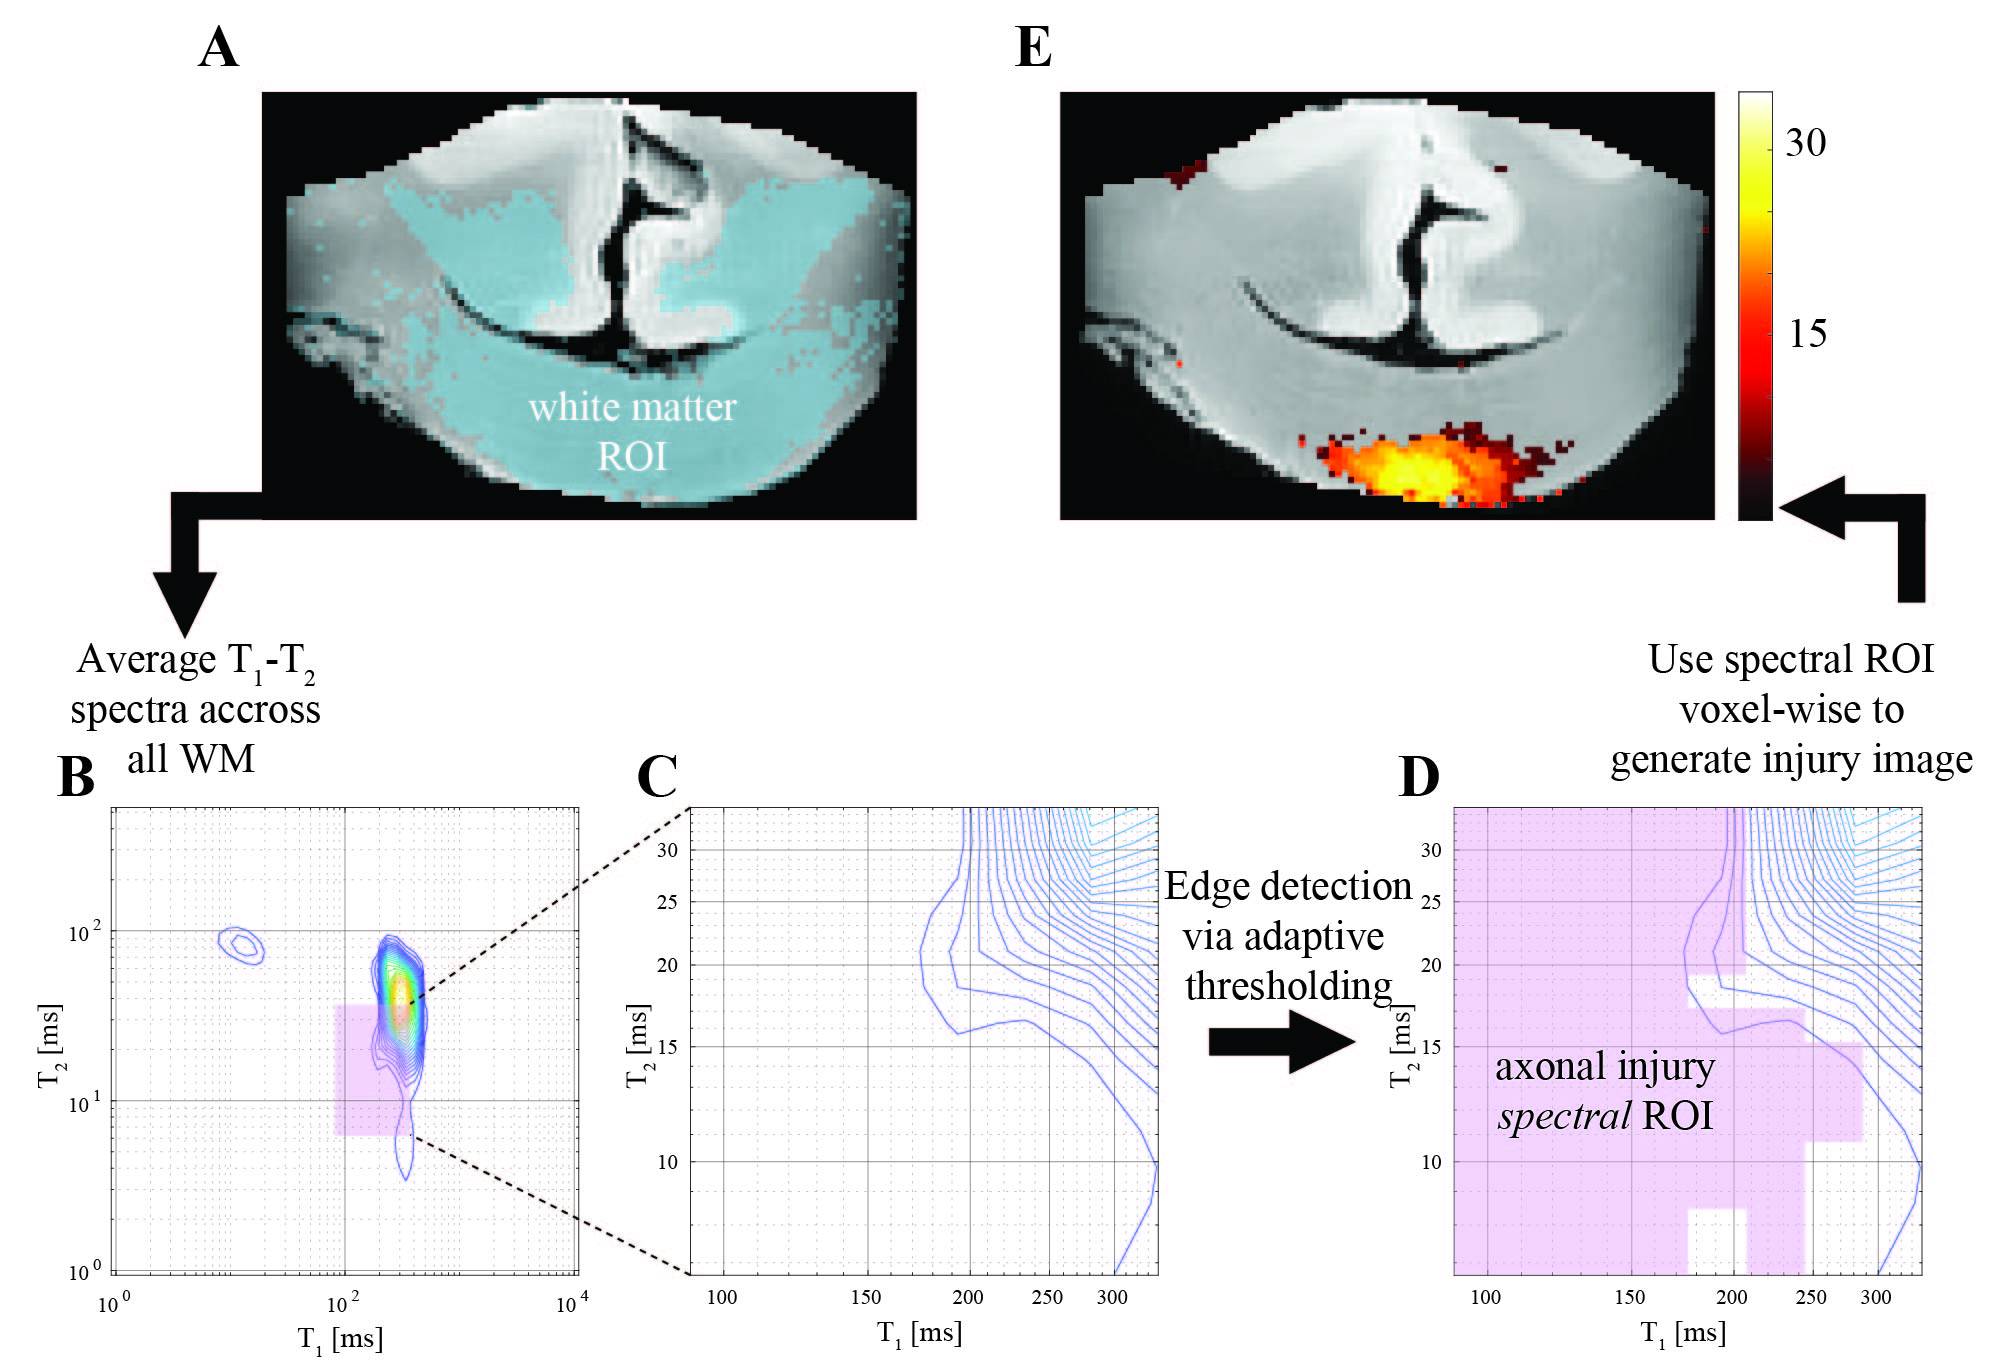
A schematic illustration of the spectral thresholding algorithm, illustrated with a $$$T_1$$$-$$$T_2$$$ dataset. (A) White matter segmented and all voxelwise distributions are averaged, yielding (B) an WM-average spectrum. (C) and (D) An edge detection procedure in the spectral domain to identify the edge of the normal-appearing WM spectral component. Once that edge is found, the spectral ROI is defined as any deviation from 'normal'. (E) The spectral ROI is then applied voxelwise on the dataset, which yields an image of the axonal injury spectral component.
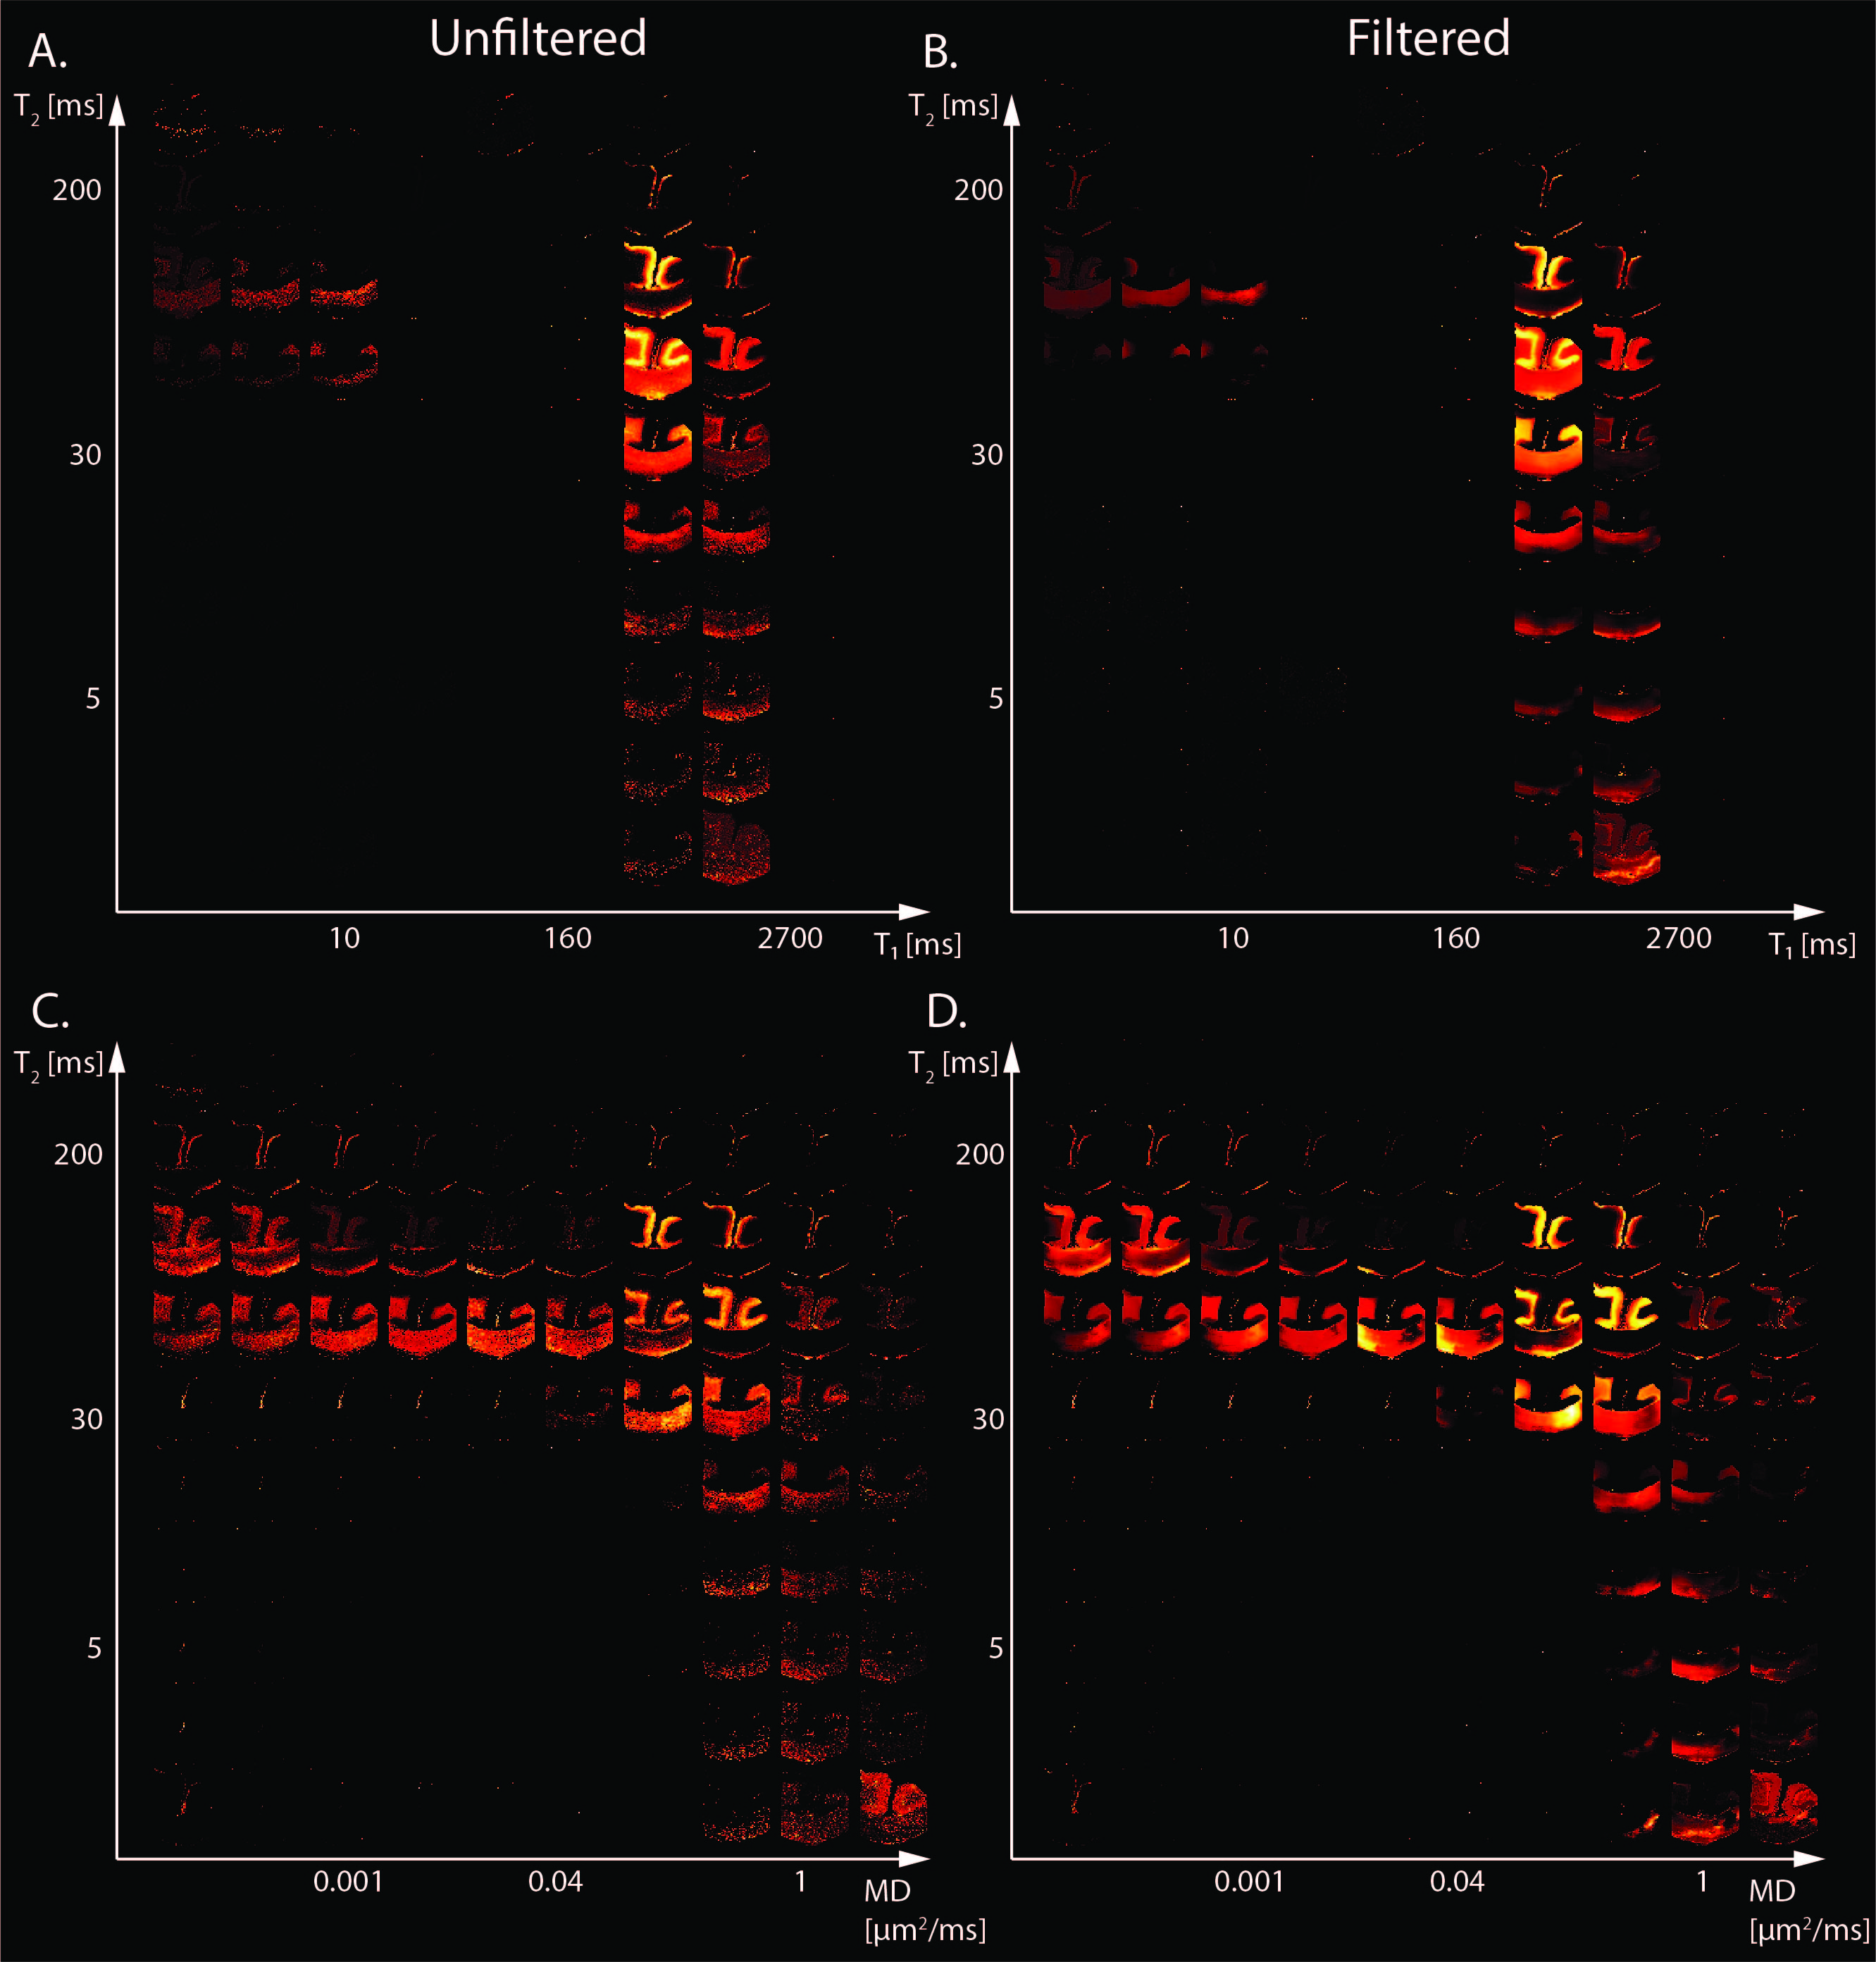
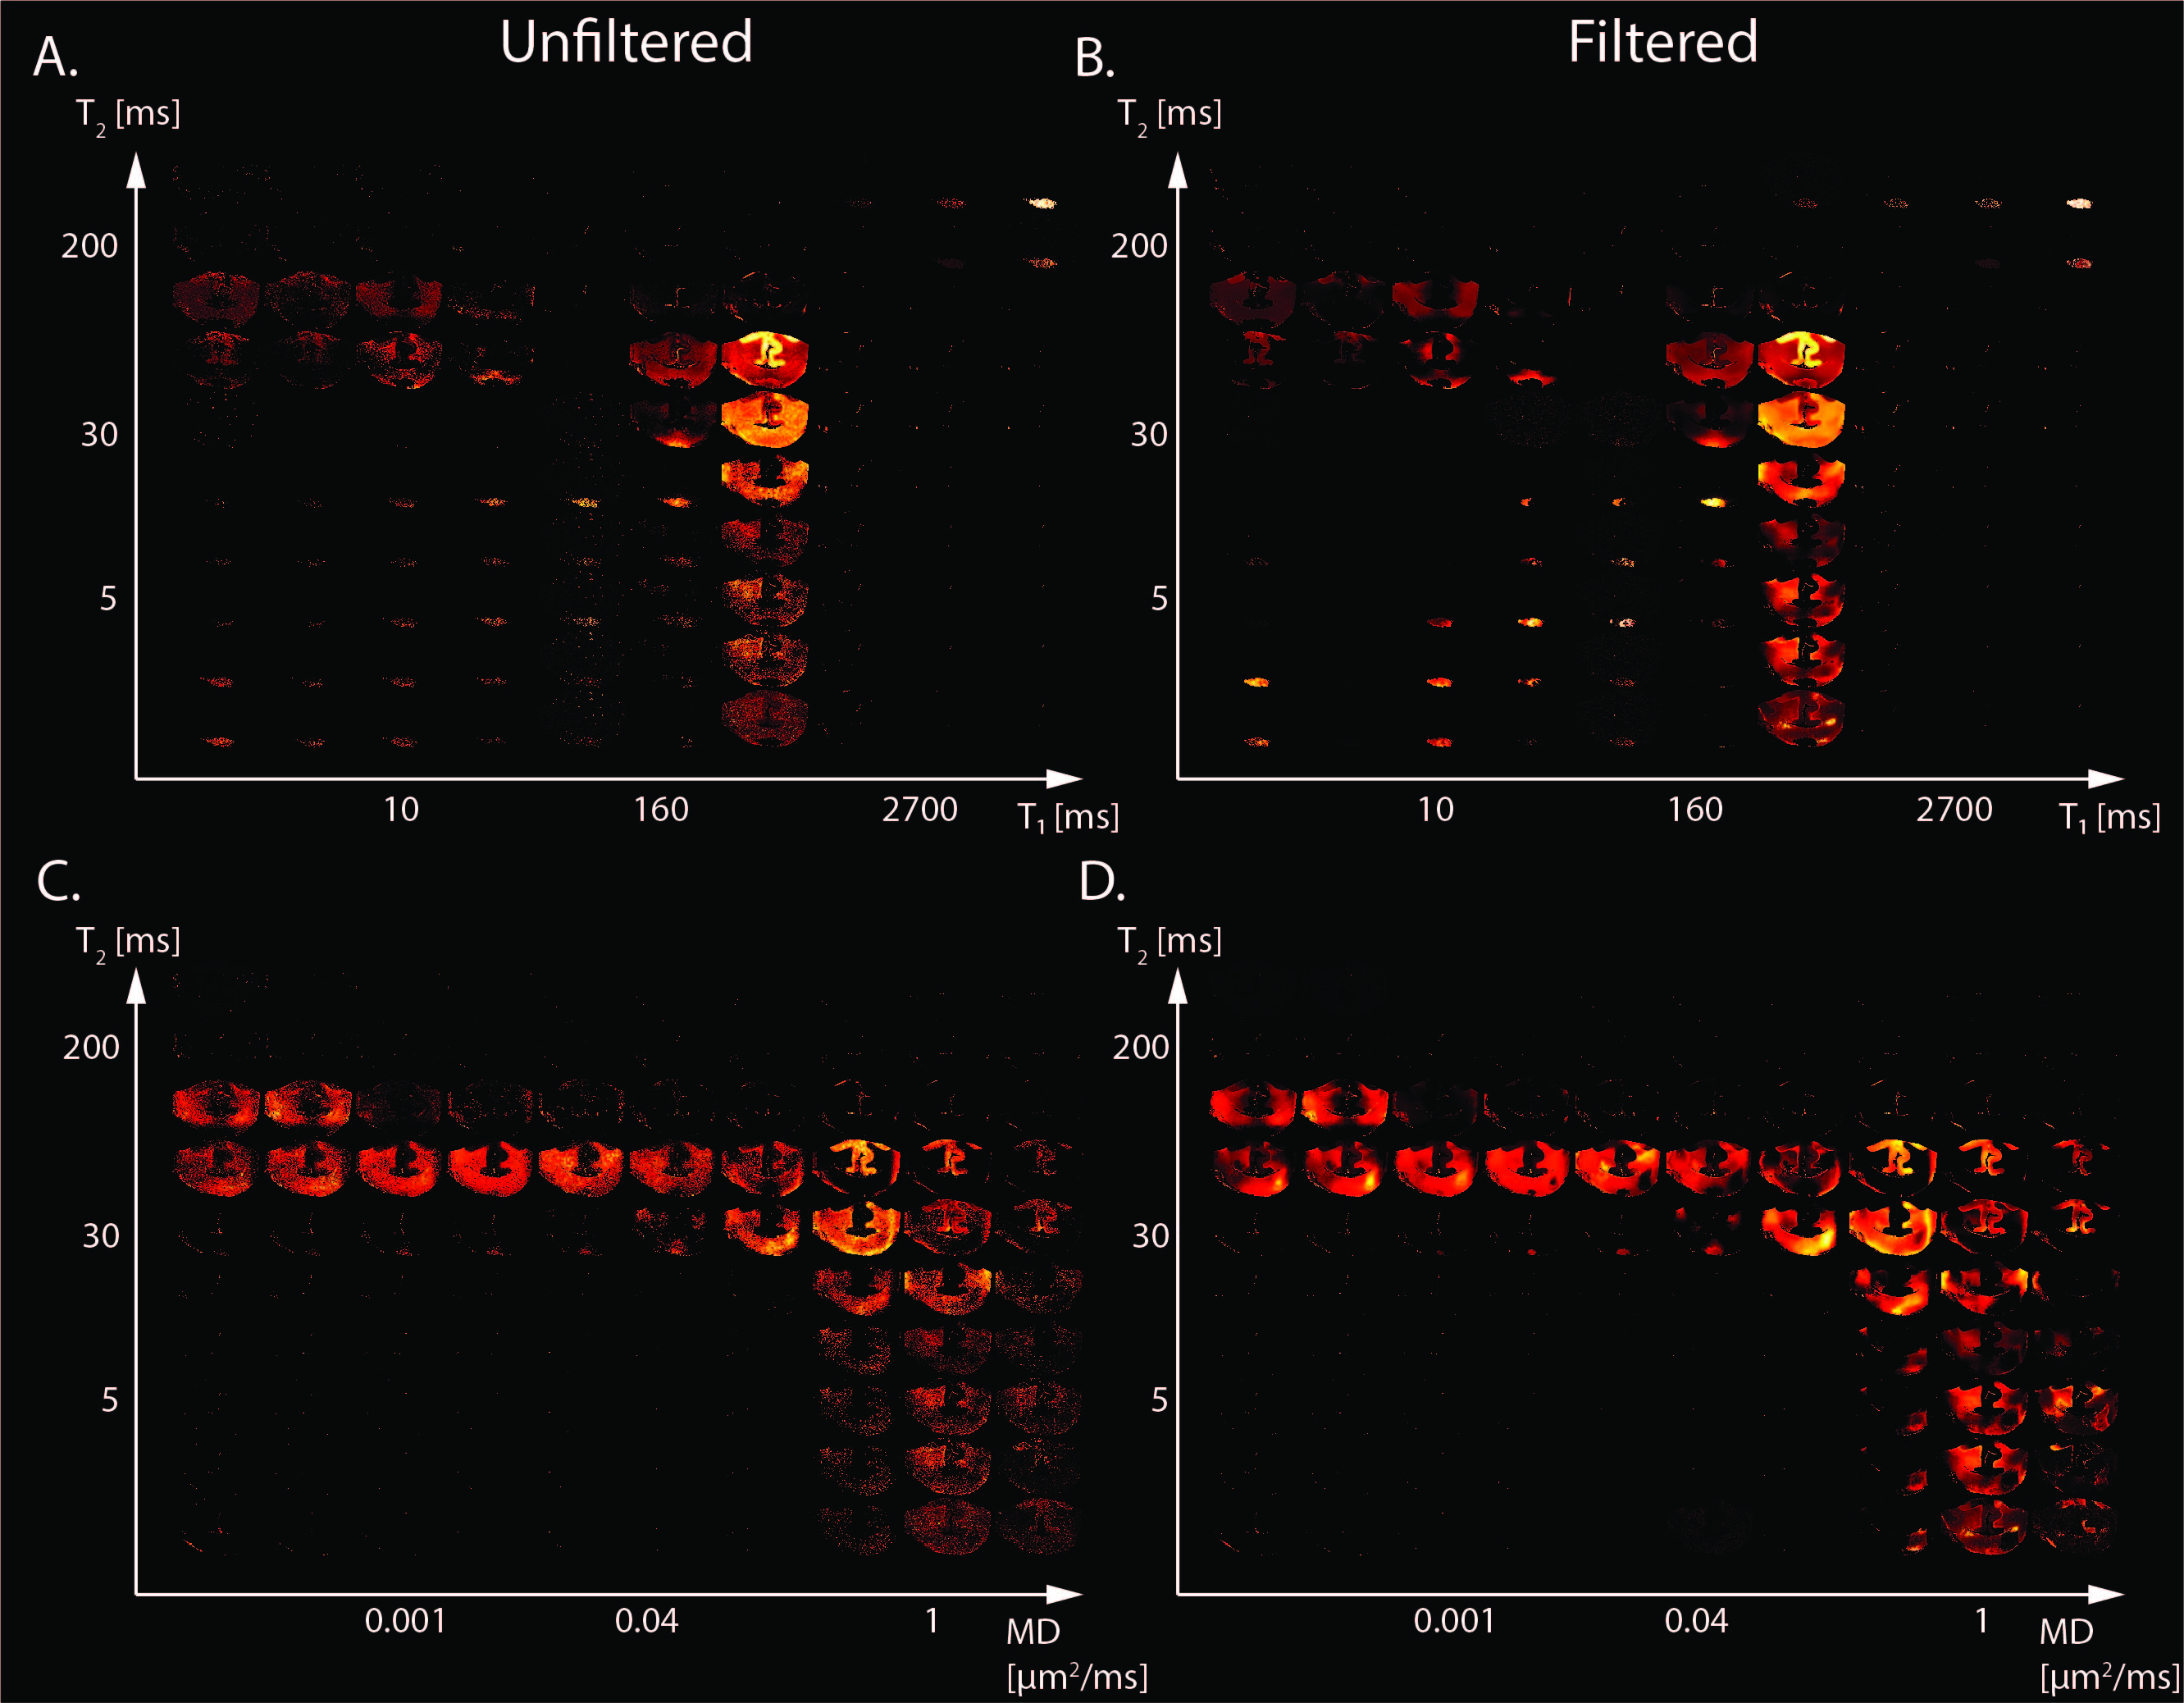
Maps of 2D probability density functions (i.e., 2D normalized spectra) from Subject 3 (TBI) of (A) unfiltered and (B) filtered subvoxel $$$T_1$$$-$$$T_2$$$ values reconstructed on a $$$10X10$$$ grid of subvoxel $$$T_1$$$ values (horizontal axes) and subvoxel $$$T_2$$$ values (vertical axes), and maps of (C) unfiltered and (D) filtered subvoxel MD-$$$T_2$$$ values reconstructed on a $$$10X10$$$ grid of subvoxel MD values (horizontal axes) and subvoxel $$$T_2$$$ values (vertical axes).
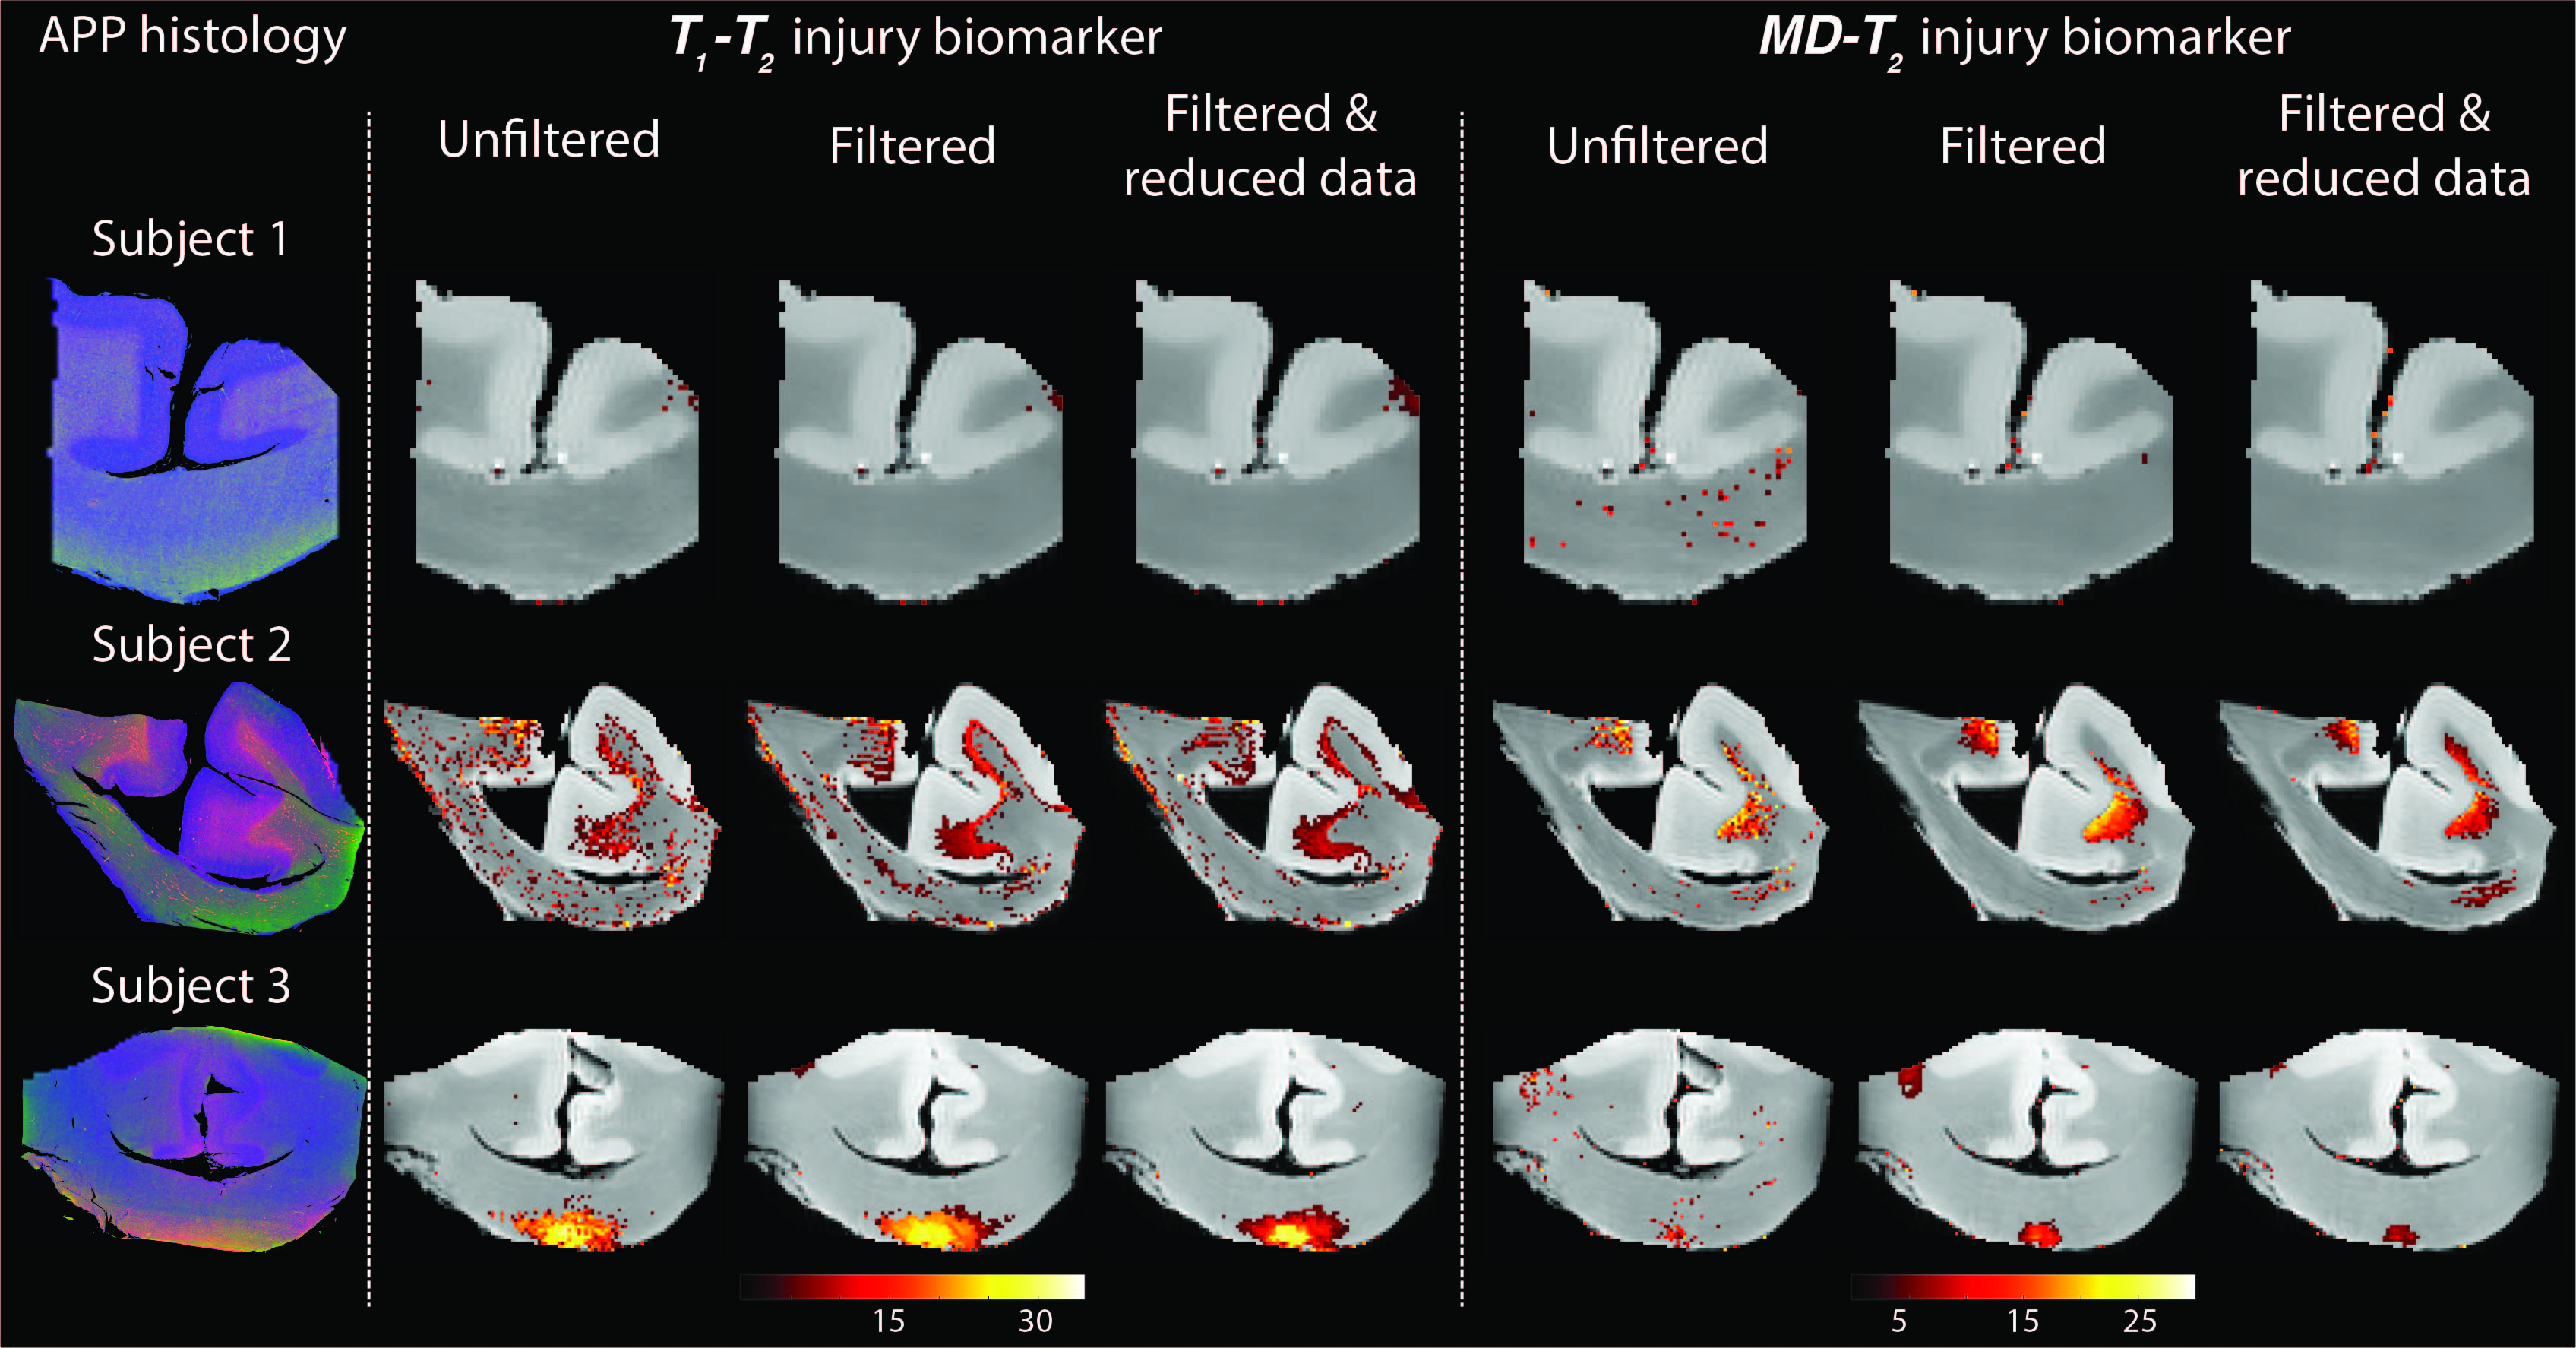
Histological images and multidimensional MR-derived injury biomarker maps under different conditions (left to right: unfiltered, filtered, and filtered & reduced data). Deconvolved histological APP images (co-registered with the MRI) are shown on the left panel, red = APP stain. Injury maps of Subject 1 (control) show absent of significant injury under all experimental conditions. Injury maps of Subjects 2 and 3 (TBI) show substantial injury along the white-gray matter interface and at the bottom of the CC, respectively, under all experimental conditions.