0367
Multi-vendor comparison of three-dimensional multi-parametric mapping of the human brain at 3T: A multi-center study
Shohei Fujita1,2, Borjan Gagoski3,4, Ken-Pin Hwang5, Marcel Warntjes6,7, Akifumi Hagiwara1, Issei Fukunaga1, Wataru Uchida1, Yuma Nishimura1, Tomoya Muroi1, Toshiya Akatsu1, Akihiro Kasahara2, Ryo Sato2, Tsuyoshi Ueyama2, Christina Andica1, Koji Kamagata1, Shiori Amemiya2, Hidemasa Takao2, Osamu Abe2, and Shigeki Aoki1
1Department of Radiology, Juntendo University, Tokyo, Japan, 2Department of Radiology, The University of Tokyo, Tokyo, Japan, 3Fetal Neonatal Neuroimaging and Developmental Science Center, Boston Children's Hospital, Boston, MA, United States, 4Department of Radiology, Harvard Medical School, Boston, MA, United States, 5Department of Imaging Physics, The University of Texas MD Anderson Cancer Center, Houston, TX, United States, 6SyntheticMR, Linköping, Sweden, 7Center for Medical Imaging Science and Visualization (CMIV), Linköping University, Linköping, Sweden
1Department of Radiology, Juntendo University, Tokyo, Japan, 2Department of Radiology, The University of Tokyo, Tokyo, Japan, 3Fetal Neonatal Neuroimaging and Developmental Science Center, Boston Children's Hospital, Boston, MA, United States, 4Department of Radiology, Harvard Medical School, Boston, MA, United States, 5Department of Imaging Physics, The University of Texas MD Anderson Cancer Center, Houston, TX, United States, 6SyntheticMR, Linköping, Sweden, 7Center for Medical Imaging Science and Visualization (CMIV), Linköping University, Linköping, Sweden
Synopsis
Cross-vendor techniques enabling the pooling of data among different vendors is desired in multi-center projects; however, few mapping techniques have shown compatibility. In this study, we examined the intra-scanner repeatability and inter-vendor reproducibility of quantitative measurements obtained via a multi-parametric mapping technique, 3D-QALAS. Volunteers underwent scan-rescan sessions on four different 3T systems from three MRI vendors (GE, Philips, and Siemens). T1, T2, and PD values and brain tissue volumes of healthy volunteers derived from 3D-QALAS were robust across scanners from different vendors (inter-vendor coefficient of variation=3.3%). The data in this study will inform future technical developments for 3D-QALAS.
Introduction
Multi-parametric mapping enables the acquisition of quantitative information about tissue properties that is more objective than qualitative information observed in contrast-weighted images1. These measurements may be pooled for use in clinical trials and to produce imaging biomarkers2. However, without the lack of standardization across vendors, these measurements are only understood in the context of a measurement from the same vendor, making it difficult to increase the size and diversity of the study population. Therefore, a robust, cross-vendor technique is required.Although many promising techniques have been proposed3-5, few technologies have shown compatibility across vendors and have provided reproducible values across MRI systems from different vendors. One cross-vendor multi-parametric technique is 3D-quantification using an interleaved Look–Locker acquisition sequence with a T2 preparation pulse (3D-QALAS), which was originally developed for cardiac applications and later implemented for brain imaging6,7.
This project aimed to develop a standardized protocol for 3D-QALAS and to assess the intra-scanner repeatability and inter-vendor reproducibility of T1, T2, and proton density (PD) values and brain tissue volumes in four different 3T systems from three major MRI vendors (GE, Philips, Siemens).
Methods
Data AcquisitionThis prospective multi-institutional study was approved by the local institutional review board of each institution. Informed written consent was obtained from each subject prior to scanning. Four 3-T scanners manufactured by three vendors were included from the two institutions. The 3D-QALAS imaging parameters were kept as close as possible across vendors, and a minimal acceleration technique was applied in order to make a head-to-head comparison (Table 1). Although the sequence implementation is not identical across vendors, details of the implementation, such as RF pulse, gradient waveforms and pulse timing, are incorporated into the signal model to harmonize the differences. Ten healthy volunteers (6 men and 4 women; mean age ± SD, 28.0 ± 5.6 years) underwent scan-rescan of 3D-QALAS sequence at each scanner. Subjects were removed from the scanner and repositioned before the rescan; each participant underwent imaging on all the scanners within two weeks.
Postprocessing
T1, T2, and PD maps were calculated by performing signal modeling-based parameter fitting on the source images of 3D-QALAS using prototype SyMRI software (21Q4). Tissue fraction maps and volumes, including white matter (WM), gray matter (GM), cerebrospinal fluid (CSF), myelin fraction volume, brain parenchymal volume, and intracranial volume, were also calculated based on the relaxation times8. FreeSurfer9 was used to perform volume-of-interest analysis with the Desikan-Killiany atlas10. The mean T1, T2, and PD values were calculated for each brain structure in cortical, subcortical, and WM structures.
Assessment
The within-subject coefficient of variation (CV) was used to evaluate intra-scanner repeatability (standard deviation [SD] of scan-rescans ÷ mean value obtained with the scanner) and inter-vendor reproducibility (SD of all four ÷ mean value obtained from all scanners). Simple linear regression analyses and Bland-Altman analyses were performed to assess the linearity and bias across scanners (inter-scanner reproducibility). The intraclass correlation coefficient (ICC) was also calculated to assess agreement between scanners.
Results
Representative quantitative maps of a subject are shown in Figure 1.T1, T2, and PD values
The mean intra-scanner CVs of all structures for each scanner ranged from 0.5 to 2.1% (Figure 2A). The structure-wise scan-rescan repeatability is shown in Figure 2B. The overall intra-scanner CVs (mean of the four scanners) were 1.5, 1.0, and 0.6 for T1, T2, and PD, respectively. T1 showed the highest variance compared to the T2 and PD values for all scanners. Overall, high agreement was observed among measurements among the scanners (Figure 3A, ICC = 0.98, 0.91, and 0.92 for T1. T2, and PD, respectively). Scanner A showed slightly biased T1 (mean bias of -0.7%) values compared to those obtained with other scanners (Figure 3B). The structure-wise inter-scanner CV values are illustrated in Figure 3C.
Brain tissue volumes
Representative tissue fraction maps of the subjects are shown in Figure 4A. A correlation coefficient higher than 0.87 was observed among the four scanners (Figure 4B, upper-right triangle). Scanner A showed slightly higher WM and a corresponding lower GM compared to the other scanners (Figure 4B, lower-left triangle).
Discussion
In this study, we examined the intra-scanner repeatability and inter-vendor reproducibility of quantitative measurements obtained with a cross-vendor, whole-brain, multi-parametric mapping technique, 3D-QALAS. For multi-center projects, it is desirable to adopt a technique compatible with multiple vendors to enable pooling of data among different vendors and include as many institutions as possible.Although preliminary and including only healthy volunteers, our results indicate that the measurements obtained with 3D-QALAS are robust across scanners and vendors.Although reference standard imaging (e.g., inversion recovery and spin echo acquisitions) was not feasible in this human study because of unethically long scan times, in vitro phantom measurements compared to those obtained with reference standard imaging will be conducted. Applying vendor-specific advanced acceleration and reconstruction techniques may further make the technique easier to use in clinical settings.
Conclusion
Quantitative values derived from 3D-QALAS were robust for brain relaxometry and volumetry in healthy volunteers across 3-T scanners from three major MRI vendors. The data in this study will inform future technical developments for 3D-QALAS.Acknowledgements
We thank Rina Tachibana for data handling.References
- Seiberlich N, Gulani V, Campbell-Washburn A et al. Quantitative Magnetic Resonance Imaging, Volume 1 – 1st Edition. 2020.
- Smits M. MRI biomarkers in neuro-oncology. Nat Rev Neurol. 2021;17(8):486-500. doi:10.1038/s41582-021-00510-y
- Ma D, Gulani V, Seiberlich N, et al. Magnetic resonance fingerprinting. Nature. 2013;495(7440):187-192. doi:10.1038/nature11971
- Wang F, Dong Z, Reese TG, et al. Echo planar time-resolved imaging (EPTI). Magn Reson Med. 2019;81(6):3599-3615. doi:10.1002/mrm.27673
- Ma S, Nguyen CT, Han F, et al. Three-dimensional simultaneous brain T1 , T2 , and ADC mapping with MR Multitasking. Magn Reson Med. 2020;84(1):72-88. doi:10.1002/mrm.28092
- Kvernby S, Warntjes MJ, Haraldsson H, Carlhäll CJ, Engvall J, Ebbers T. J Cardiovasc Magn Reson. 2014 Dec 20;16:102. Simultaneous three-dimensional myocardial T1 and T2 mapping in one breath hold with 3D-QALAS.
- Fujita S, Hagiwara A, Hori M, et al. Three-dimensional high-resolution simultaneous quantitative mapping of the whole brain with 3D-QALAS: An accuracy and repeatability study. Magn Reson Imaging. 2019;63:235-243.
- West J, Warntjes JB, Lundberg P. Novel whole brain segmentation and volume estimation using quantitative MRI. Eur Radiol. 2012;22(5):998-1007. doi:10.1007/s00330-011-2336-7
- Fischl B. FreeSurfer. Neuroimage 2012;62:774–781
- Desikan RS, Segonne F, Fischl B, et al. An automated labeling system for subdividing the human cerebral cortex on MRI scans into gyral based regions of interest. Neuroimage 2006;31:968–980.
Figures
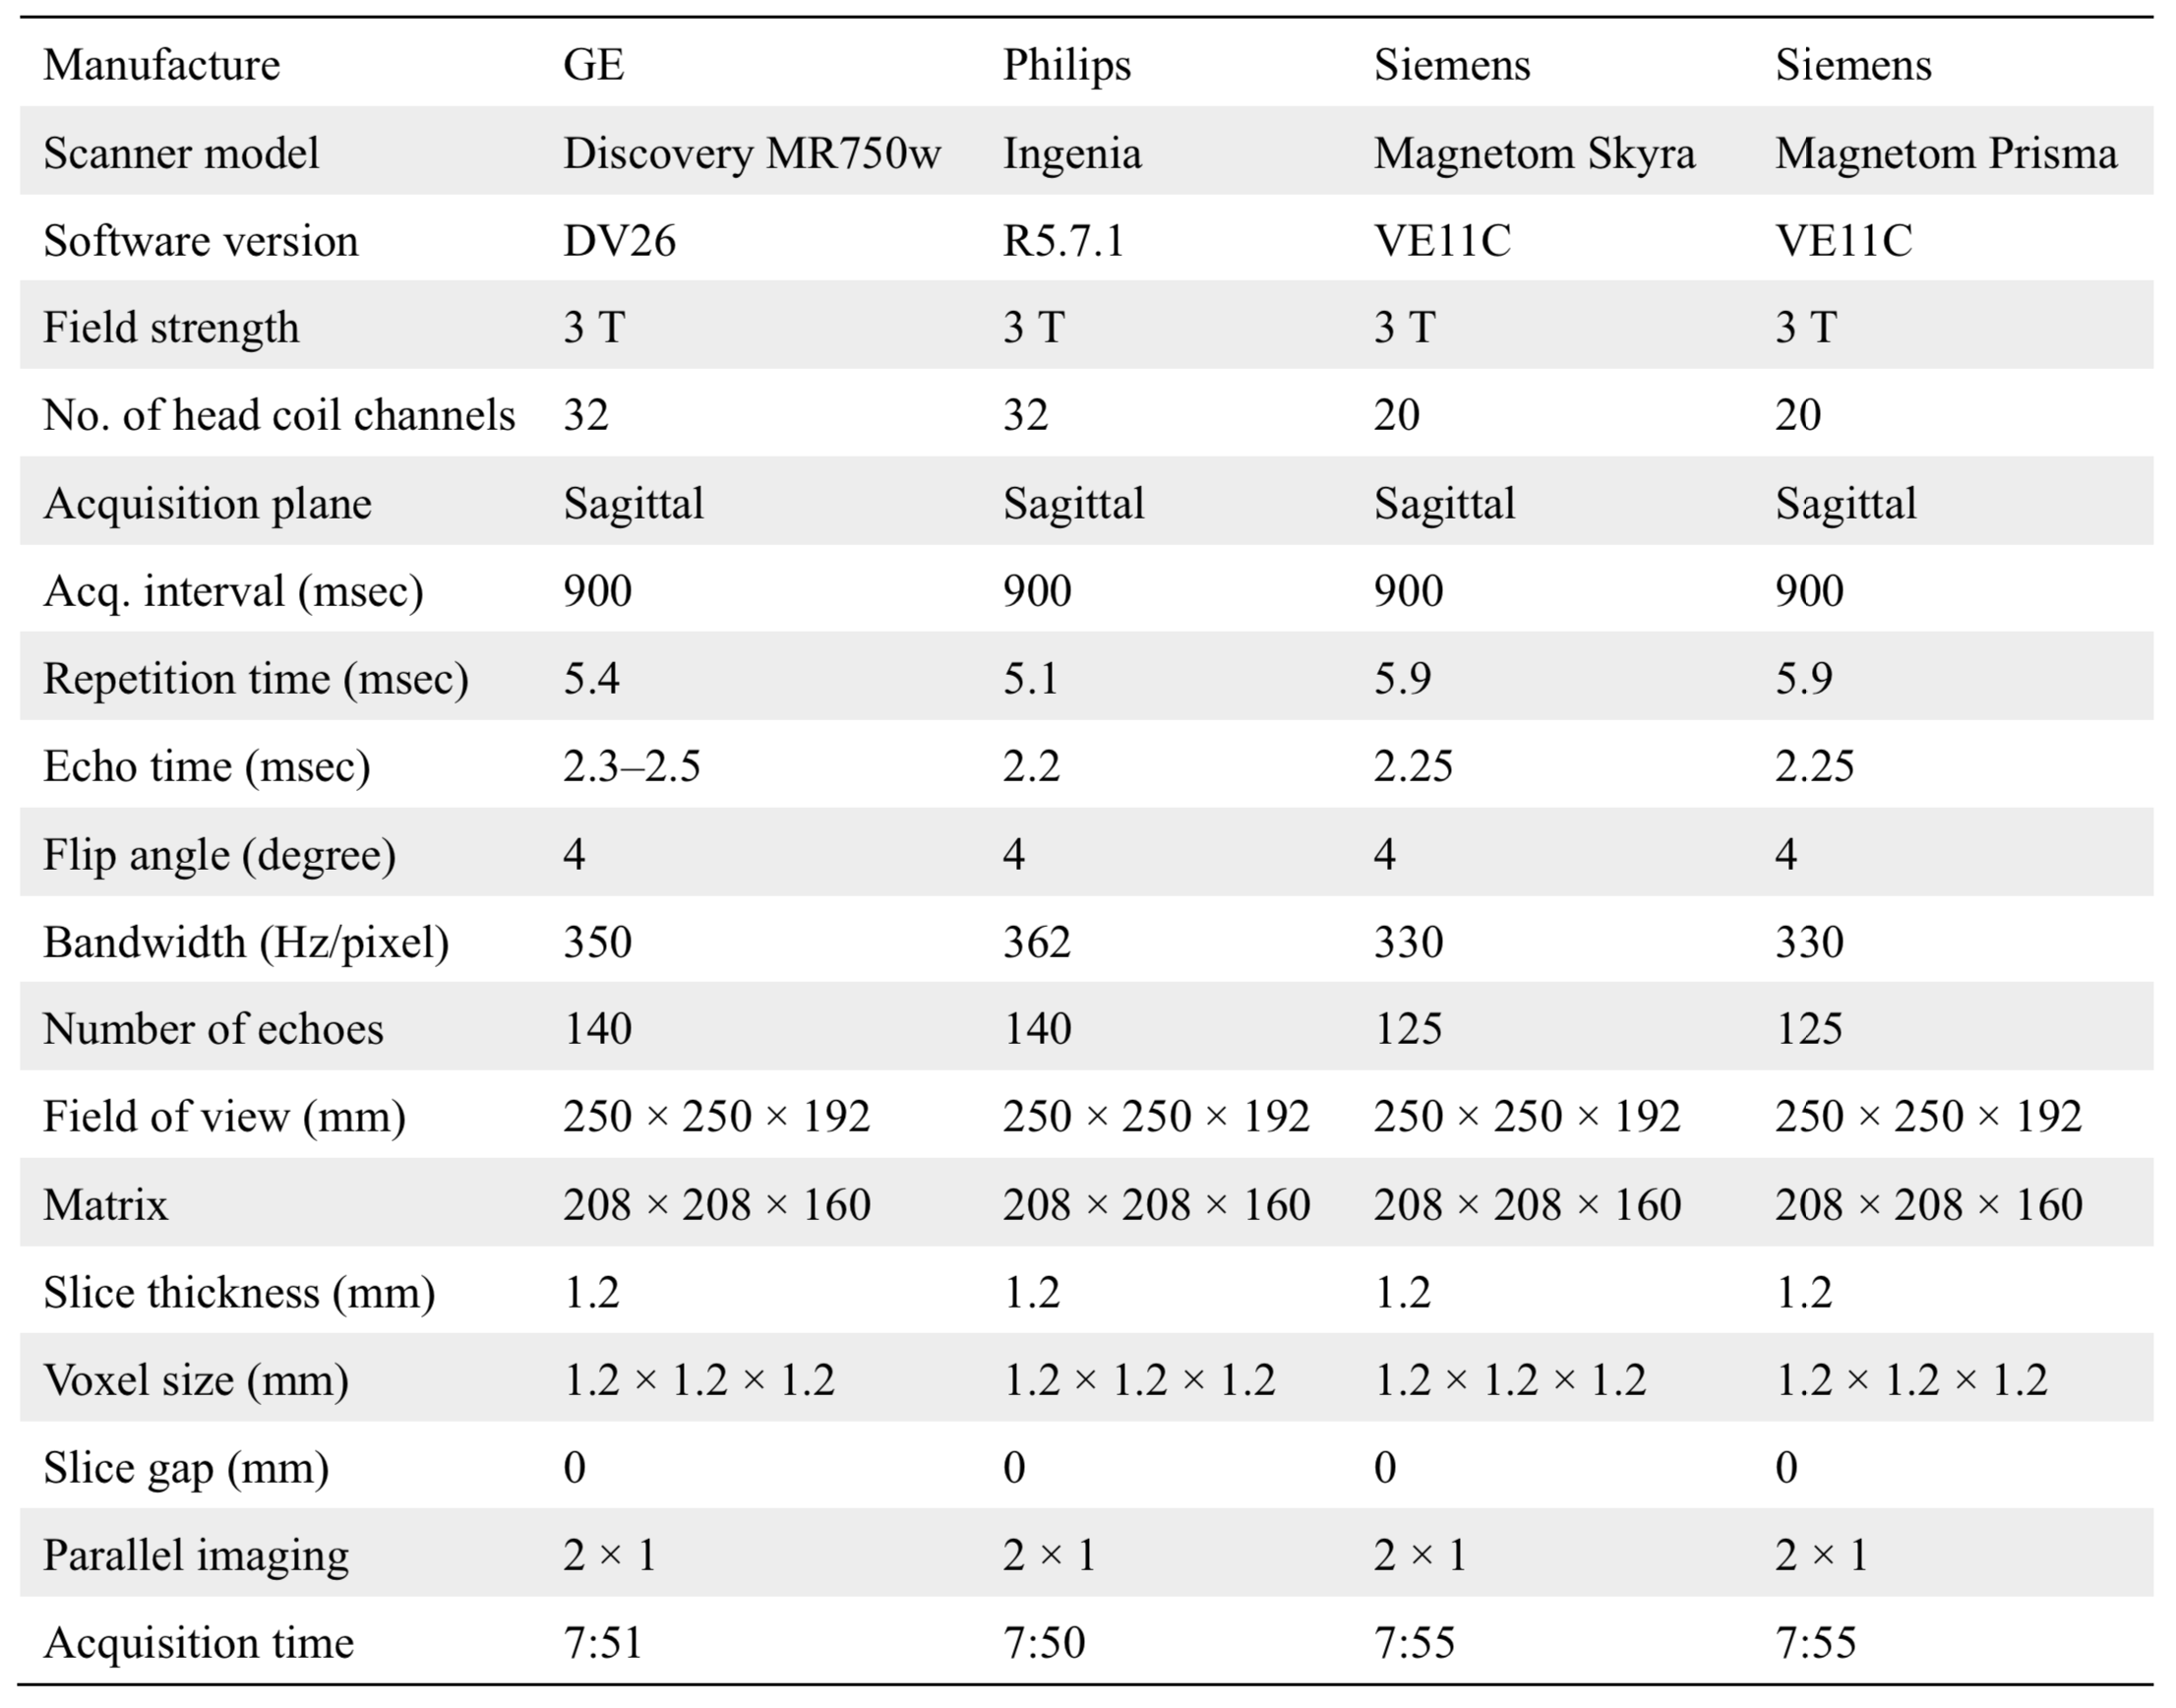
Table 1. 3D-QALAS sequence parameters. 3D-QALAS, 3D-quantification using an interleaved Look–Locker acquisition sequence with a T2 preparation pulse.
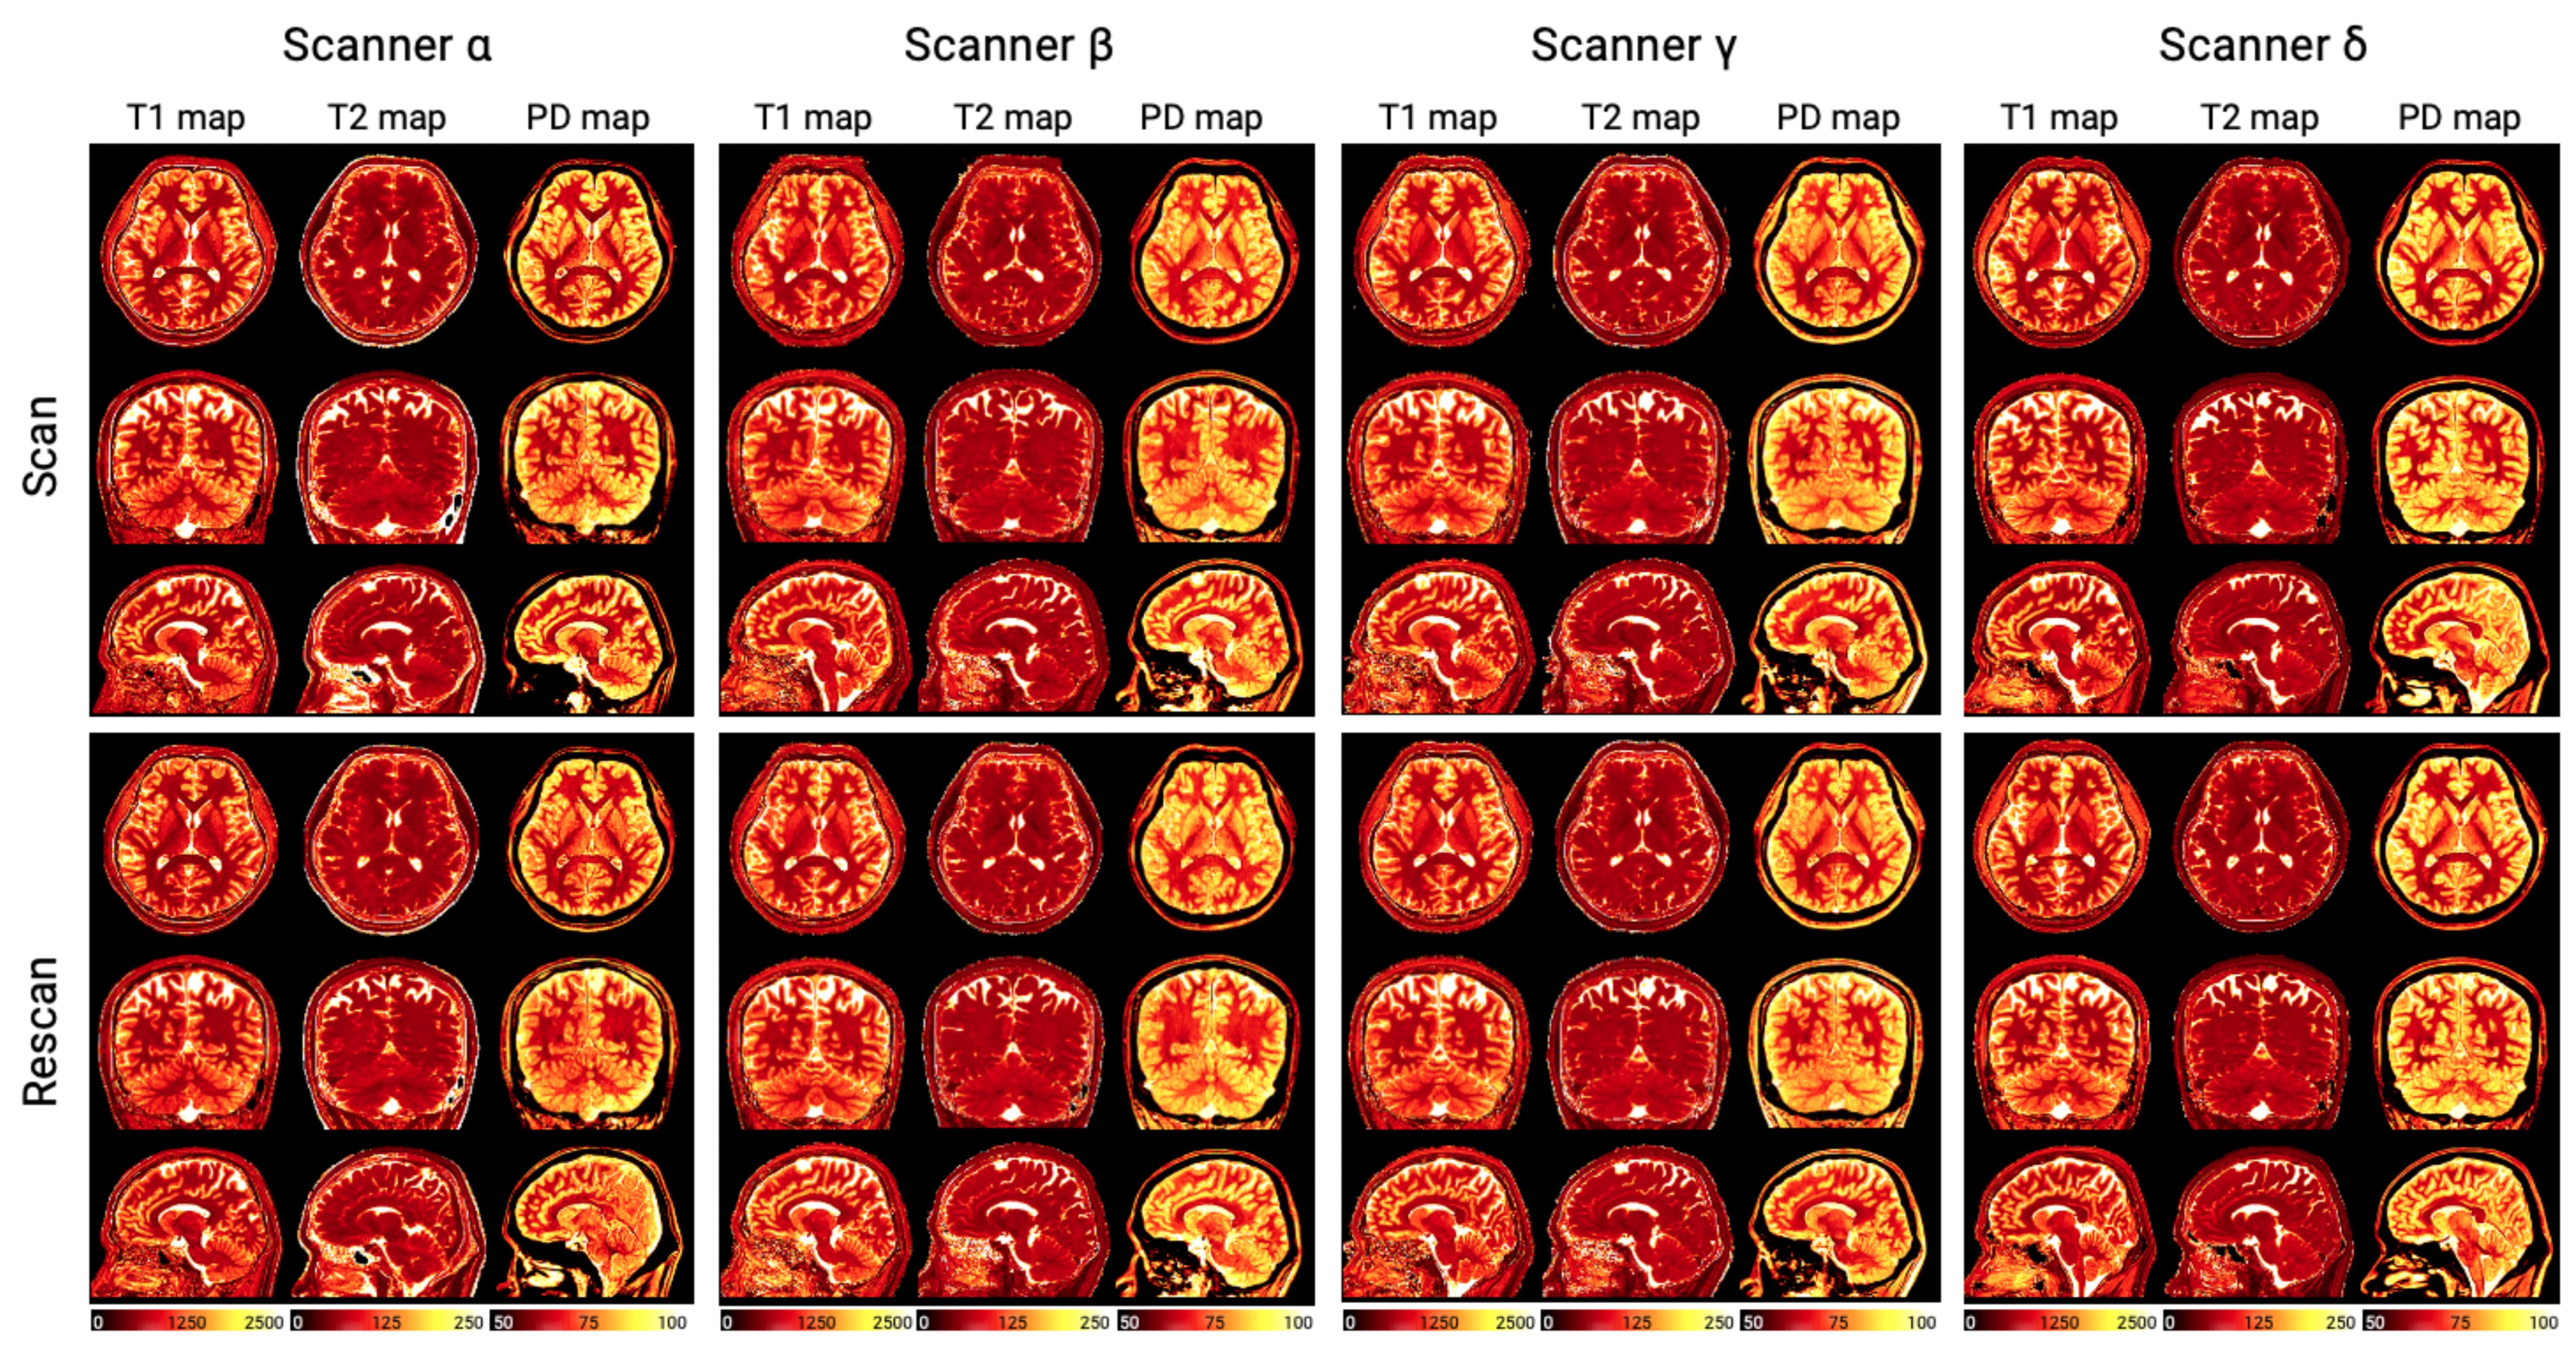
Figure 1. Representative T1, T2, and proton density (PD) maps from one subject. Isotropic 3D-QALAS acquisition was performed in the sagittal plane. Each subject had a scan-rescan session on four 3T MRI scanners from three vendors (i.e. GE, Philips, and Siemens). Subjects were repositioned between scan and rescan. The rescan maps were aligned to the 1st scan for visualization.
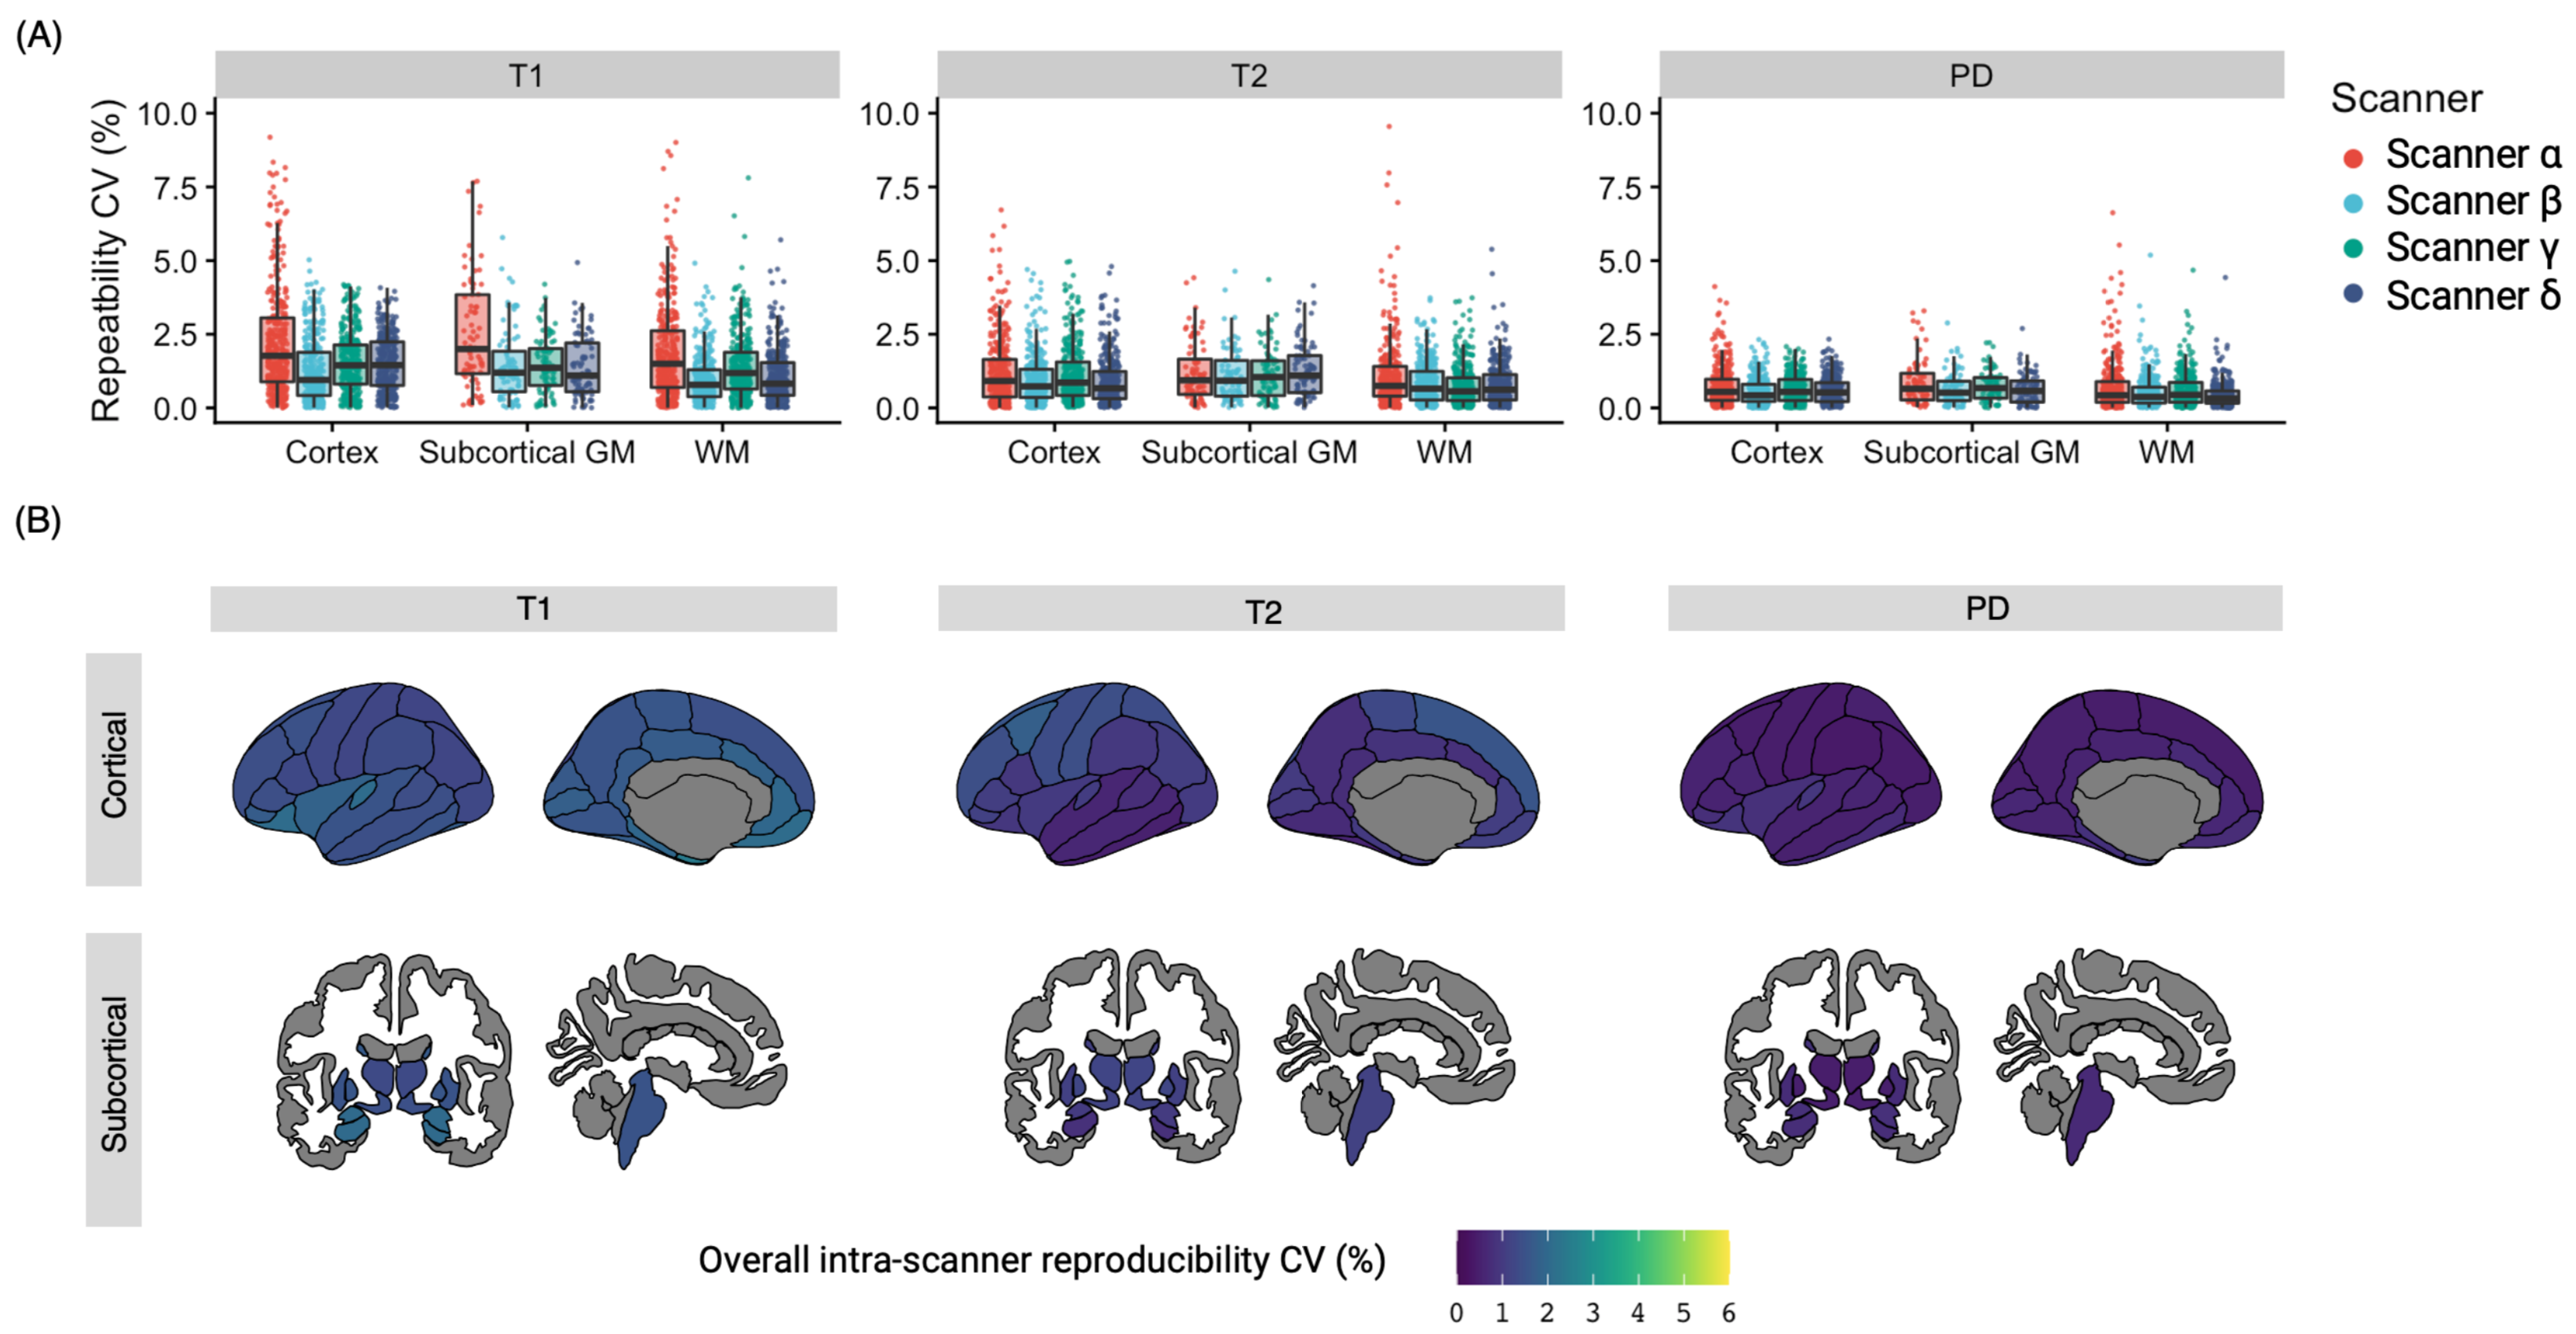
Figure 2. Intra-scanner repeatability. (A) Boxplot showing structure-wise coefficient of variation (CV) for each scanner. Each dot represents a brain region on Desikan-Killiany atlas. (B) For each brain structure, mean intra-scanner CV value of the four scanners was calculated and displayed on schematic brains.
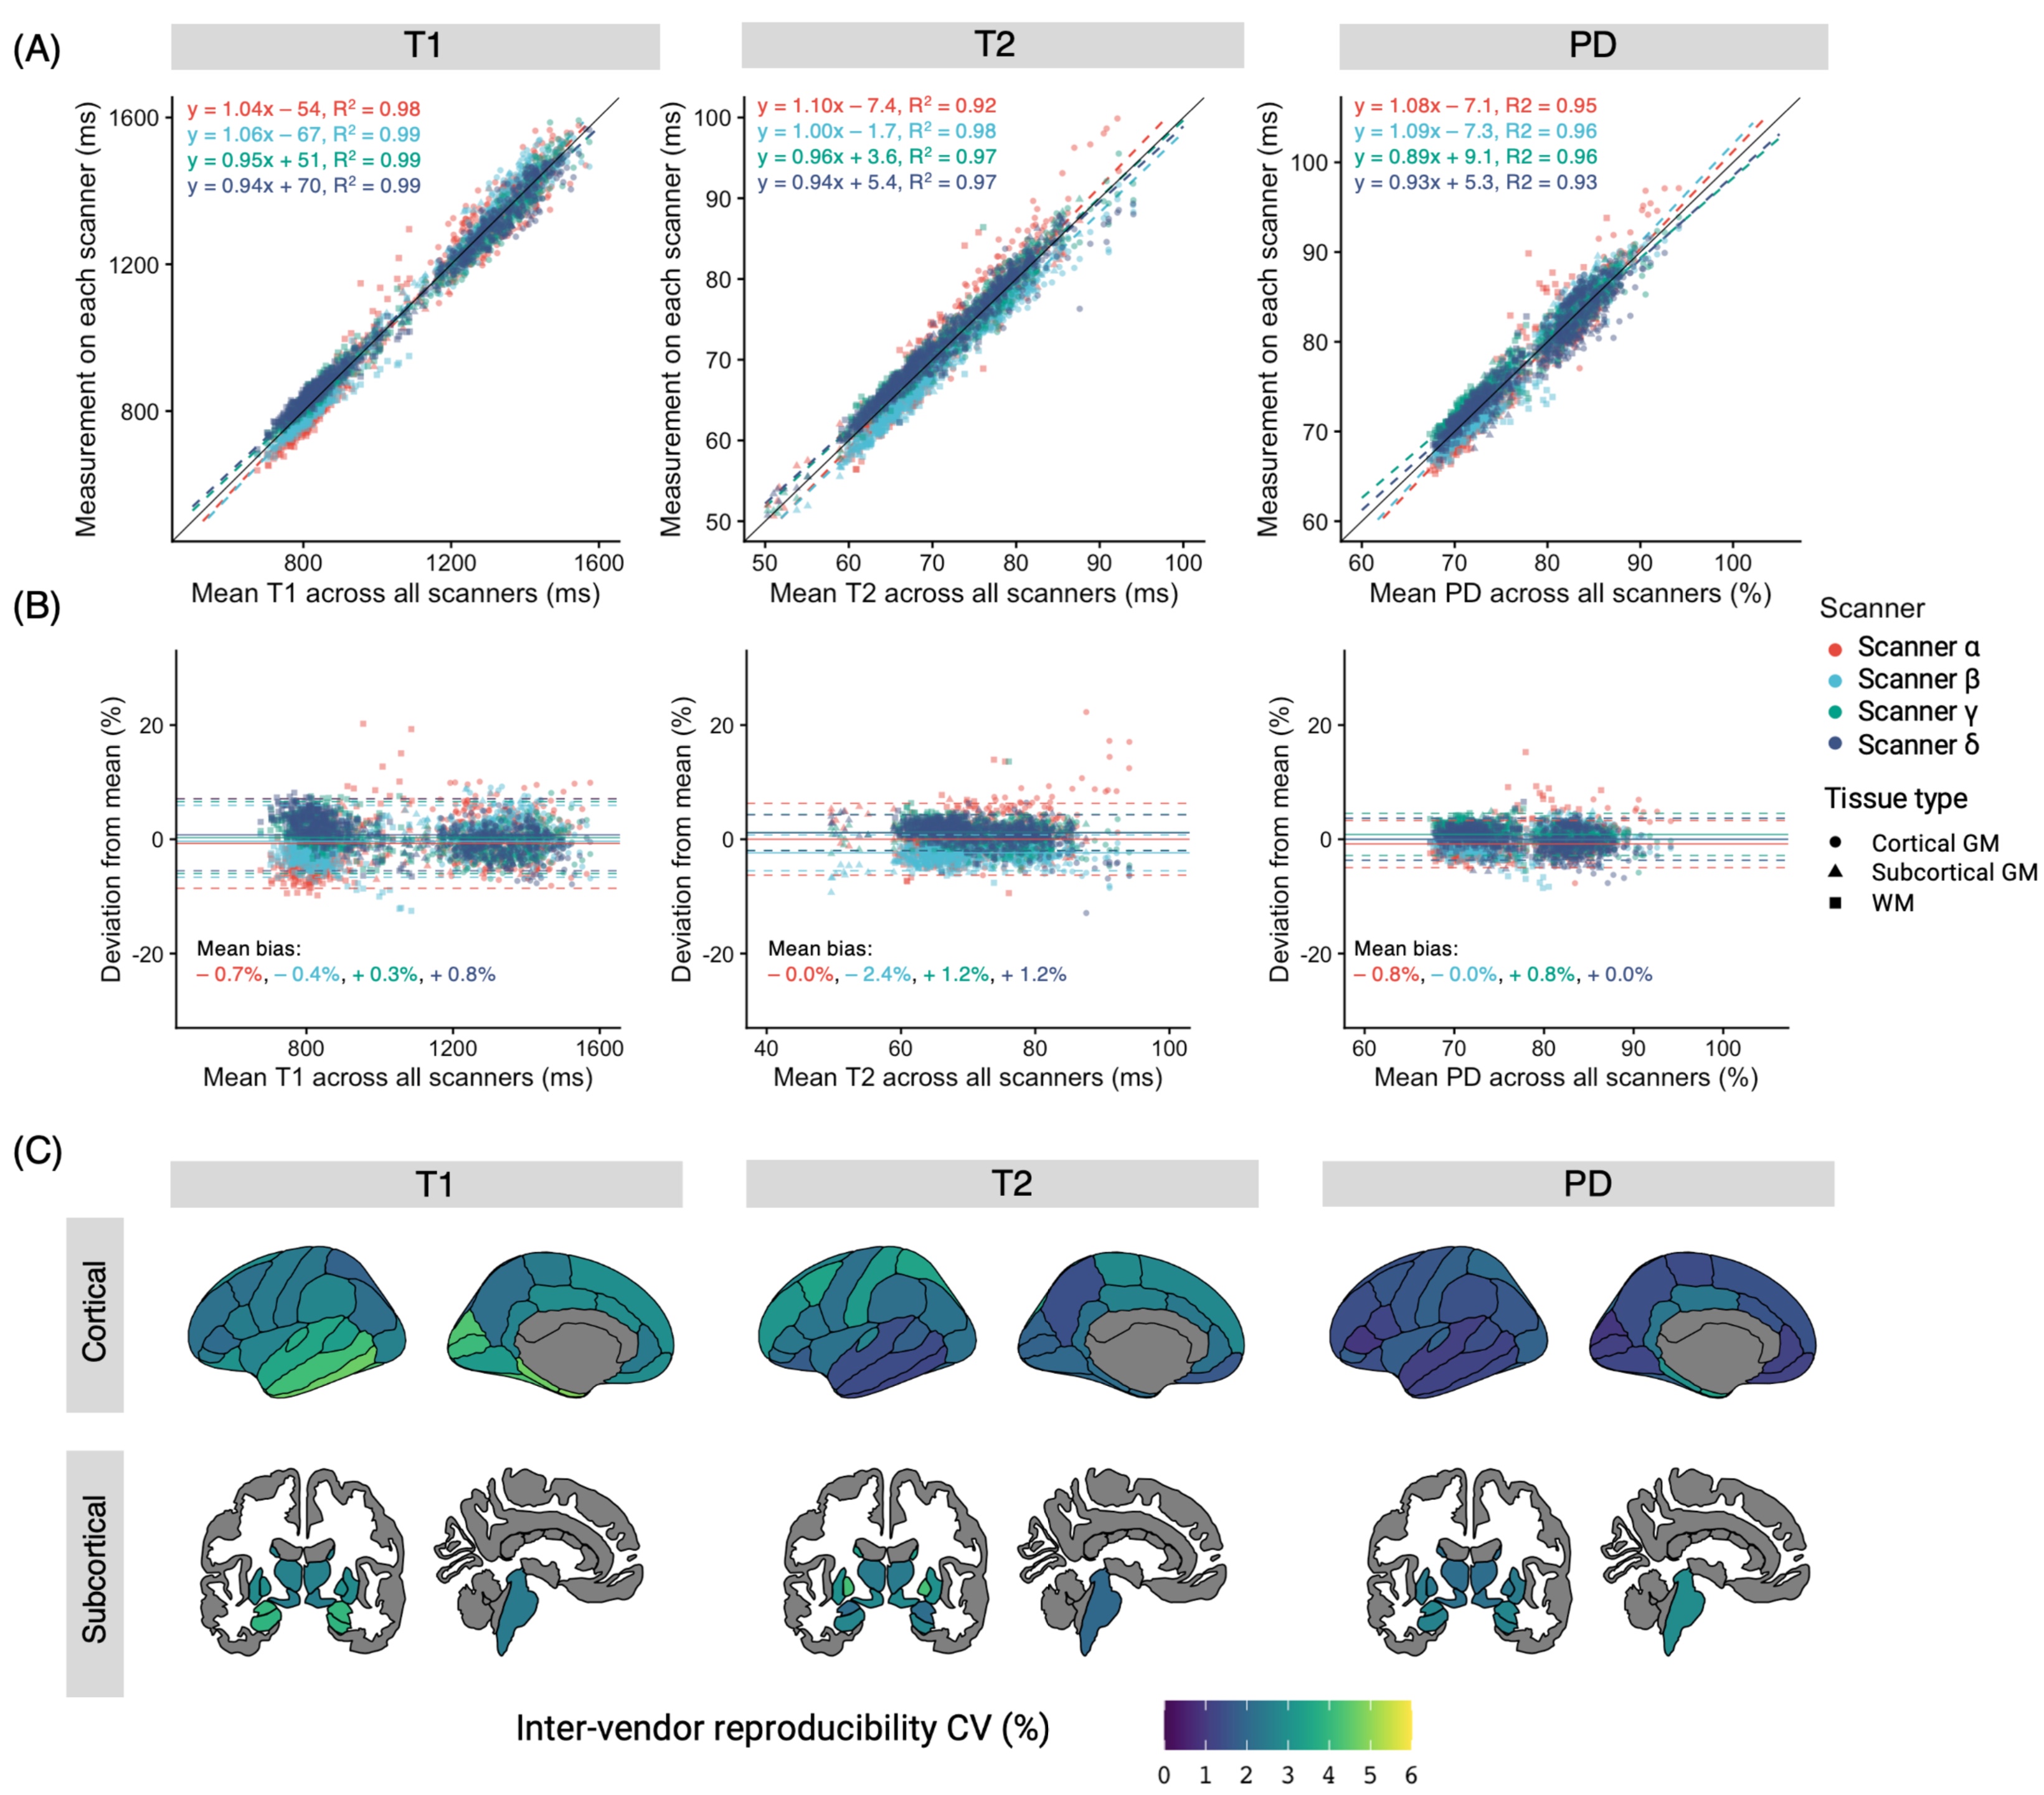
Figure 3. Inter-scanner reproducibility. (A) Scatter plots and Bland-Altman plots showing inter-scanner agreement. Each dot represents a brain region on Desikan-Killiany atlas. The solid line is the identity line. (B) Bland–Altman plot of T1, T2, PD values showing inter scanner biases. The T1 showed the highest biases. (C) Inter-scanner CVs. CV value was calculated for each structure using the 1st scan from all four scanners (standard deviation of the four scans divided by the mean of four scans).
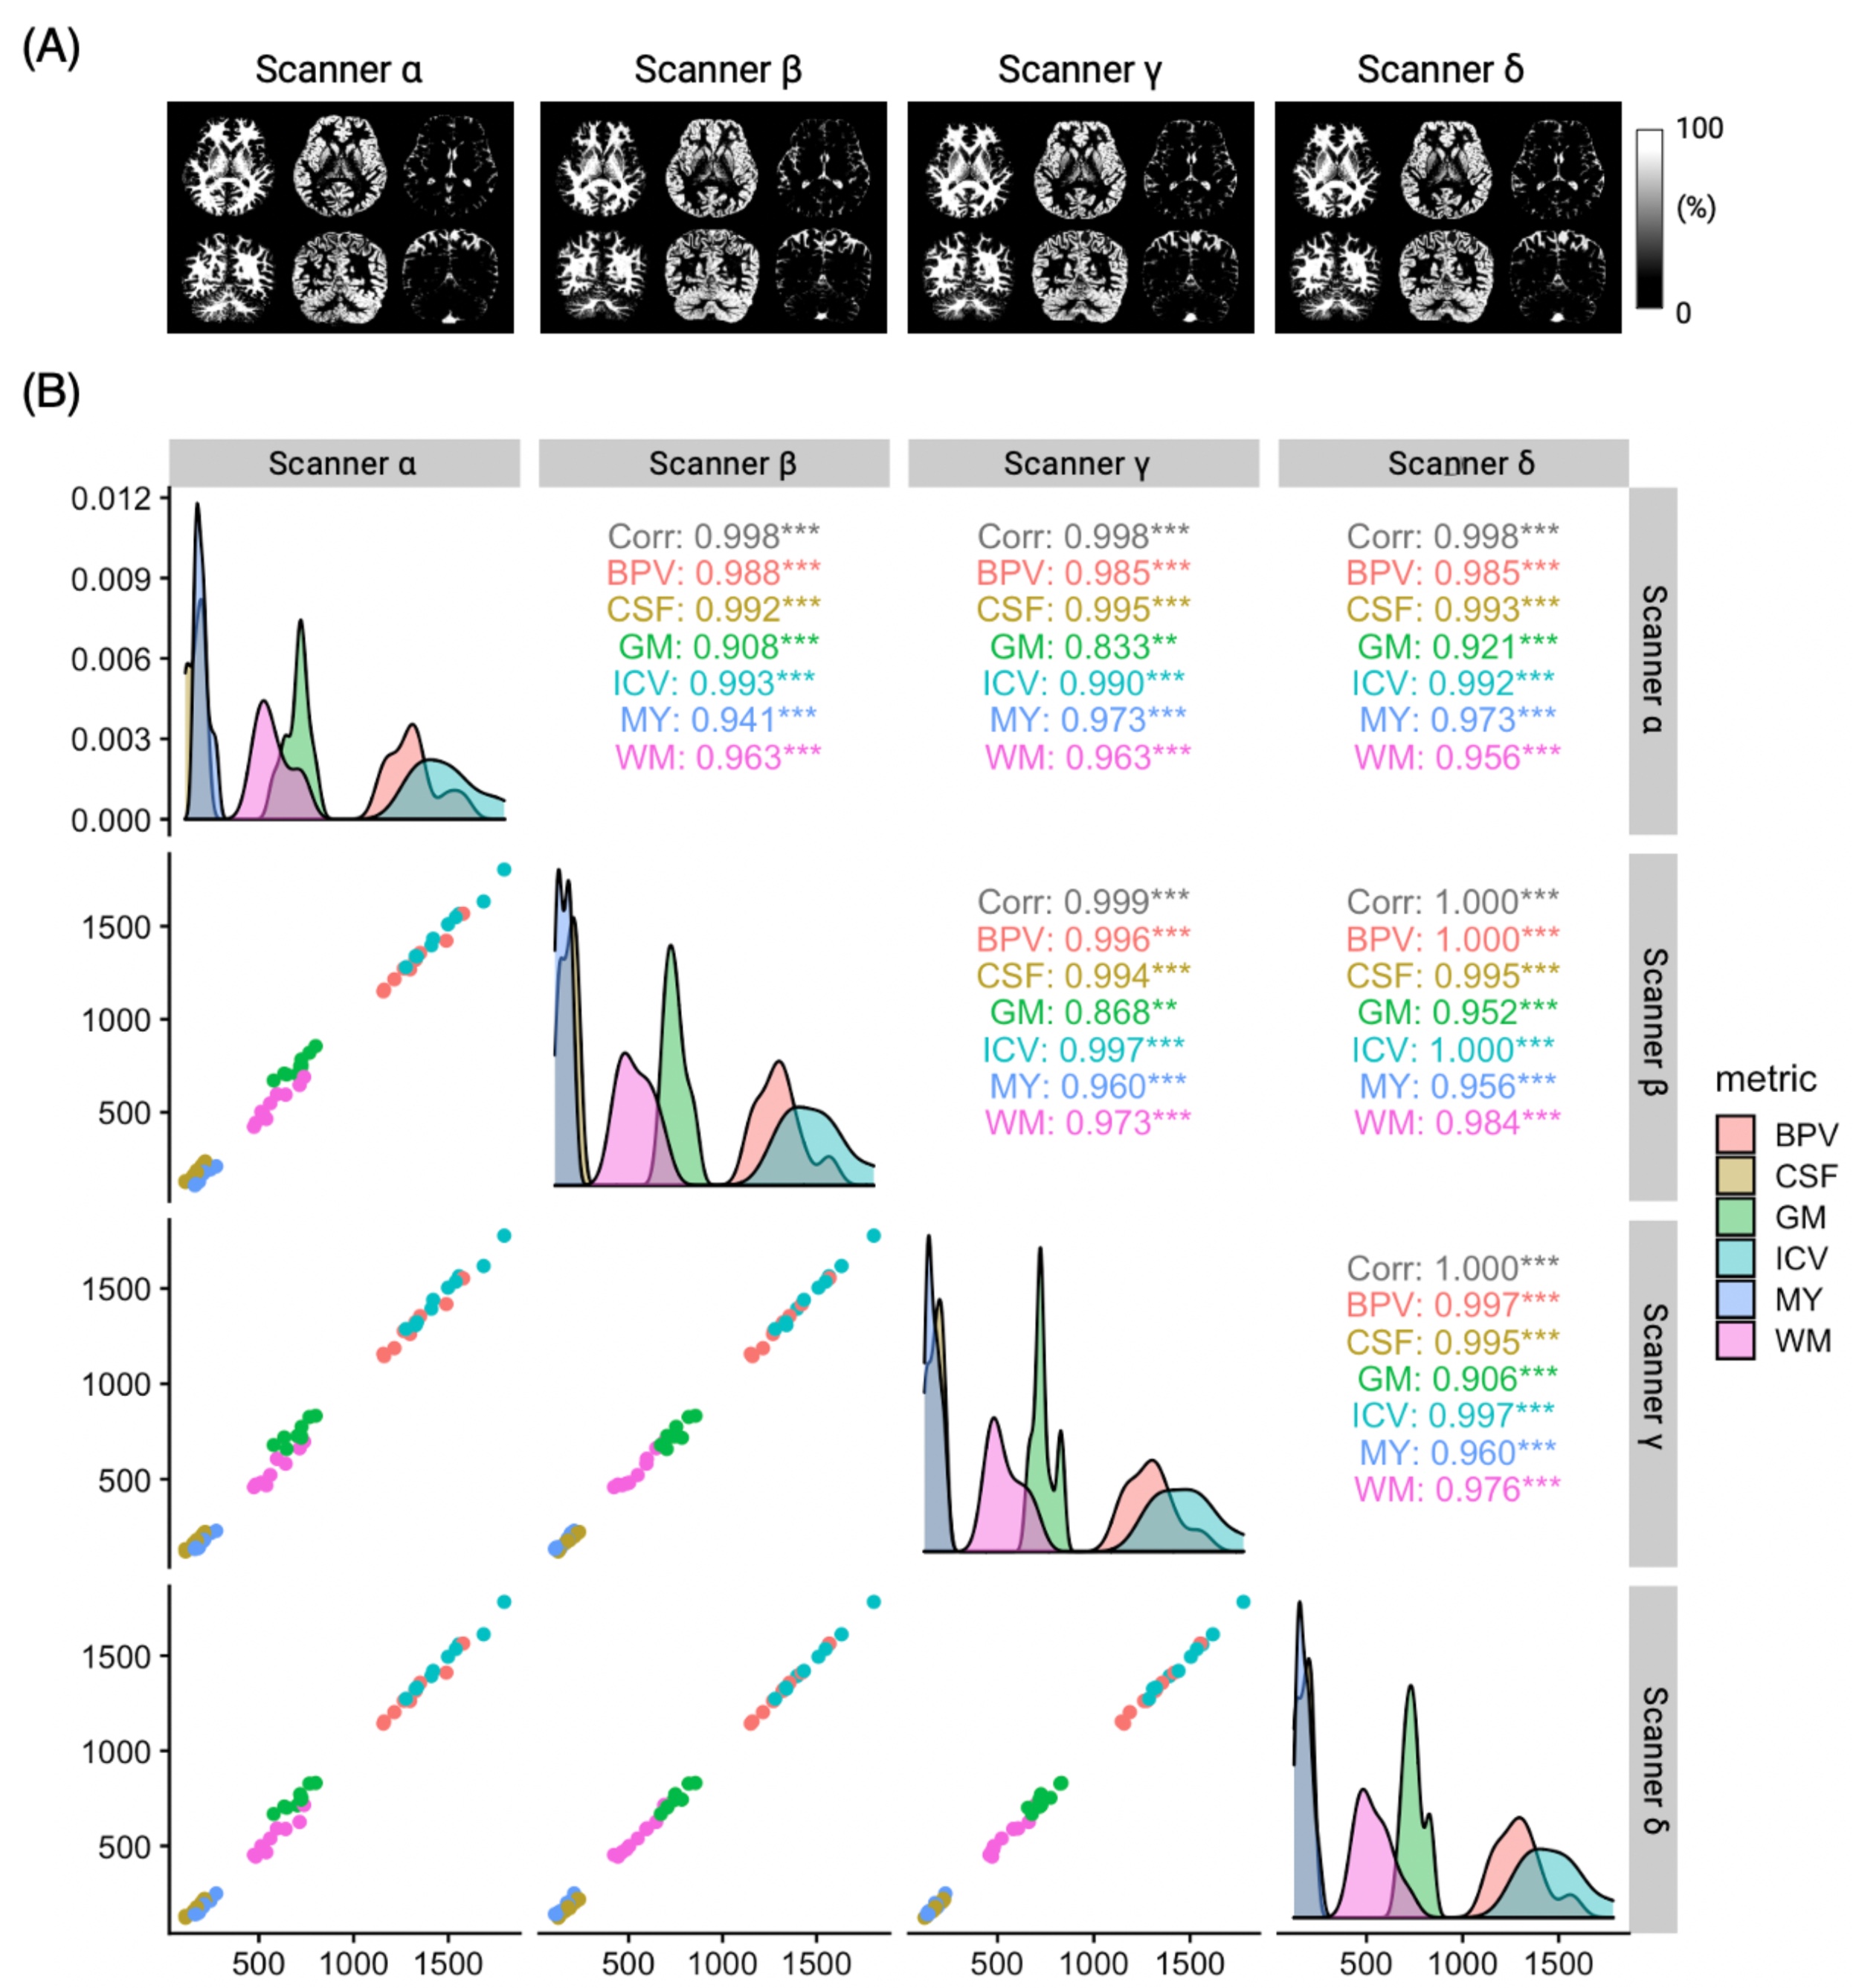
Figure 4. Correlation plot of brain tissue volumes. (A) Representative tissue fraction maps. (B) The agreement of tissue volumes between each pair of scanners. The upper-right triangle shows the correlation coefficients for each tissue type between scanners. The lower-left triangle shows the subject-wise tissue volume scatter plots. Density curves on the diagonal show the relative distribution of each scanner. MY, myelin volume; BPV, brain parenchymal volume; ICV, intracranial volume. Significance code: 0 ‘***’ 0.001 ‘**’.
DOI: https://doi.org/10.58530/2022/0367