0366
Multicenter reproducibility of quantitative MRI using vendor-neutral sequences (VENUS)1NeuroPoly Lab, Polytechnique Montreal, Montreal, QC, Canada, 2Montreal Heart Institute, Montreal, QC, Canada, 3Unité de Neuroimagerie Fonctionnelle (UNF), Centre de recherche de l’Institut Universitaire de Gériatrie de Montréal (CRIUGM), Montreal, QC, Canada
Synopsis
Vendor-native implementations can lead to unaccounted variance in quantitative MRI (qMRI). The purpose of this study is to show that fully transparent qMRI workflows coupled with VEndor-NeUtral Sequences (VENUS) improve multicenter reproducibility of quantitative MRI maps across three scanners by two vendors, in phantoms and in-vivo. We developed and deployed a vendor-neutral 3D spoiled gradient-echo (SPGR) sequence on three commercial scanners and showed that vendor-neutral qMRI maps of T1, MTR and MTsat outperform their vendor-native counterparts in terms of reproducibility.
Introduction
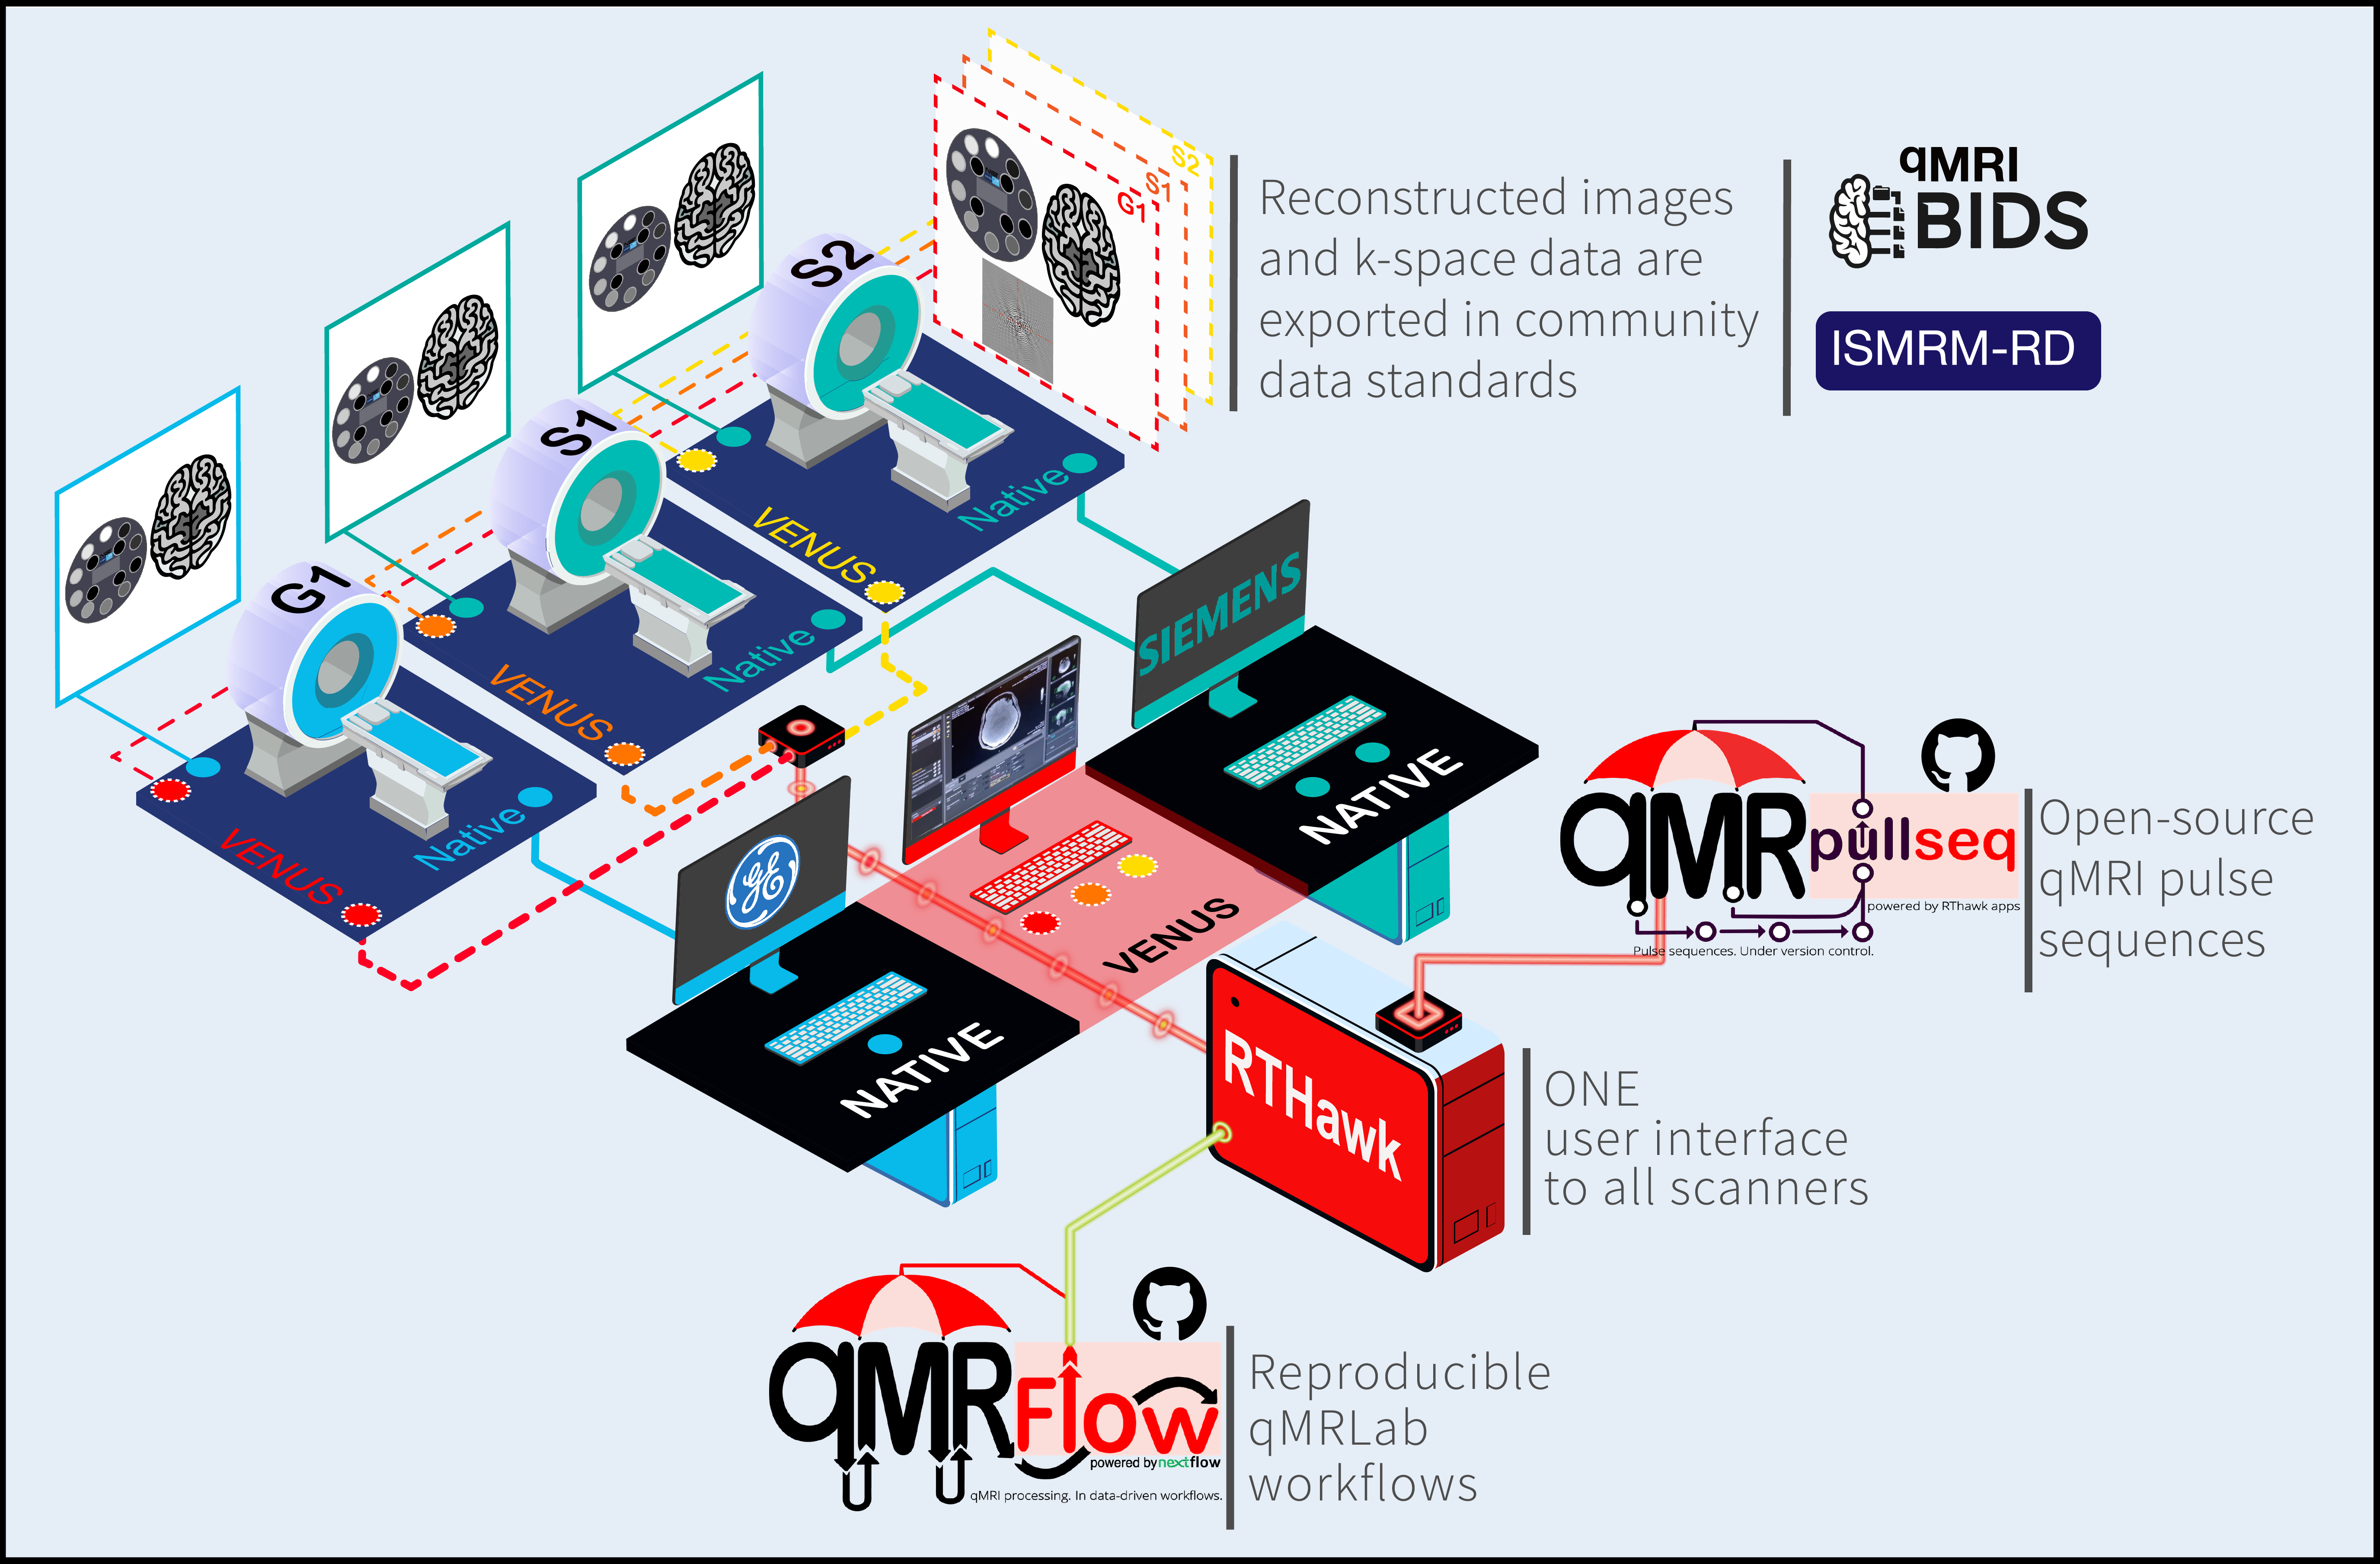
Quantitative MRI (qMRI) has the potential to revolutionize imaging by standardizing the data that come out the scanner and assigning units to help with interpretation. However, qMRI is plagued by reproducibility problems arising from variability across scanners and vendor-native pulse sequence implementations. In-vivo, this problem recurs in nearly all fields of qMRI, from relaxometry1 and diffusion imaging2 to magnetization transfer3 (MT). Unifying pulse sequence implementations between scanners4 and across vendors1 shows potential for improving reproducibility. However, what is currently missing is a vendor-neutral approach5-10 to this problem.In this work, we first develop a vendor-neutral and open-source application for T1, MTR, MTsat mapping11 using a RTHawk12 real-time imaging platform. The developed sequence can be run on most GE and Siemens scanners through the same control interface. Through this interface, users can prescribe customized file naming entities for exporting reconstructed images in brain imaging data structure (BIDS)13 and k-space data in ISMRM-RD14 format. Sequence parameters (e.g., timing, geometry and MT pulse type) can be changed without re-installing the sequence, whereas the application automatically handles the equalization of calibration measurements between MTsat acquisitions.
Using this VEndor-Neutral Sequence (VENUS), we run a multicenter experiment across three different scanner models from two manufacturers at 3T. Vendor-native counterparts of VENUS data were also acquired on each scanner to compare their multicenter reproducibility in system phantom and in-vivo.
Methods
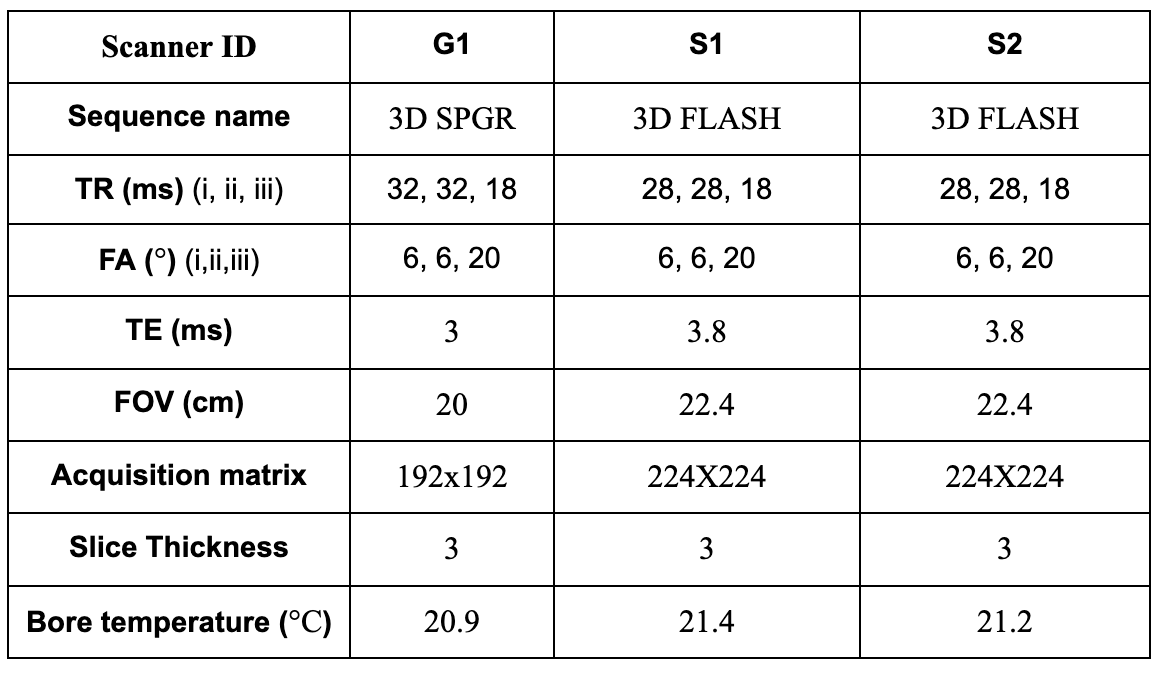
We implemented the protocol described above on three clinical scanners: GE 750w (G1), Siemens Prisma (S1) and Siemens Skyra (S2) 3T. A Fermi MT pulse (duration=12ms, B1rms=3.64uT, offset=1.2KHz, transition-width=0.35, max-B1=5uT) was designed in RTHawk to equip our previous sequence15 for MTsat acquisition. Following the ethics committee approval and written informed consent, one participant volunteered for multi-center data collection. The participant and system phantom were scanned using vendor-native and VENUS protocols on all scanners (Fig-1).We performed three VENUS acquisitions: (PDw) SPGR with no MT, FA = 6 and TR = 28ms (MTw) SPGR with MT, FA = 6 and TR = 28ms (T1w) SPGR without MT, FA = 20° and TR = 18ms. For all VENUS acquisitions TE=3ms, acquisition-matrix=240x240, FOV=24 and slice-thickness=3mm. Vendor-native protocols for these acquisitions are summarized in Figure-2.
From image combinations of PDw-T1w, PDw-MTw and PDw-MTw-PDw, we computed a T1, MTR and MTsat map, respectively. The processing was performed using data-driven and containerized qMRLab pipelines15, available at https://github.com/qMRLab/venus.
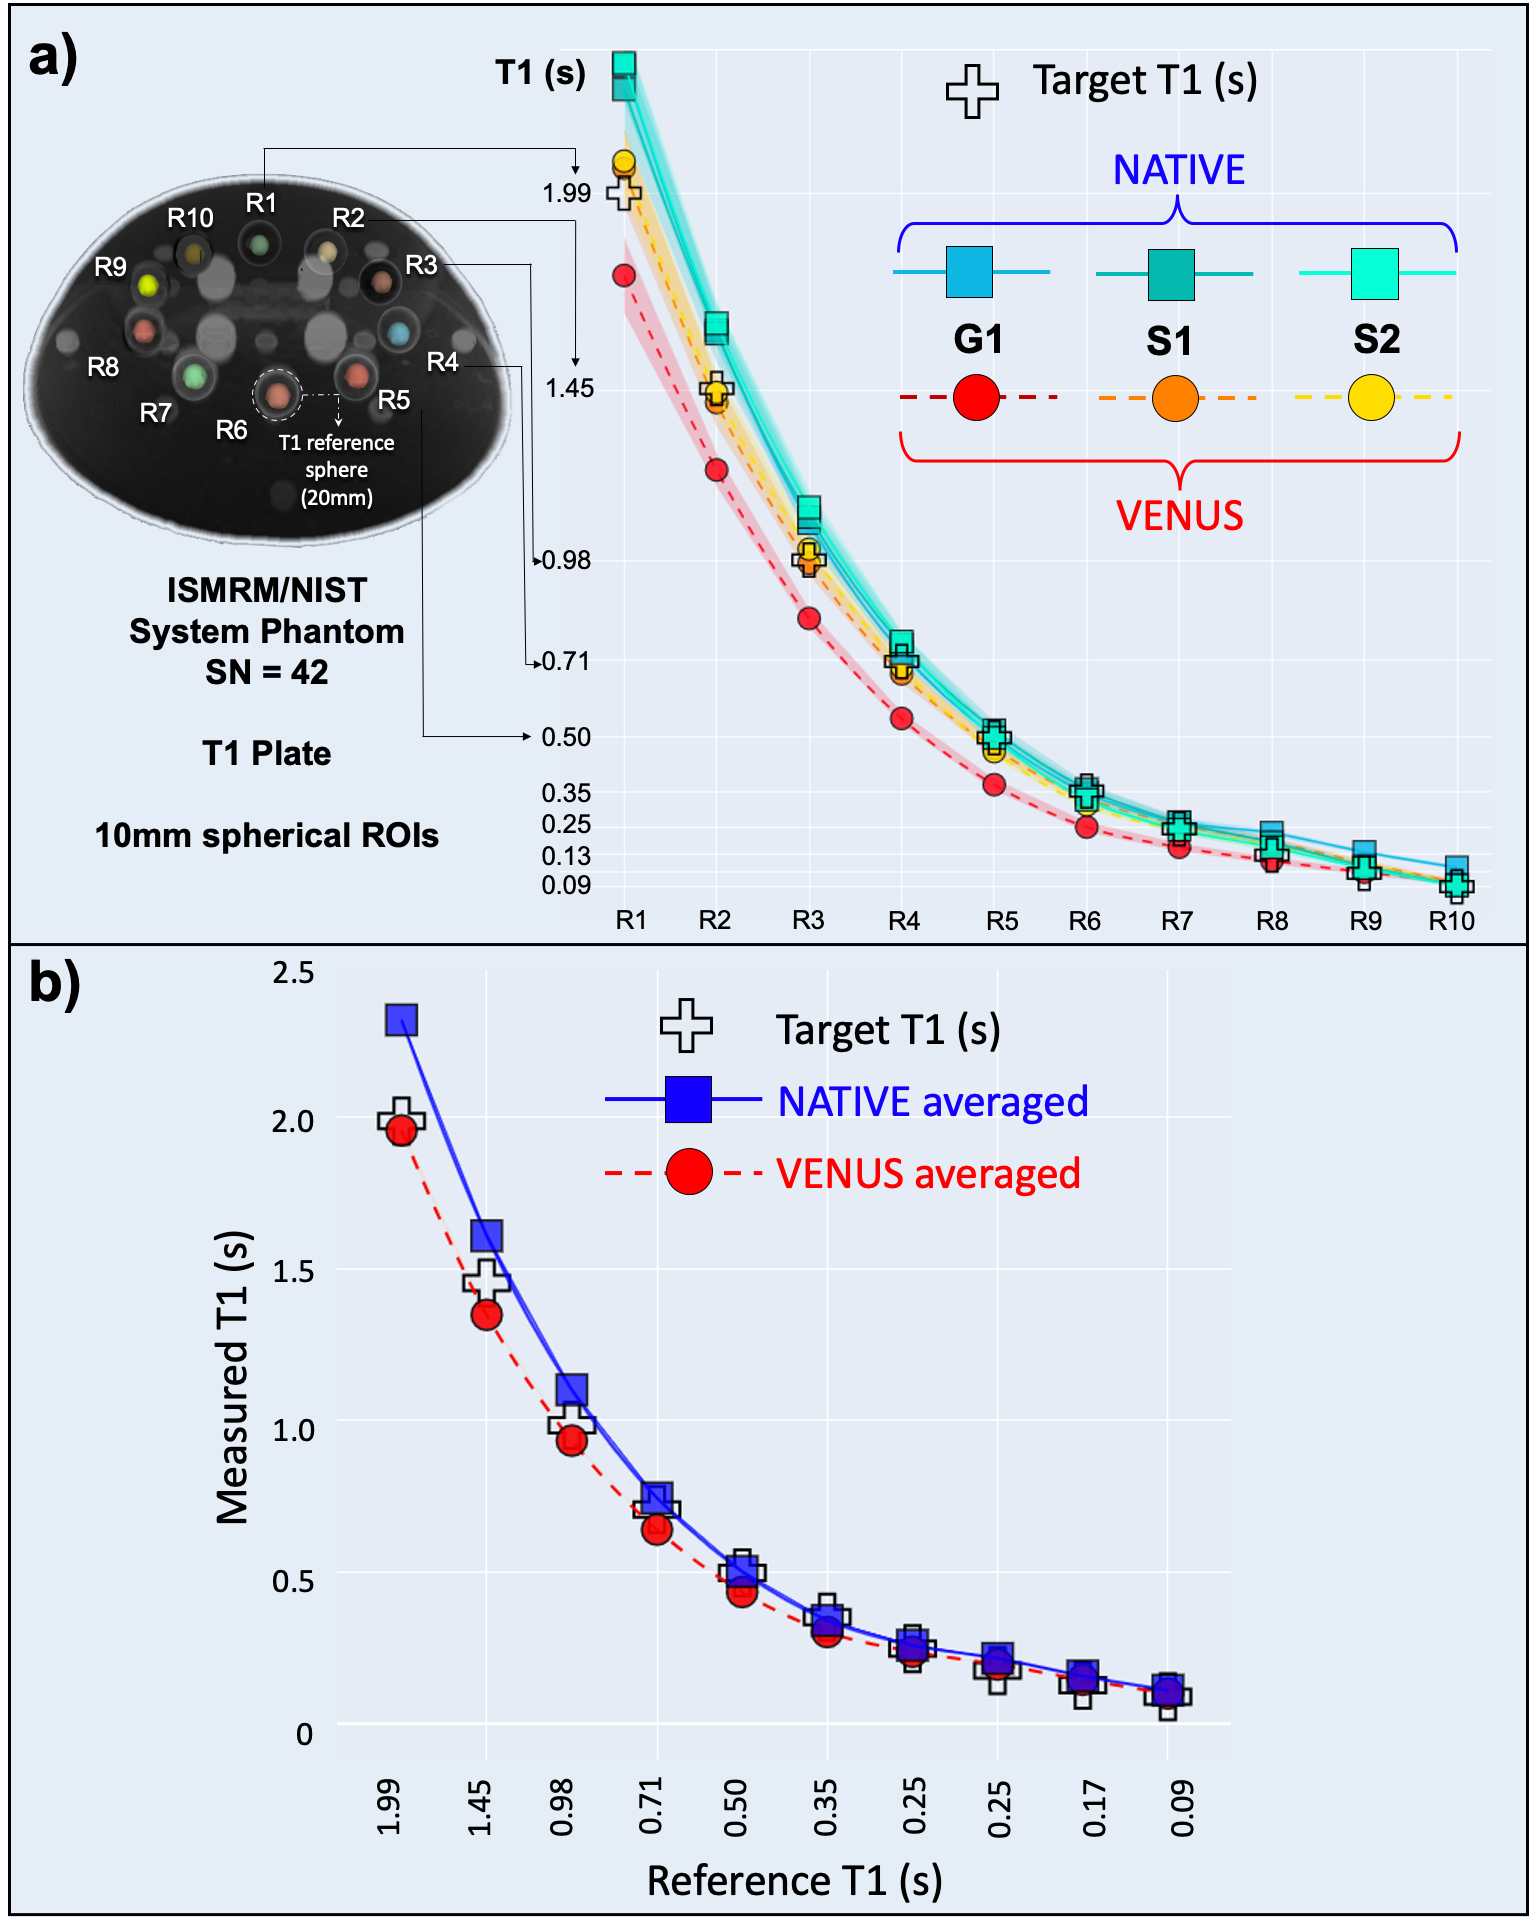
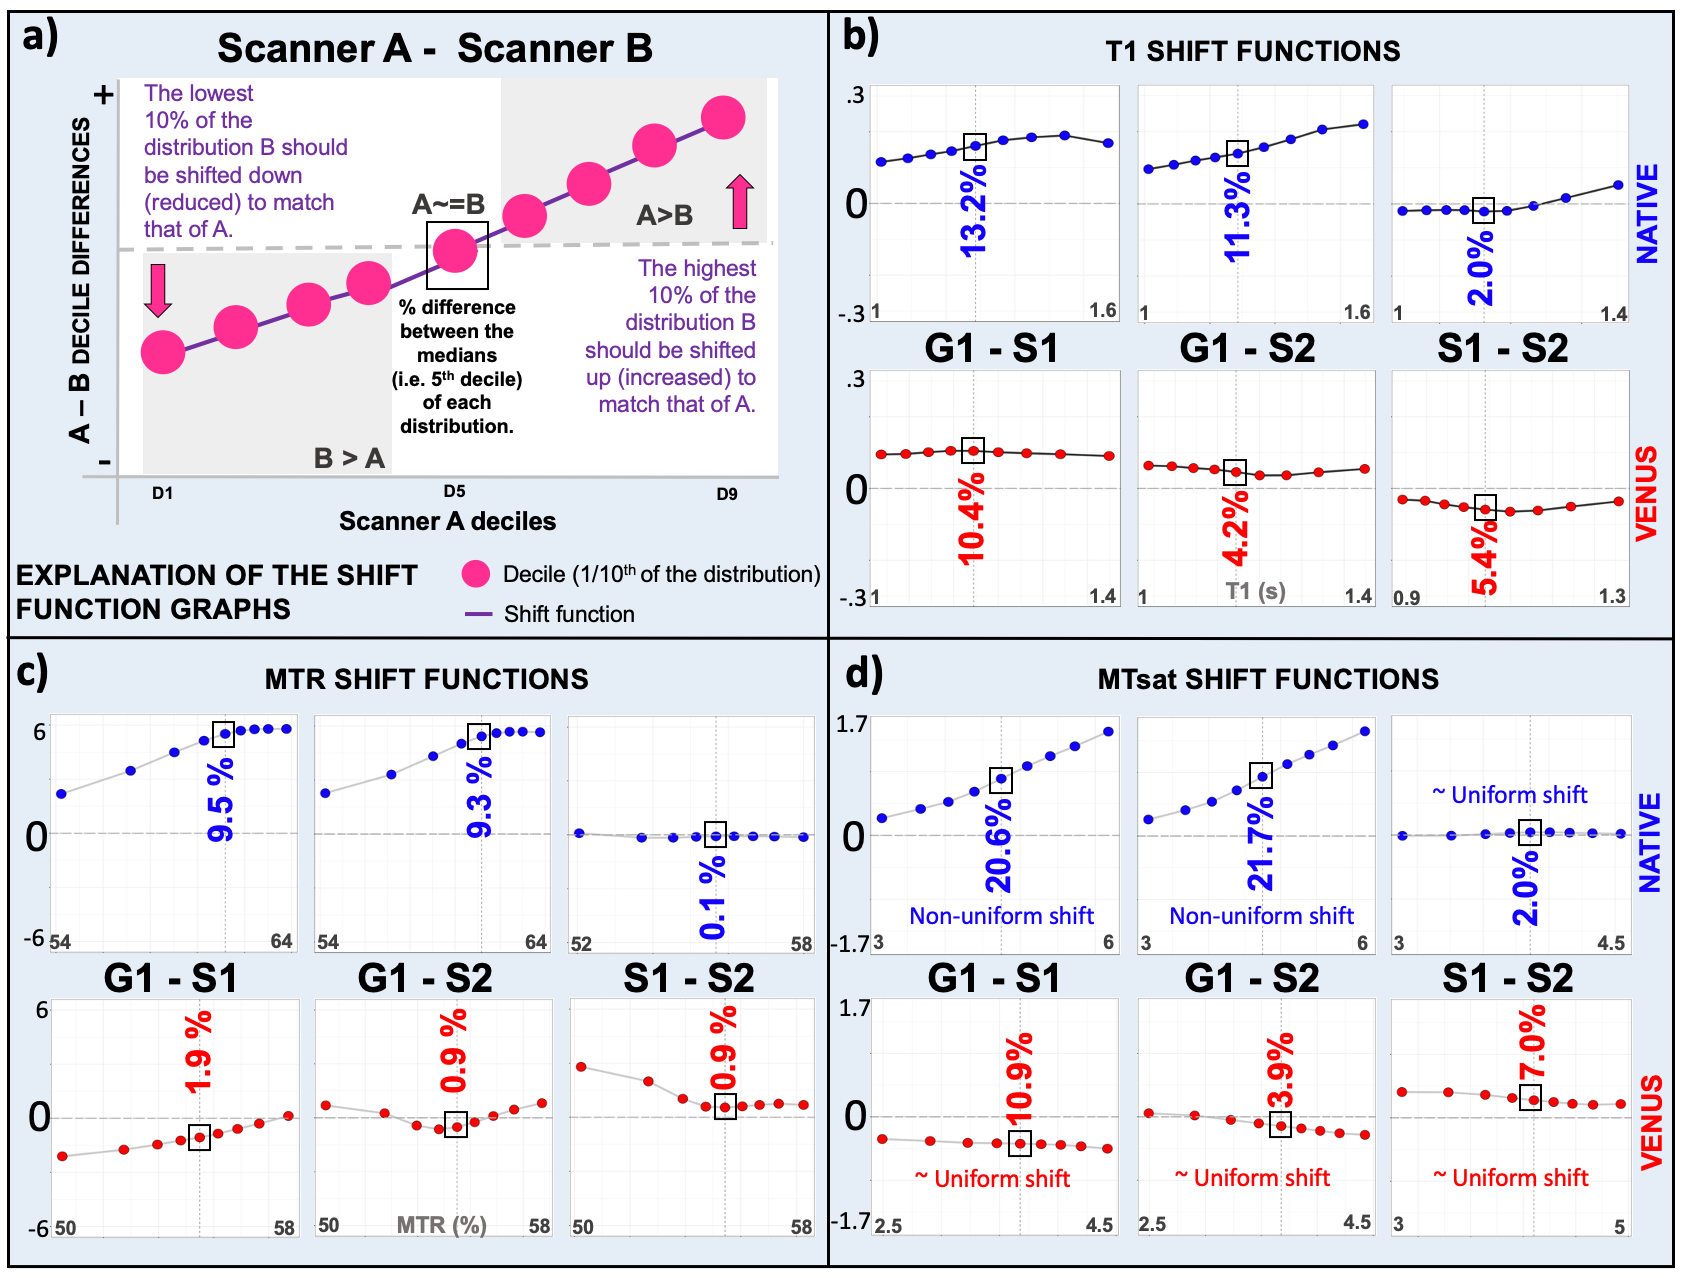
For statistical comparisons, 10mm spherical ROIs were prescribed at the 10 highest T1 reference spheres of the system phantom, and FSL16 was used for automatic white-matter (WM) segmentation on in-vivo T1w images. Percentile bootstrap based shift-function analysis17 was performed to compare VENUS vs vendor-native T1, MTR and MTsat maps between different scanners (G1-S1, G1-S2 and S1-S2) in WM. Wilcoxon signed-rank test was used for paired comparison of vendor-native (G1NATIVE-S1NATIVE, G1NATIVE-S2NATIVE) and VENUS (G1VENUS-S1VENUS, G1VENUS-S2VENUS) deviations (measured by percent difference at the median decile) between different vendors for all the qMRI maps.
Results
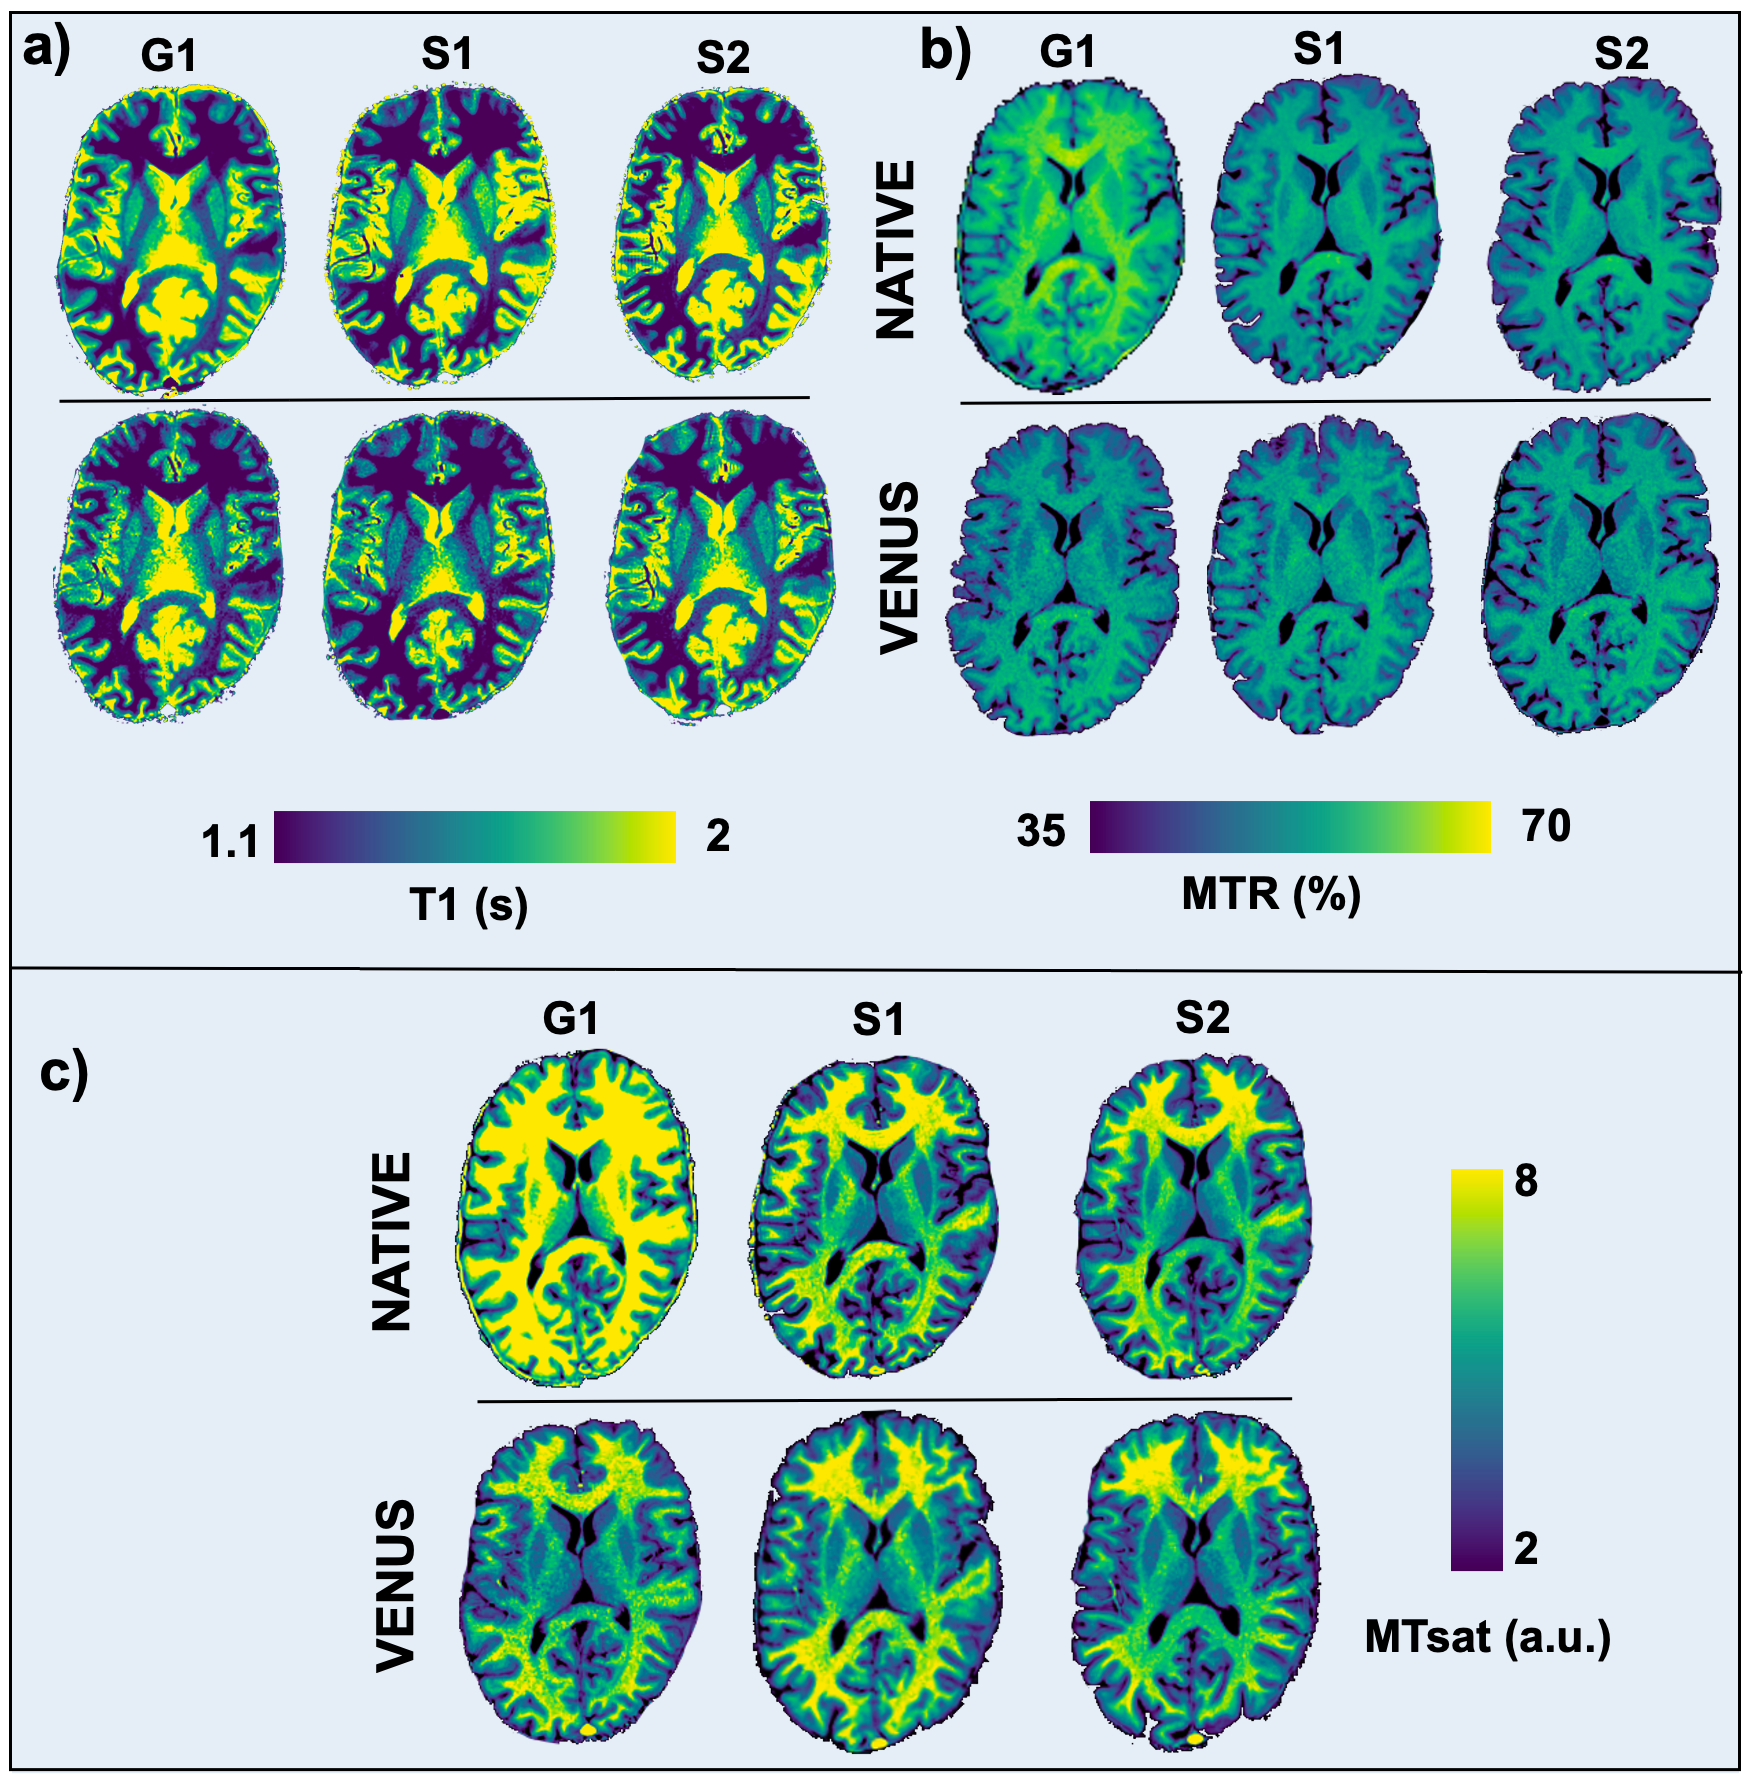
In the T1 range of 0.7-1.9s, S1-2VENUS deviates off the target less (0.4-4.3%) than all the vendor-native implementations (6.3-16.4%) (Fig.3a). Although G1VENUS underestimates the reference T1 across the range (12-24.8%), group averages indicate higher accuracy for VENUS in the relevant T1 range of white matter (WM) at 3T (Fig.-3b).Figure-4 shows in-vivo T1, MTR and MTsat maps acquired with the same sequences as in Figure-3. Overall, the vendor-neutral implementations result in qualitatively more similar maps, reducing the bias evident in the top row between G1 and S1-2 implementations. This is particularly evident for MTR and MTsat, where the vendor-native G1 implementation produces higher values than S1-2.
As evidenced from Figure-4 (b-c), VENUS compensates for the vendor-native bias observed in MTR and MTsat maps. This is further supported by the shift function analysis in WM: combined influence of vendor-specific T1 and MTR variability translates up to a 21.7% difference between G1 and S1-2 in MTsat (Fig.5b-c). VENUS reduces the difference down to 3.9%, while flattening the non-uniform shifts observed between vendor-native maps (Fig.5d). This reduction (G1 vs S1-2) is significant when all the maps are compared between vendor-native and VENUS implementations (p=0.03).
Discussion
Our findings demonstrate that VENUS can significantly reduce qMRI variability across vendors. Although comparable with the vendor-native deviations for the relevant T1 range, suboptimal G1VENUS accuracy (Fig.3a) can be explained by different behaviour of the RTHawk’s receiver gain controller (on G1 vs S1-2) in phantoms. Future work is warranted to address this limitation, by enabling more user control over vendor-specific receiver attenuation. Nevertheless, in-vivo multicenter performance of VENUS remains superior, providing a promising solution for the standardization of qMRI by solving the implementation problem at its source.Conclusion
VENUS is a flexible end-to-end solution to improve multicenter reproducibility of qMRI without sacrificing transparency. Quantitative MRI needs to dispense with undisclosed implementation details for clinical impact, and this work offers a powerful solution in that direction.Acknowledgements
This research was undertaken thanks, in part, to funding from the Canada First ResearchExcellence Fund through the TransMedTech Institute. The work is also funded in part by theMontreal Heart Institute Foundation, Canadian Open Neuroscience Platform (Brain CanadaPSG), Quebec Bio-imaging Network (NS, 8436-0501 and JCA, 5886, 35450), Natural Sciencesand Engineering Research Council of Canada (NS, 2016-06774 and JCA, RGPIN-2019-07244),Fonds de Recherche du Québec (JCA, 2015-PR-182754), Fonds de Recherche du Québec- Santé (NS, FRSQ-36759, FRSQ-35250 and JCA, 28826), Canadian Institute of HealthResearch (JCA, FDN-143263 and GBP, FDN-332796), Canada Research Chair in QuantitativeMagnetic Resonance Imaging (950-230815), CAIP Chair in Health Brain Aging, CourtoisNeuroMod project and International Society for Magnetic Resonance in Medicine (ISMRMResearch Exchange Grant).References
1. Lee, Y., M.F. Callaghan, J. Acosta-Cabronero, et al., Establishing intra- and inter-vendor reproducibility of T1 relaxation time measurements with 3T MRI. Magn Reson Med, 2019. 81(1): p. 454-465.
2. Sasaki, M., K. Yamada, Y. Watanabe, et al., Variability in absolute apparent diffusion coefficient values across different platforms may be substantial: a multivendor, multi-institutional comparison study. Radiology, 2008. 249(2): p. 624-630.
3. Ag Teixeira, R.P., R. Neji, T.C. Wood, et al., Controlled saturation magnetization transfer for reproducible multivendor variable flip angle T1 and T2 mapping. Magnetic resonance in medicine, 2020. 84(1): p. 221-236.
4. Gracien, R.-M., M. Maiworm, N. Brüche, et al., How stable is quantitative MRI? – Assessment of intra- and inter-scanner-model reproducibility using identical acquisition sequences and data analysis programs. NeuroImage, 2020. 207: p. 116364.
5. Stöcker, T., K. Vahedipour, D. Pflugfelder, et al., High‐performance computing MRI simulations. Magnetic resonance in medicine, 2010. 64(1): p. 186-193.
6. Magland, J.F., C. Li, M.C. Langham, et al., Pulse sequence programming in a dynamic visual environment: SequenceTree. Magnetic resonance in medicine, 2016. 75(1): p. 257-265.
7. Layton, K.J., S. Kroboth, F. Jia, et al., Pulseq: a rapid and hardware‐independent pulse sequence prototyping framework. Magnetic resonance in medicine, 2017. 77(4): p. 1544-1552.
8. Nielsen, J.F. and D.C. Noll, TOPPE: A framework for rapid prototyping of MR pulse sequences. Magnetic resonance in medicine, 2018. 79(6): p. 3128-3134.
9. Ravi, K.S., S. Geethanath, and J.T. Vaughan, PyPulseq: A python package for mri pulse sequence design. Journal of Open Source Software, 2019. 4(42): p. 1725.
10. Cordes, C., S. Konstandin, D. Porter, et al., Portable and platform‐independent MR pulse sequence programs. Magnetic resonance in medicine, 2020. 83(4): p. 1277-1290.
11. Helms, G., H. Dathe, K. Kallenberg, et al., High-resolution maps of magnetization transfer with inherent correction for RF inhomogeneity and T1 relaxation obtained from 3D FLASH MRI. Magn Reson Med, 2008. 60(6): p. 1396-407.
12. Santos, J.M., G.A. Wright, and J.M. Pauly. Flexible real-time magnetic resonance imaging framework. IEEE, 2004.
13. Karakuzu, A., S. Appelhoff, T. Auer, et al., qMRI-BIDS: an extension to the brain imaging data structure for quantitative magnetic resonance imaging data. medRxiv, 2021: p. 2021.10.22.21265382.
14. Inati, S.J., J.D. Naegele, N.R. Zwart, et al., ISMRM Raw data format: A proposed standard for MRI raw datasets. Magnetic resonance in medicine, 2017. 77(1): p. 411-421.
15. Karakuzu, A., M. Boudreau, J. Cohen-Adad, et al. Thinking outside the blackbox: A fully transparent T1 mapping pipeline. in Proceedings of ISMRM 28th Annual Meeting. 2020. Paris, France: ISMRM.
16. Jenkinson, M., C.F. Beckmann, T.E.J. Behrens, et al., Fsl. Neuroimage, 2012. 62(2): p. 782-790.
17. Rousselet, G.A., C.R. Pernet, and R.R. Wilcox, Beyond differences in means: robust graphical methods to compare two groups in neuroscience. European Journal of Neuroscience, 2017. 46(2): p. 1738-1748.
Figures