0356
Measuring Diffusion of Healthy Human Muscle During Continuous Exercise from Motion-Compensated Intravoxel Incoherent Motion (IVIM) MRI1Cardiovascular Research Center, Massachusetts General Hospital, Charlestown, MA, United States, 2Athinoula A. Martinos Center for Biomedical Imaging, Massachusetts General Hospital, Charlestown, MA, United States, 3Harvard Medical School, Boston, MA, United States, 4Health Science Technology, Harvard-MIT, Cambridge, MA, United States
Synopsis
To date, it is unclear if diffusion increases in skeletal muscles during exercise. We measured diffusion, perfusion, perfusion fraction, and capillary blood flow in the calf during continuous exercise from IVIM fits on both standard (M0) and second order motion-compensated (M2) DWI sequences combined with motion artifact rejection. As diffusion estimates from M2 proved unchanged by artifact rejection at various thresholds, it was used in choosing an outlier threshold. Without artifact rejection, M0 reported diffusion increases. Once artifacts were removed from M0 using this threshold, it measured similar diffusion values to M2 and neither sequence showed diffusion increases during exercise.
Background
Intravoxel incoherent motion (IVIM) imaging is a contrast-free MR technique to measure perfusion and diffusion in tissue1-5. For cardiac and circulatory diseases, IVIM can be used to assess microcirculatory changes in the muscle during stress tests like exercise6-8. During exercise, perfusion and capillary blood flow are reported to increase2-5. Previous studies have also shown diffusion increases2,4-5, while others reported no diffusion changes3,5, both during and after intermittent exercise. These discrepancies may be partly explained by the sensitivity of standard DWI sequences to motion, which may worsen for large b-values and therefore result in over-estimations of diffusion. Second order motion compensated (M2) DWI sequences, meanwhile, have been shown to be more robust to motion, although they are also insensitive to perfusion9-10. Here, we used both standard (M0) and M2 DWI sequences with IVIM to assess diffusion in the calf during continuous exercise and compared the results using different artifact rejection levels.Methods
IVIM-MRI of the calf was performed on 7 healthy volunteers (3F, average age 39) in a 3T Prisma MRI scanner with a dedicated single-channel leg coil. Each subject was scanned with an M0 and an M2 sequence during rest-- before (PRE) and after (POST) exercise-- and while repeatedly pressing a weighted-pedal (DURING). DWI were acquired for 10 b-values (0,10,20,30,50,80,120,200,300,500 s/mm2) over 3 orthogonal directions x4 averages. Image resolution was 2.5x2.5x5mm3, matrix size 64x52, 12 slices, pixel bandwidth 2005 Hz/pixel, TE=72ms. After acquisition, the DURING and POST DWI were registered to the corresponding PRE images, compensating for tissue displacement. Artifact rejection was then performed on DURING images by comparing their signal to the average of the corresponding PRE images with matched b-values. An image was determined to have artifacts, and removed, when the difference in signal was above a predetermined threshold, which varied between 0 and 50%. All remaining DWI were then averaged for each b-value over gradient directions and voxels within each muscle group-- Gastrocnemius, Soleus, Tibialis Posterior, Tibialis Anterior, and ‘Other’. These were manually segmented with Seg3D11 using M0 PRE images. Finally, the IVIM model was fit to the average M0 and M2 data, both before and after artifact rejection, for each muscle group using a two-stage approach implemented in DIPY (https://dipy.org). Perfusion (D*), diffusion (D), and perfusion fraction (f) were obtained from the fitted IVIM model and capillary blood flow (CBF) was calculated as (f x D*). Parameters were compared with Wilcoxon signed-rank tests and significance threshold 0.05.Results
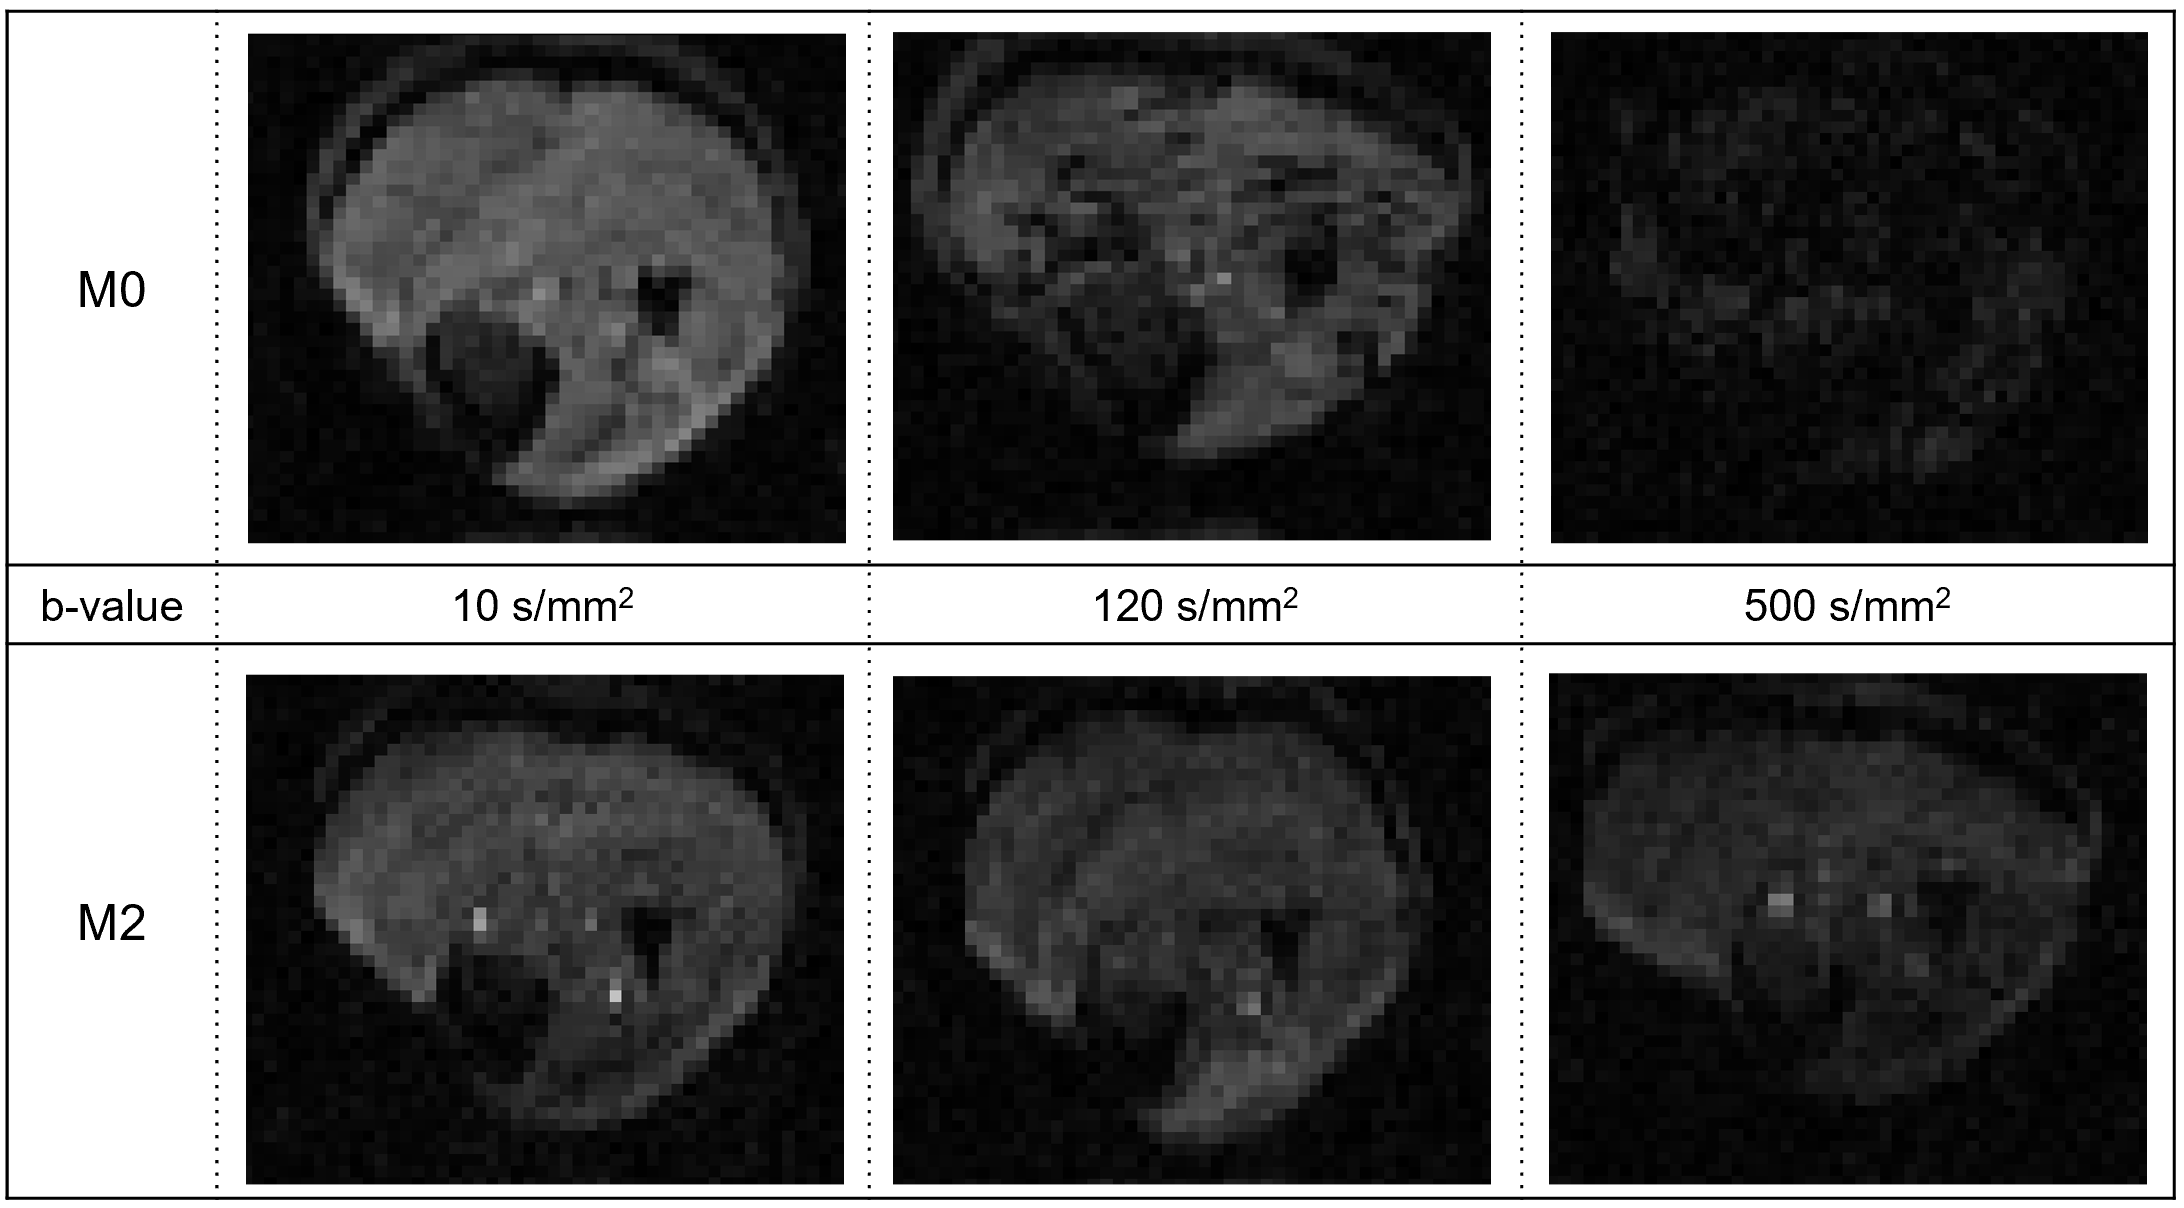
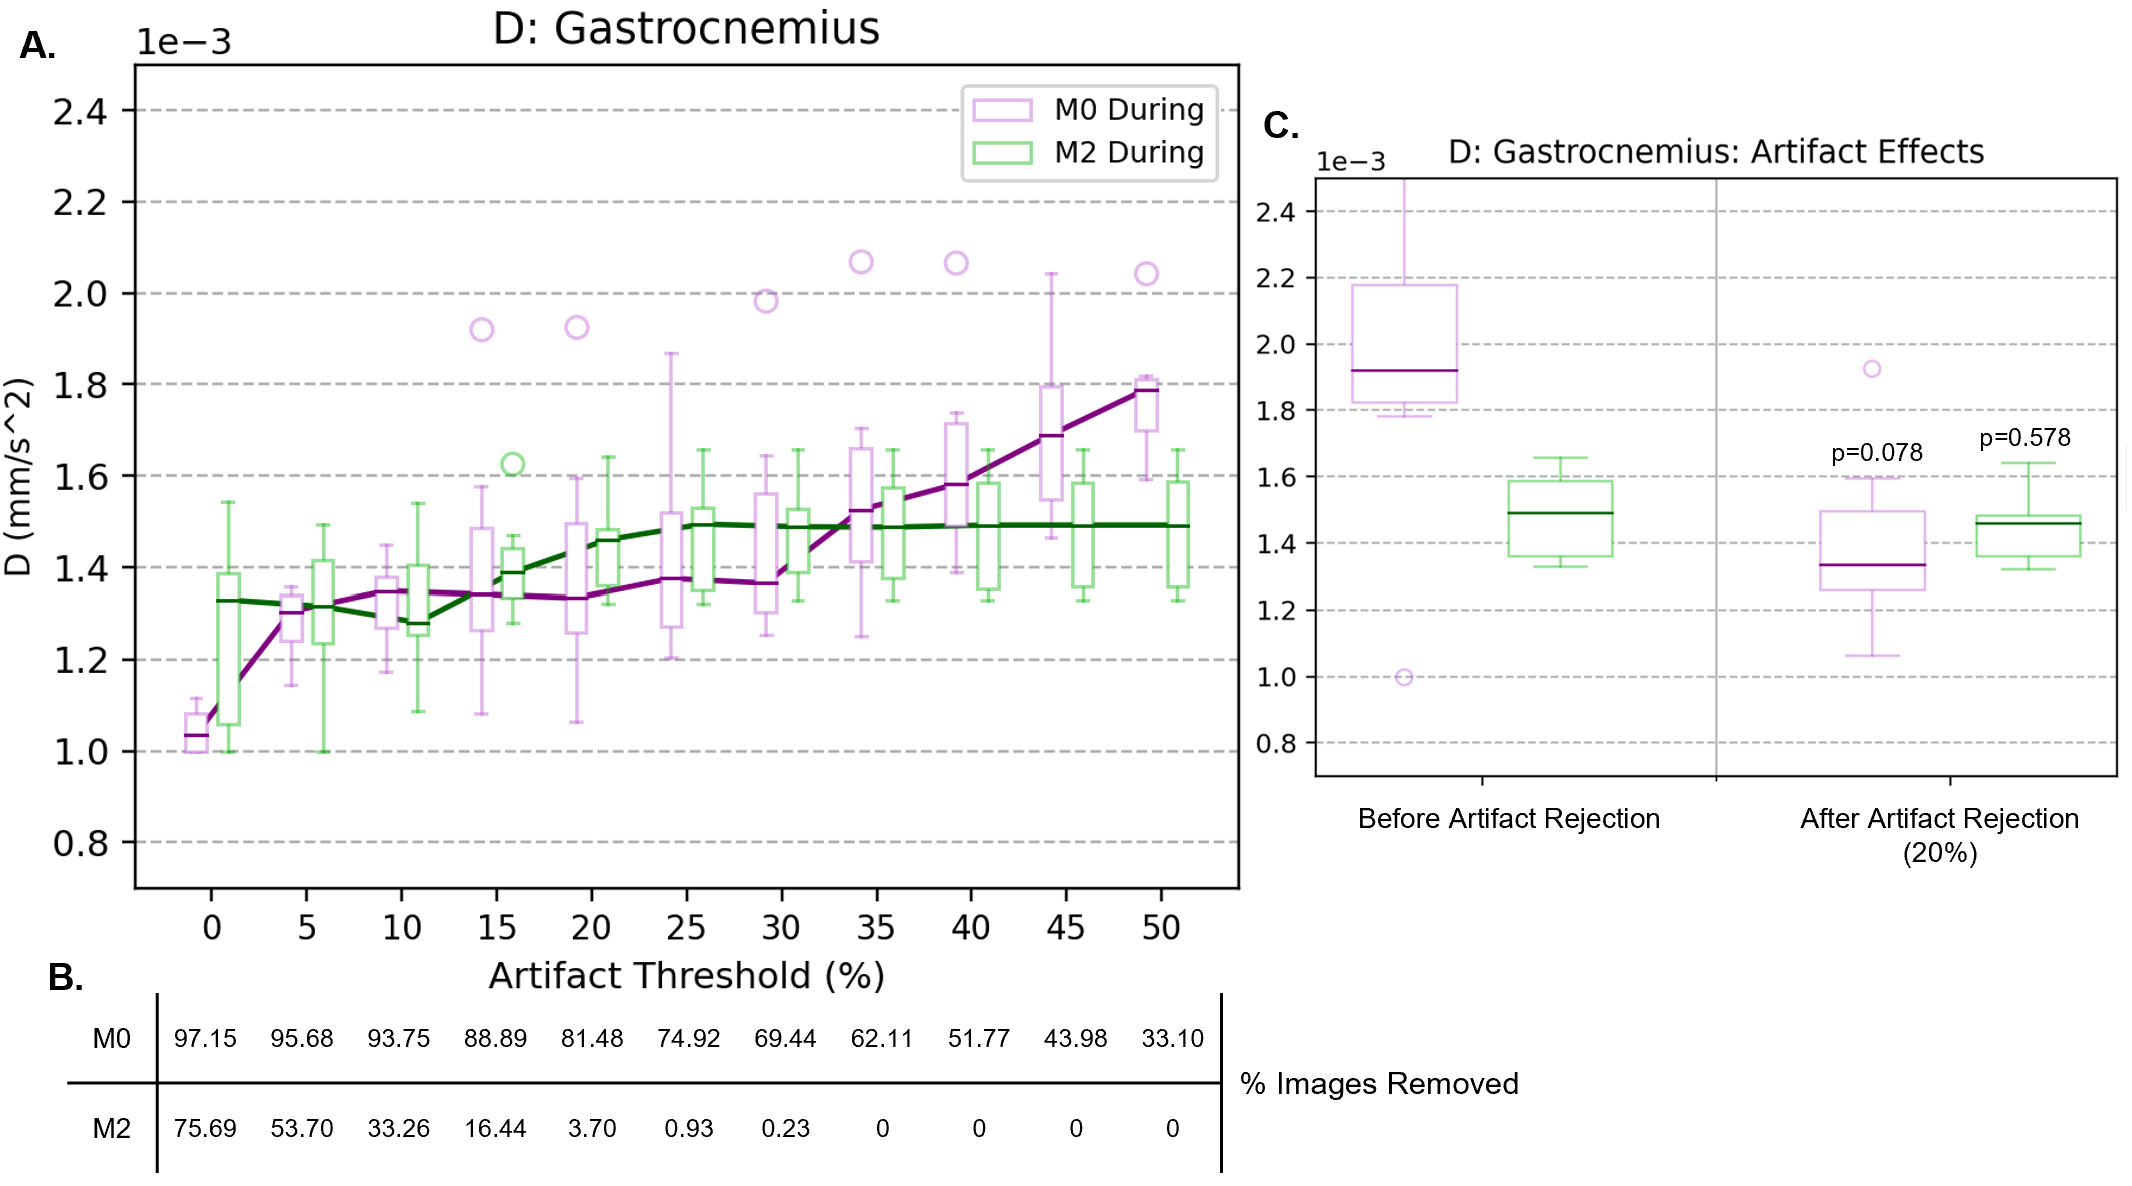
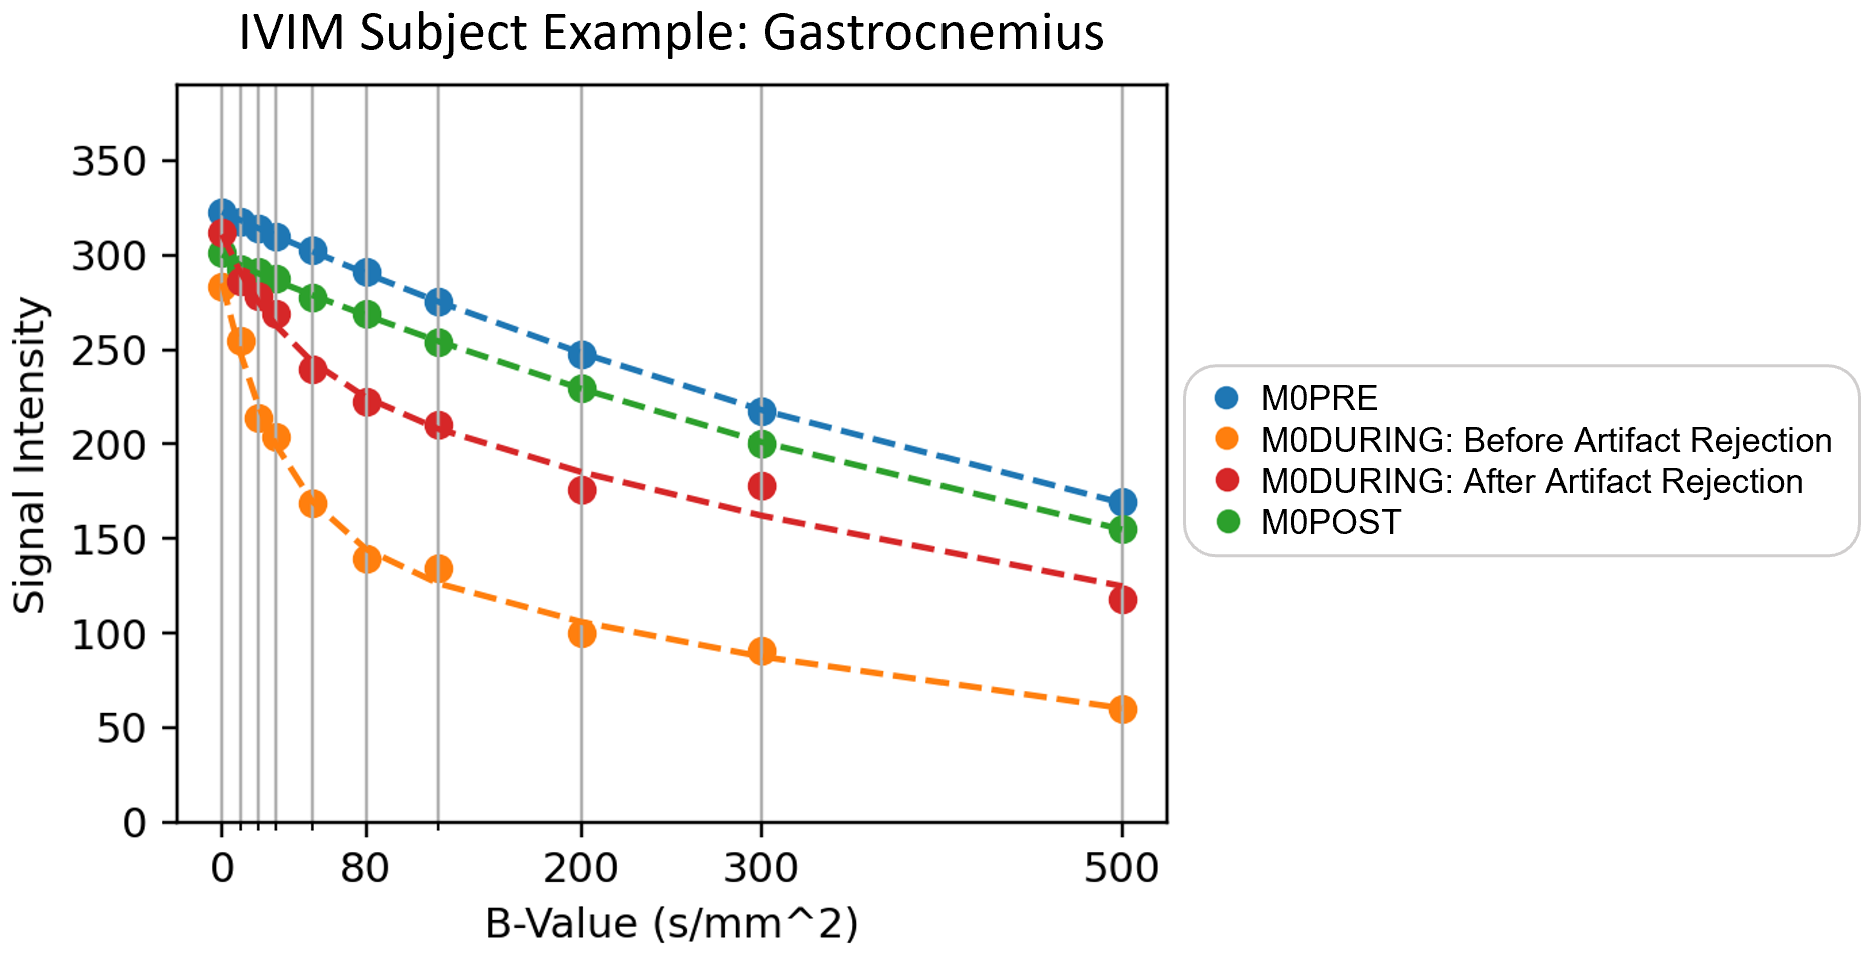
Example MR images for chosen b-values (10, 120, and 500 s/mm2) are included in Figure 1. As b-value increased, the signal intensity decreased for both sequences, while the number of artifacts increased in M0. M2 had fewer artifacts and they were consistent across b-values.Dependence of the diffusion coefficient during exercise on the outlier threshold for M0 and M2 can be found in Figure 2A. M2 provided consistent D estimates for all thresholds >20%. Meanwhile, D constantly increased with the threshold for M0. This increase briefly stabilized for thresholds 20-30%, with median values reflecting those of M2. Stricter thresholds <20% resulted in decreased diffusion for both sequences and larger standard deviations for M2, likely from many images being removed (Figure 2B). Given that results of M2 proved stable to motion, and that M0 gave a similar result as M2 for thresholds 20-30%, we chose the 20% threshold for the following experiments. Figure 2C then compares diffusion with and without this outlier threshold applied. Removing artifacts improved the standard deviation for M2 but did not change the median (p=0.578). In contrast, removing artifacts in M0 significantly reduced the median and standard deviation of D for all muscles (p<0.05) except the Gastrocnemius or Tibialis muscles (p=0.078). To further illustrate the effects of artifacts, Figure 3 shows the average signal and IVIM fitted curves with and without artifact correction. The presence of artifacts in M0 DURING resulted in lower signal for high b-values. This signal difference may lead to the overestimation of D seen in Figure 2C.
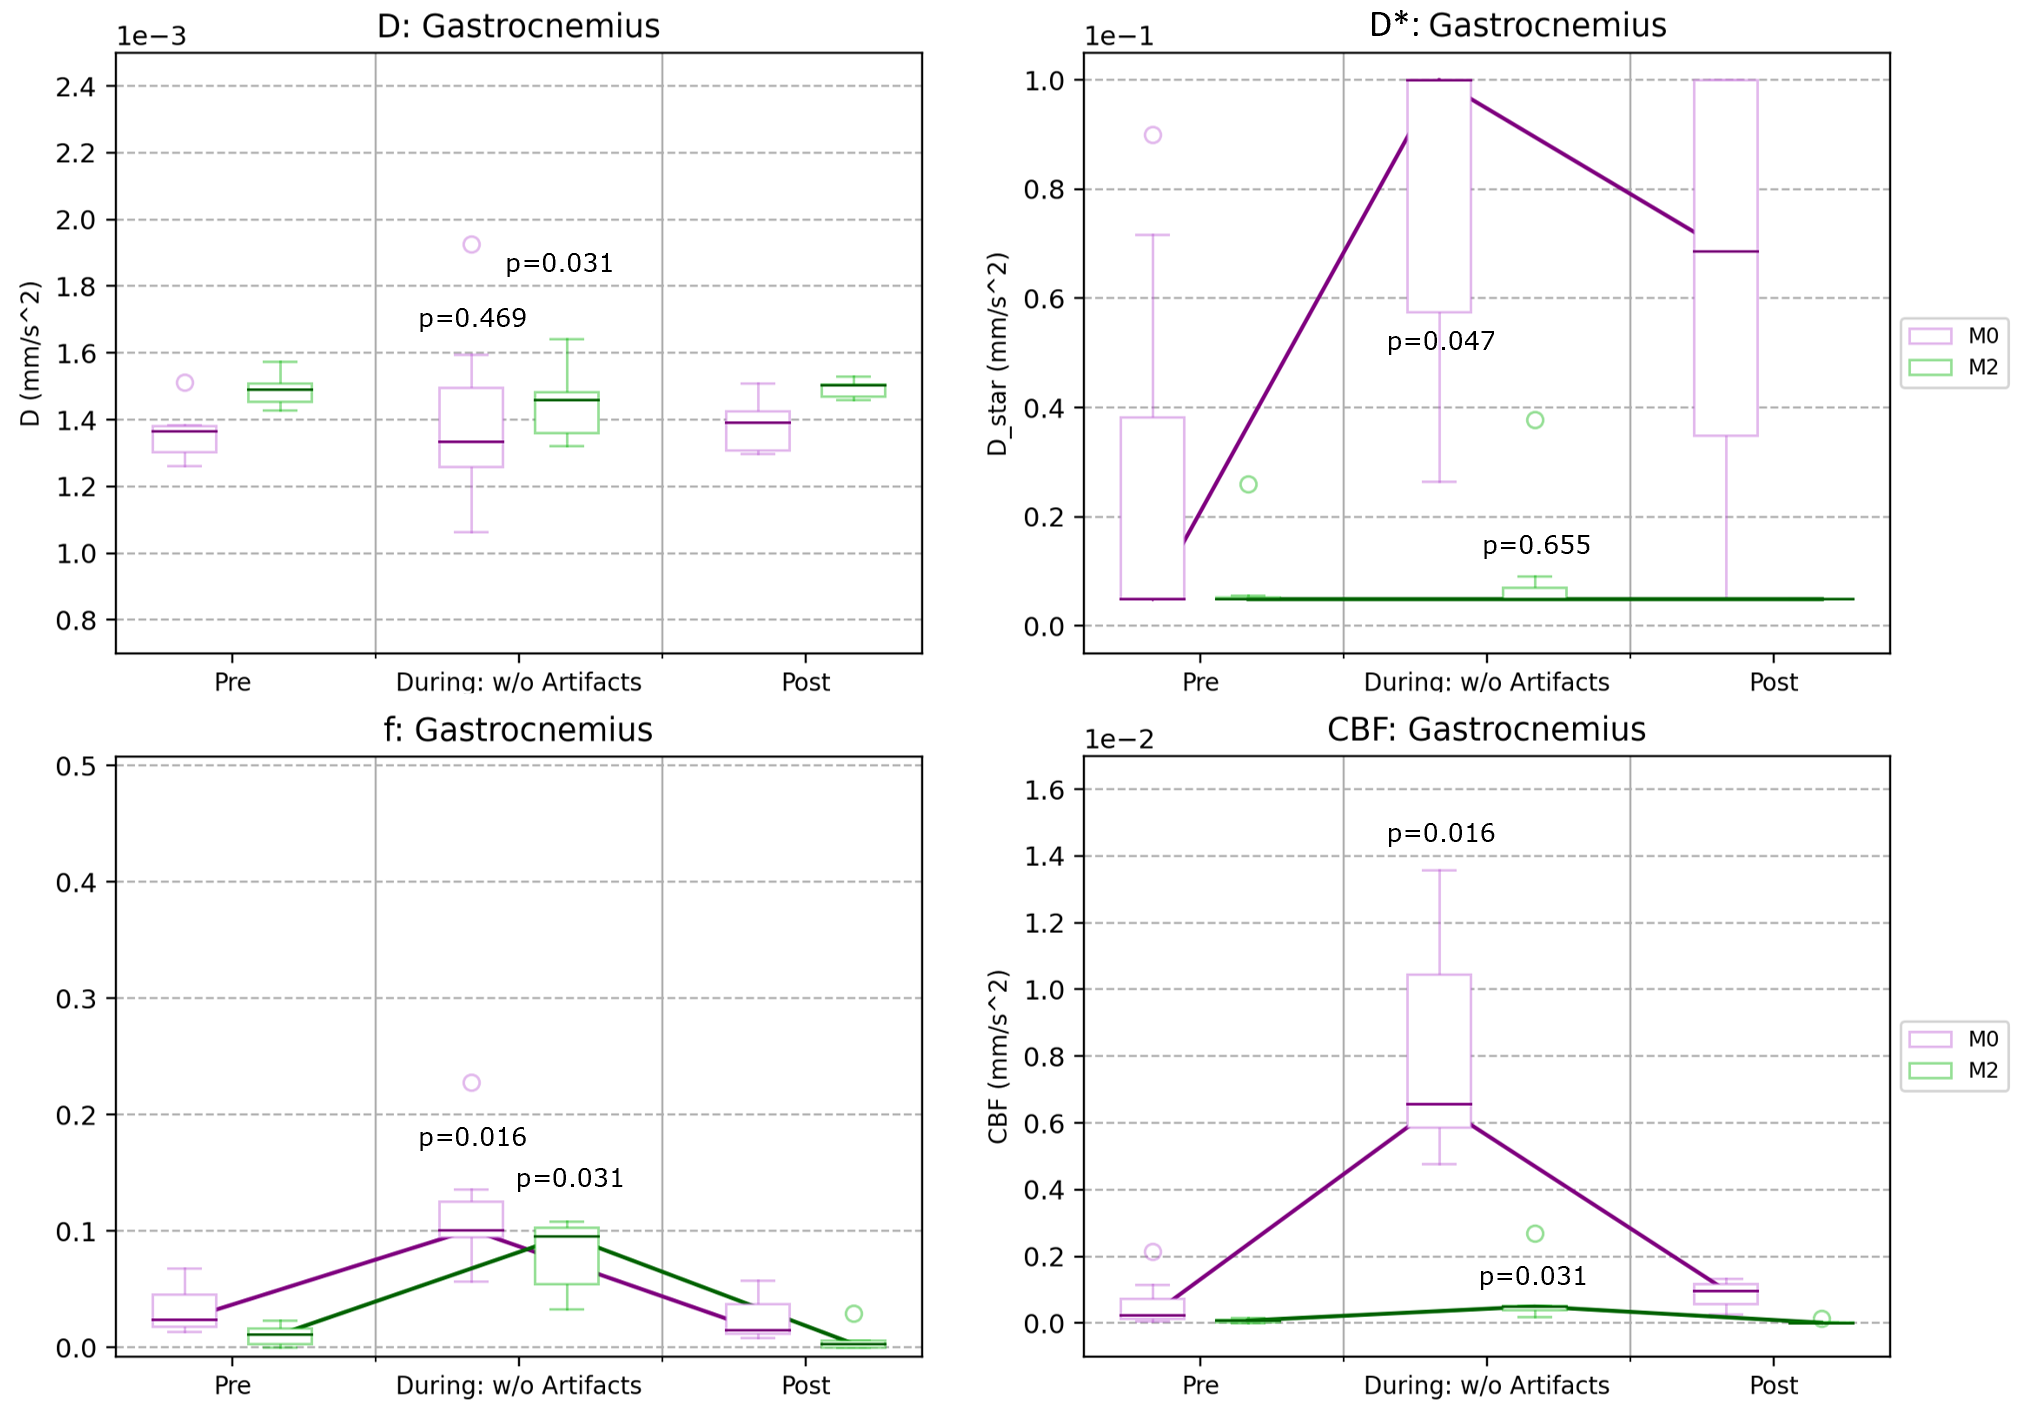
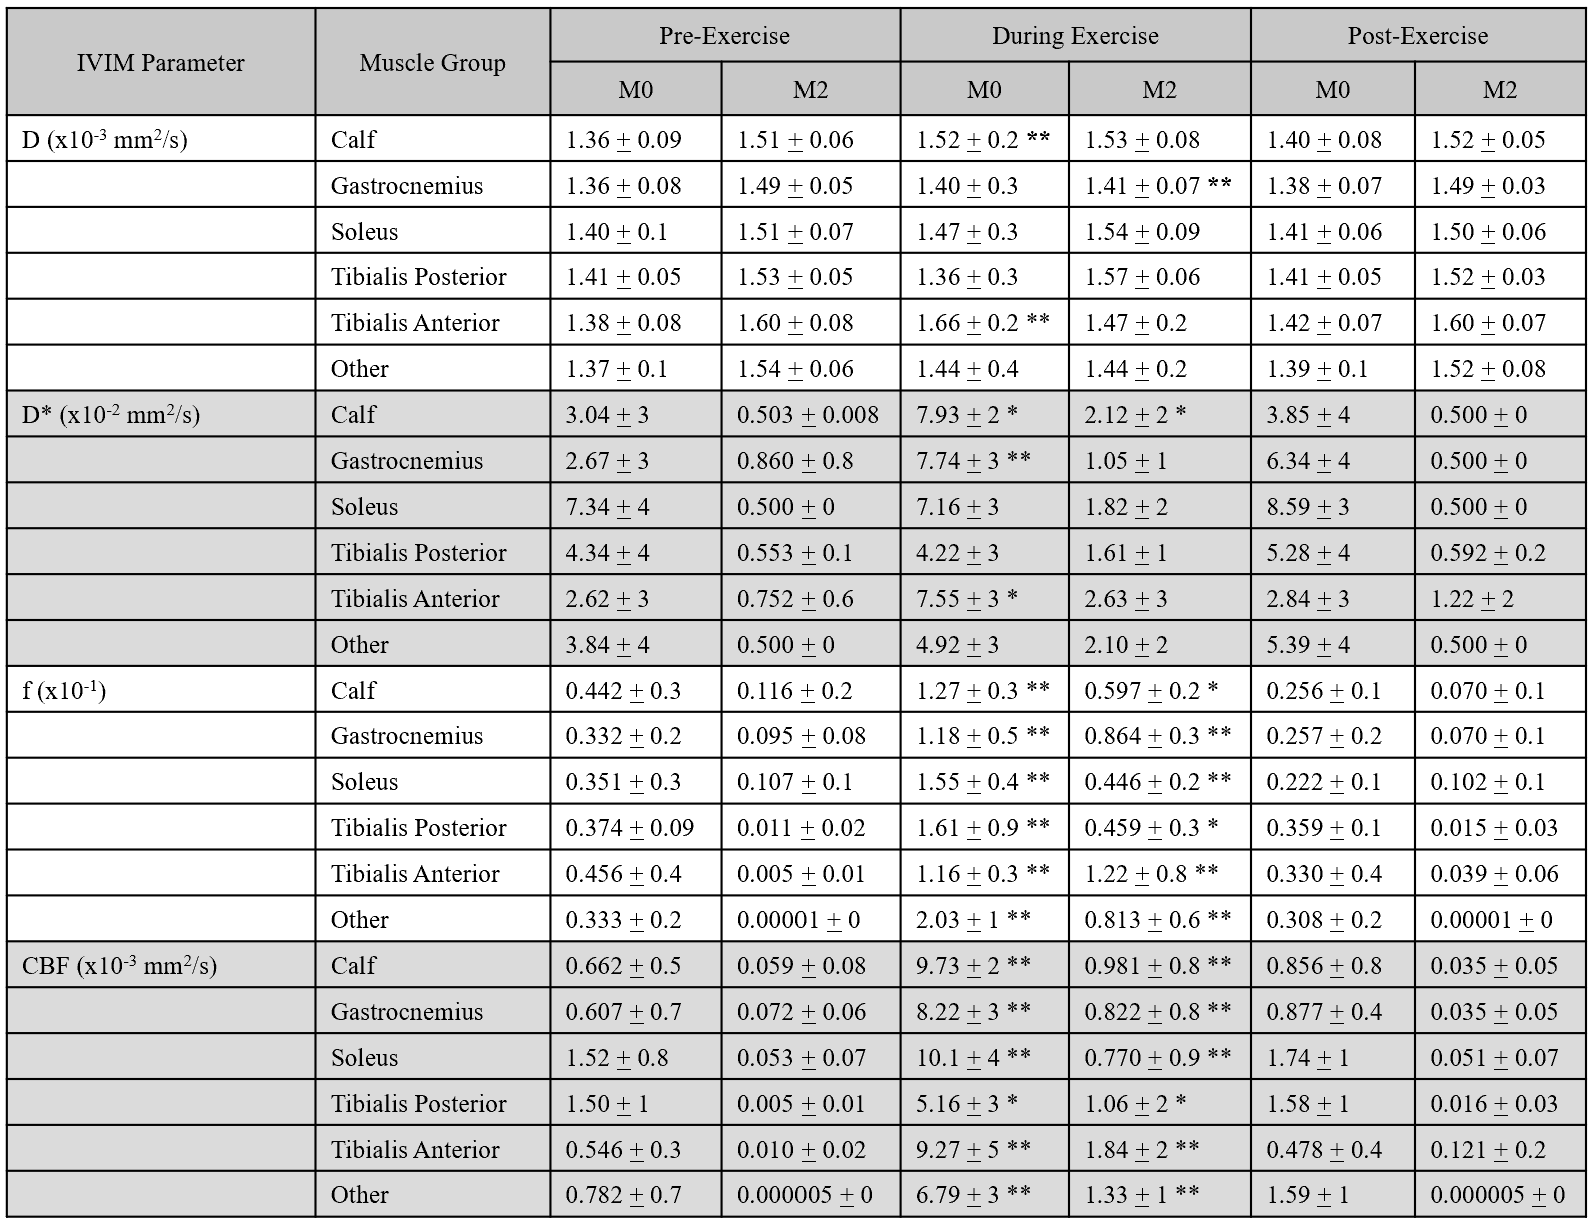
Finally, IVIM parameter changes are shown over different exercise states (PRE, DURING, and POST) in Table 1 (all muscle groups) and Figure 4 (example plots for the Gastrocnemius). M2 resulted in relatively constant values for all parameters. D did not change except in the Gastrocnemius (p<0.05), D* had increased standard deviation but did not show any significant difference (p=0.655), and f presented a slight increase (p<0.05). Meanwhile, M0 resulted in constant diffusion (p=0.469) except in the Tibialis Anterior (p<0.05), moderate increases in D* (p<0.05) and standard deviations, and increases in f (p<0.05). Consequently, M0 produced an increase in CBF (p<0.05) while M2 showed a more modest increase (p<0.05) during exercise.
Conclusion
Diffusion estimates obtained with a motion-compensated M2 DWI sequence were largely unchanged during exercise and demonstrated minimal bulk motion-induced artifacts. Furthermore, M2 can provide a guide to choose an artifact rejection threshold. Once artifacts were removed, M0 also presented no increases in diffusion during exercise for most muscles, while remaining sensitive to perfusion changes. These results are in accordance with other studies2-5, suggesting M0 IVIM imaging combined with artifact rejection can correctly measure diffusion, perfusion, perfusion fraction, and capillary blood flow during continuous exercise.Acknowledgements
This work was partially funded by the National Institutes of Health awards R01HL151704, R01HL159010, and R01HL135242.References
1. von Deuster, C., Stoeck, C. T., Wissmann, L., Spinner, G., Fleischmann, T., Emmert, M. Y., Cesarovic, N., & Kozerke, S. (2015). Verification of the intra-voxel incoherent motion (IVIM) model in the porcine heart. Proc. Intl. Soc. Mag. Reson. Med., 23, 2612.
2. Hiepe, P. & Reichenbach, J. (2013). Functional Muscle MRI in Human Calf Muscle using IVIM. Ismrm, 44(12), 2577.
3. Ogura, A., Sotome, H., Asai, A., & Fuju, A. (2020). Evaluation of capillary blood volume in the lower limb muscles after exercise by intravoxel incoherent motion. Radiologia Medica, 125(5), 474–480. https://doi.org/10.1007/s11547-020-01163-5
4. Jungmann, P. M., Pfirrmann, C., & Federau, C. (2019). Characterization of lower limb muscle activation patterns during walking and running with Intravoxel Incoherent Motion (IVIM) MR perfusion imaging. Magnetic Resonance Imaging, 63(July), 12–20. https://doi.org/10.1016/j.mri.2019.07.016
5. Mastropietro, A., Porcelli, S., Cadioli, M., Rasica, L., Scalco, E., Gerevini, S., Marzorati, M., & Rizzo, G. (2018). Triggered intravoxel incoherent motion MRI for the assessment of calf muscle perfusion during isometric intermittent exercise. NMR in Biomedicine, 31(6), 1–13. https://doi.org/10.1002/nbm.3922
6. Anderson L, Oldridge N, Thompson DR, et al. Exercise-Based Cardiac Rehabilitation for Coronary Heart Disease: Cochrane Systematic Review and Meta-Analysis. Journal of the American College of Cardiology 2016;67:1-12.
7. Belardinelli R, Paolini I, Cianci G, Piva R, Georgiou D, Purcaro A. Exercise training intervention after coronary angioplasty: the ETICA trial. Journal of the American College of Cardiology 2001;37:1891-900.
8. Duerschmied, D., Zhou, Q., Rink, E., Harder, D., Freund, G., Olschewski, M., Bode, C., & Hehrlein, C. (2009). Simplified contrast ultrasound accurately reveals muscle perfusion deficits and reflects collateralization in PAD. Atherosclerosis, 202(2), 505–512. https://doi.org/10.1016/j.atherosclerosis.2008.05.046
9. Coll-Font, J., Perlman, O., Chen, S., Eder, R. A., Farrar, C. T., & Nguyen, C. T. (2021). Evaluating the Effects of Motion Compensation to IVIM Fitting in In-Vivo DW-MRI of the Muscle. On proceedings of the International Society for Magnetic Resonance in Medicine (ISMRM) 2021.
10. G. R. Spinner, C. T. Stoeck, L. Mathez, C. von Deuster, C. Federau, and S. Kozerke, “On probing intravoxel incoherent motion in the heart‐spin‐echo versus stimulated‐echo DWI,” Magn. Reson. Med., vol. 82, no. 3, p. mrm.27777, Apr. 2019.
11. CIBC (2016). Seg3D: Volumetric Image Segmentation and Visualization. Scientific Computing and Imaging Institute (SCI), Download from: http://www.seg3d.org
Figures