0351
Silent Motion-Corrected ZTE for Quantitative T1 and T2 mapping
Emil Ljungberg1,2, Tobias C Wood2, Ana Beatriz Solana3, Gareth J Barker2, and Florian Wiesinger2,3
1Medical Radiation Physics, Lund University, Lund, Sweden, 2Neuroimaging, King's College London, London, United Kingdom, 3GE Healthcare, Munich, Germany
1Medical Radiation Physics, Lund University, Lund, Sweden, 2Neuroimaging, King's College London, London, United Kingdom, 3GE Healthcare, Munich, Germany
Synopsis
We present a method for retrospective motion-correction of silent ZTE for quantitative T1 and T2 mapping using self-navigation. A spiral phyllotaxis k-space trajectory was used to reconstruct motion navigators, which then were co-registered to obtain motion parameters. The method is demonstrated for neuroimaging, showing improved image quality of quantitative T1 and T2 maps after motion correction. These results further showcase the capacity of ZTE for robust, silent neuroimaging.
Introduction
Imaging sequences that acquire multiple contrasts in a single scan are gaining increasing interest due to inherent co-registration of the different images and the ability to extract quantitative information1,2. Although the different contrast images are implicitly registered, motion will still cause artefacts, principally blurring. Methods have been proposed to correct for motion during multi-contrast acquisitions, including iterative reconstruction frameworks3, self-navigation4, and interleaved navigators5.We have previously demonstrated retrospective motion correction for single-contrast T1-weighted ZTE using self-navigation6, which maintains the silent acquisition and does not require additional hardware. Here we incorporate this method into a multi-contrast Zero Echo Time (ZTE) acquisition strategy7 for quantitative T1 and T2 mapping.
Methods
A healthy volunteer was imaged in a 3T scanner (GE MR750, GE Healthcare Waukesha, WI) with a 32-channel head coil (Nova Medical) using a silent ZTE acquisition. The sequence consisted of four interleaved segments with different T1- and T2-weightings and a separate steady-state PD-weighted acquisition7 (see Figure 1A). Data were acquired at 1 mm3 isotropic resolution with a 192 mm3 cubic field of view. A separate acquisition with reduced gradient strength (but the same contrasts) was acquired in the beginning to fill the deadtime gap8. The total acquisition time was 10 minutes.The sequence used an interleaved spiral phyllotaxis k-space trajectory with 1280 spokes per interleave9. Although five segments (containing 256 spokes each) were required for full k-space coverage, navigator images were reconstructed from sets of eight segments to ensure similar contrast (Figure 1C). This resulted in an effective temporal resolution of ~4 s per motion navigator. The participant was instructed to move position four times during the scan to evaluate the effectiveness of the motion correction.
Motion parameters were estimated using a rigid body registration, and the corrections were applied to the raw k-space data10,11. Individual images were reconstructed with TGV regularisation (λ=10-4, Nit=8) using RIESLING12. T1 and T2 parameter maps were obtained through dictionary fitting, using the PD-weighted image as the assumed true PD.
Results
Figure 2 shows the first ten navigator images. The brain image contrast is similar, but there are visible variations in intensity outside the brain (yellow arrows) and delineation of structures such as the lateral ventricles (red arrows). The pattern of varying image features appears to repeat after five navigators. Figure 3 shows the results of the navigator registration where the different subject poses are observed from the step-like change in translation (in y) and rotation (in x). However, a rapid oscillation in the motion estimates is seen in the z translation (~1 mm) and y rotation (<1°).The motion-corrected individual contrast-weighted images, reconstructed from the acquisition, are shown in Figure 4, which shows improved image quality with retrospective motion correction, but also the inherent motion robustness of ZTE (only minor artefacts from motion). The quantitative T1 and T2 maps obtained from the motion corrected data (Figure 5) shows corresponding improvement in image quality. The T2 map shows greater improvement after motion correction than the T1 map.
Discussion
Retrospective motion correction by co-registering navigator images should ideally only be sensitive to actual subject motion. However, the result from the present study demonstrates that the multi-contrast ZTE acquisition introduced periodic variation in image features, which were interpreted as motion by the registration cost function. The oscillating image features are most likely due to a combination of the repeated streaking pattern from the sparse spiral spoke arrangement within each navigator, as well as the contrast variations in k-space. When the sampling pattern of two navigators aligns, undersampling artefacts should be similar. With a golden angle increment between spirals as used here, spirals will align best after N navigators when N is a Fibonacci number. This hypothesis is consistent with our observation of repeating image features every five navigators (Figure 2). Furthermore, the arrangement of contrast-weighted segments in k-space repeat every five navigators (Figure 1C), which also could contribute to fluctuation in image contrast. Consequently, these two factors are likely the cause of the oscillations in the motion parameters (Figure 3). Future work will investigate alternative acquisition and registration strategies to accommodate these factors.We observed good improvement in image quality after motion correction, both in the reconstructed contrast-weighted images and the quantitative T1 and T2 maps. The improvement was particularly visible in the T2-map, likely due to only having one image with T2 sensitivity. One application of quantitative T1 and T2 mapping methods is generation (synthesis) of contrast weighted images13. Artefacts in the parameter maps will thus transfer directly to the generated images. An important contrast for clinical adoption is T2-FLAIR, which uses PD, T1 and T2 information. Motion correction is thus essential for successful adoption in clinical settings.
Conclusion
We have demonstrated a method for retrospective, self-navigated, motion correction using silent ZTE for quantitative T1 and T2 mapping. This represents a step further towards a comprehensive, motion-robust, multi-contrast, silent neuroimaging protocol that could find numerous research and clinical applications, specifically for subjects sensitive to acoustic noise.Acknowledgements
This work was supported by the Wellcome/EPSRC Centre for Medical Engineering [WT 203148/Z/16/Z]. This study represents independent research part funded by the NIHR-Wellcome Trust King’s Clinical Research Facility and the National Institute for Health Research (NIHR) Biomedical Research Centre at South London and Maudsley NHS Foundation Trust and King’s College London. The views expressed are those of the author(s) and not necessarily those of the NHS, the NIHR or the Department of Health and Social Care.References
1. Marques, J. P. et al. MP2RAGE, a self bias-field corrected sequence for improved segmentation and T1-mapping at high field. Neuroimage 49, 1271–1281 (2010).2. Fujita, S. et al. 3D quantitative synthetic MRI-derived cortical thickness and subcortical brain volumes: Scan–rescan repeatability and comparison with conventional T1-weighted images. J. Magn. Reson. Imaging 50, 1834–1842 (2019).
3. Mehta, B. B. et al. Image reconstruction algorithm for motion insensitive MR Fingerprinting (MRF): MORF. Magn. Reson. Med. 80, 2485–2500 (2018).
4. Cruz, G., Jaubert, O., Schneider, T., Botnar, R. M. & Prieto, C. Rigid motion-corrected magnetic resonance fingerprinting. Magn. Reson. Med. 81, 947–961 (2019).
5. Fujita, S. et al. Prospective motion-corrected three-dimensional multiparametric mapping of the brain. in Proc. Intl. Soc. Mag. Reson. Med. 1371 (2021).
6. Ljungberg, E. et al. MERLIN: Motion Insensitive Silent Neuroimaging. in Proc Intl Soc Mag Reson Med 0120 (2021).
7. Wiesinger, F. et al. 3D Silent Parameter Mapping: Further refinements & quantitative assessment. in Proc. Intl. Soc. Mag. Reson. Med 1828 (2021).
8. Froidevaux, R. et al. Filling the dead time gap in zero echo time MRI: principles compared. Magn. Reson. Med. 79, 2036–2045 (2018).
9. Piccini, D., Littmann, A., Nielles-Vallespin, S. & Zenge, M. O. Spiral phyllotaxis: The natural way to construct a 3D radial trajectory in MRI. Magn. Reson. Med. 66, 1049–1056 (2011).
10. Mccormick, M., Liu, X., Jomier, J., Marion, C. & Ibanez, L. ITK: Enabling reproducible research and open science. Front. Neuroinform. 8, 1–11 (2014).
11. Maas, L. C., Frederick, B. D. B. & Renshaw, P. F. Decoupled automated rotational and translational registration for functional MRI time series data: The DART registration algorithm. Magn. Reson. Med. 37, 131–139 (1997).
12. Wood, T. C., Ljungberg, E. & Wiesinger, F. Radial Interstices Enable Speedy Low-volume Imaging. J. Open Source Softw. 6, 3500 (2021).
13. Tanenbaum, L. N. et al. Synthetic MRI for clinical neuroimaging: Results of the magnetic resonance image compilation (MAGiC) prospective, multicenter, multireader trial. Am. J. Neuroradiol. 38, 1103–1110 (2017).
Figures
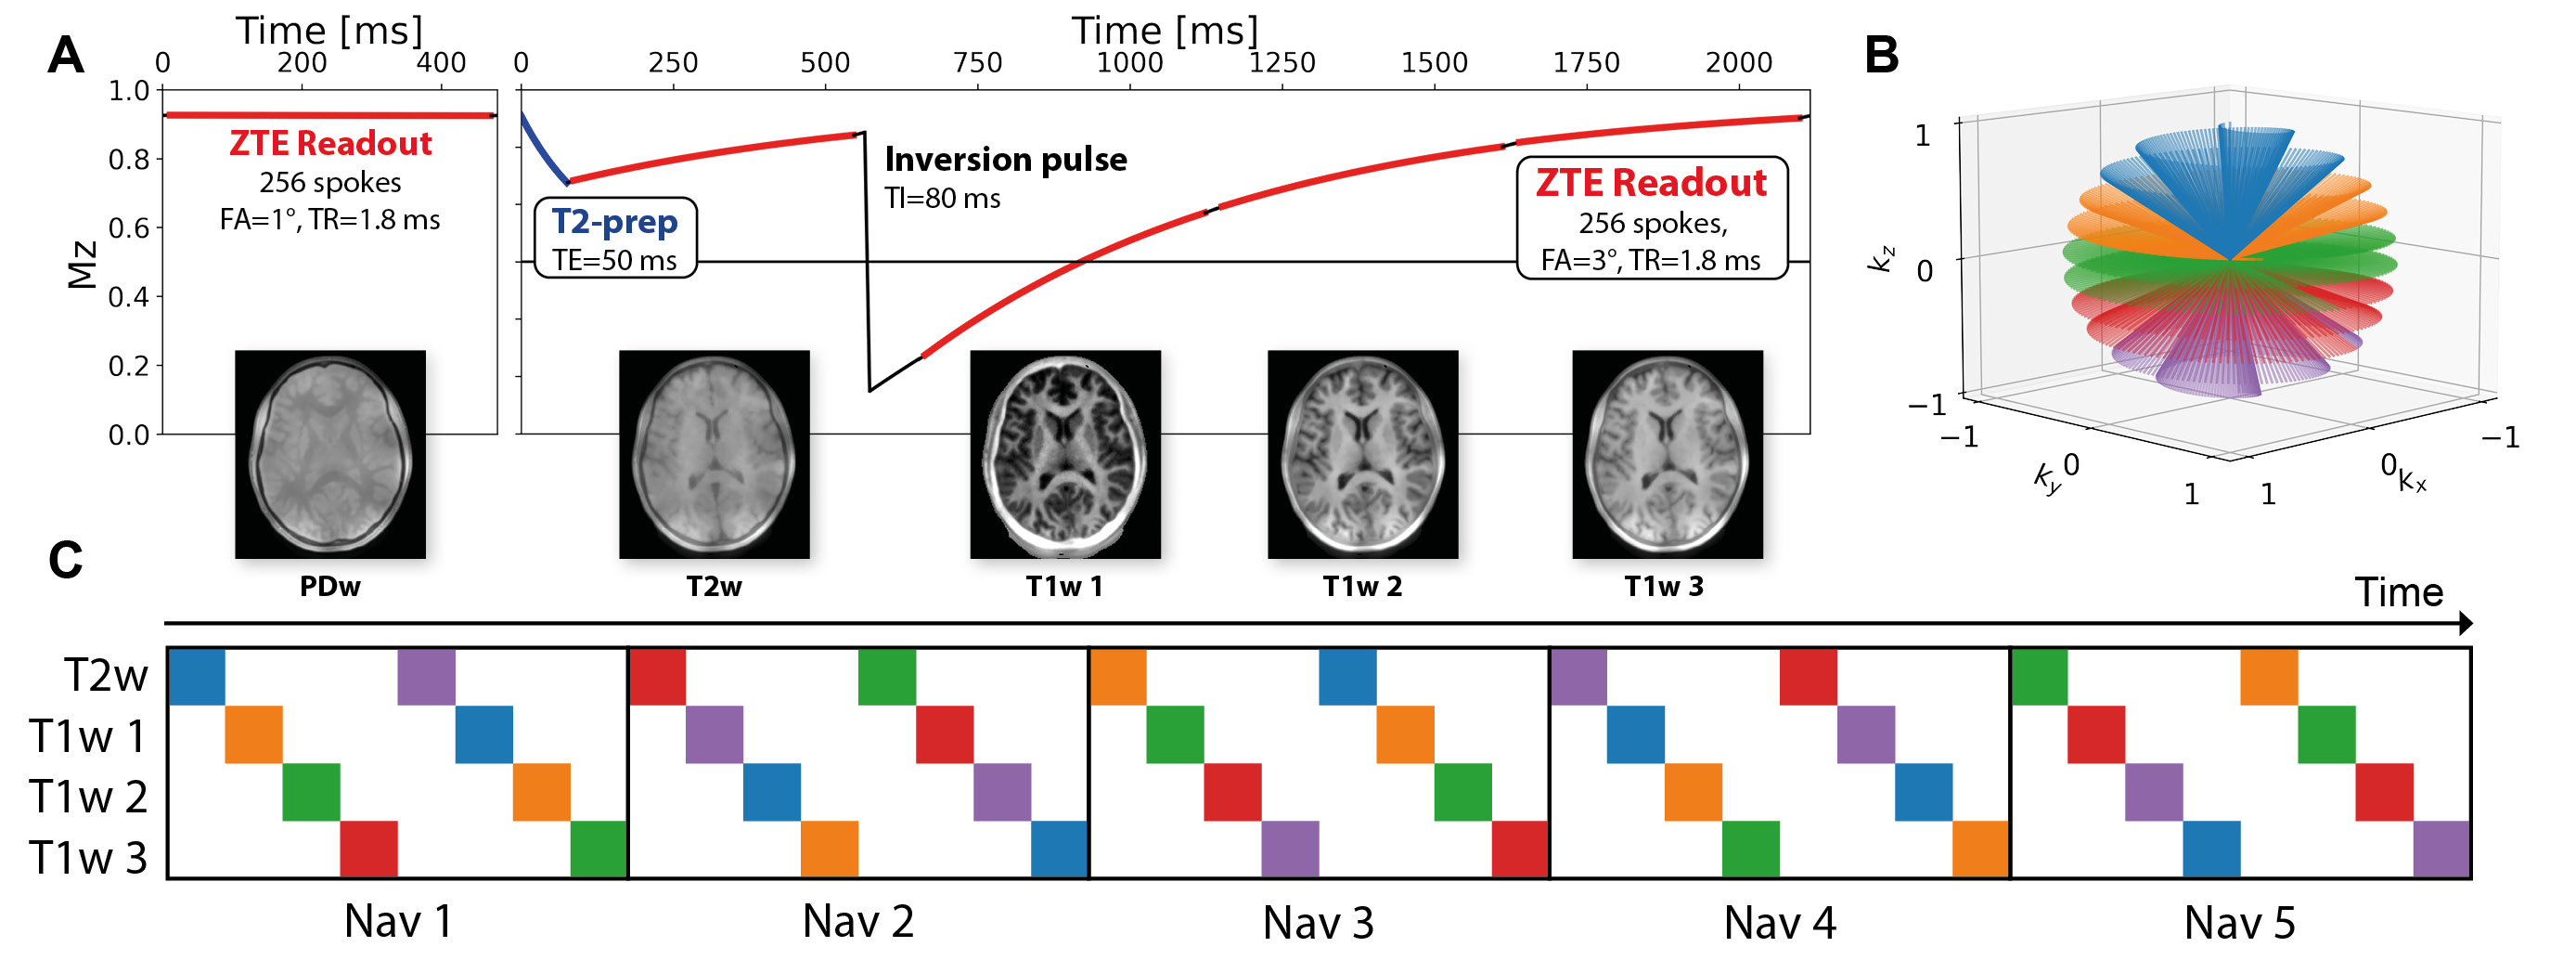
FIGURE 1: (A) Structure and acquisition parameters of the multi-contrast ZTE sequence showing one repetition of the acquisition, i.e., one segment for the PD weighted and four segments for the T1/T2 weighted parts respectively. (B) Plot of a single spiral phyllotaxis interleave where each colour-coded section acquires one segment. (C) Schematic of the distribution of contrast weightings for each segment in a navigator. Navigators are reconstructed from each set of eight segments to maintain equivalent image contrast between navigators.
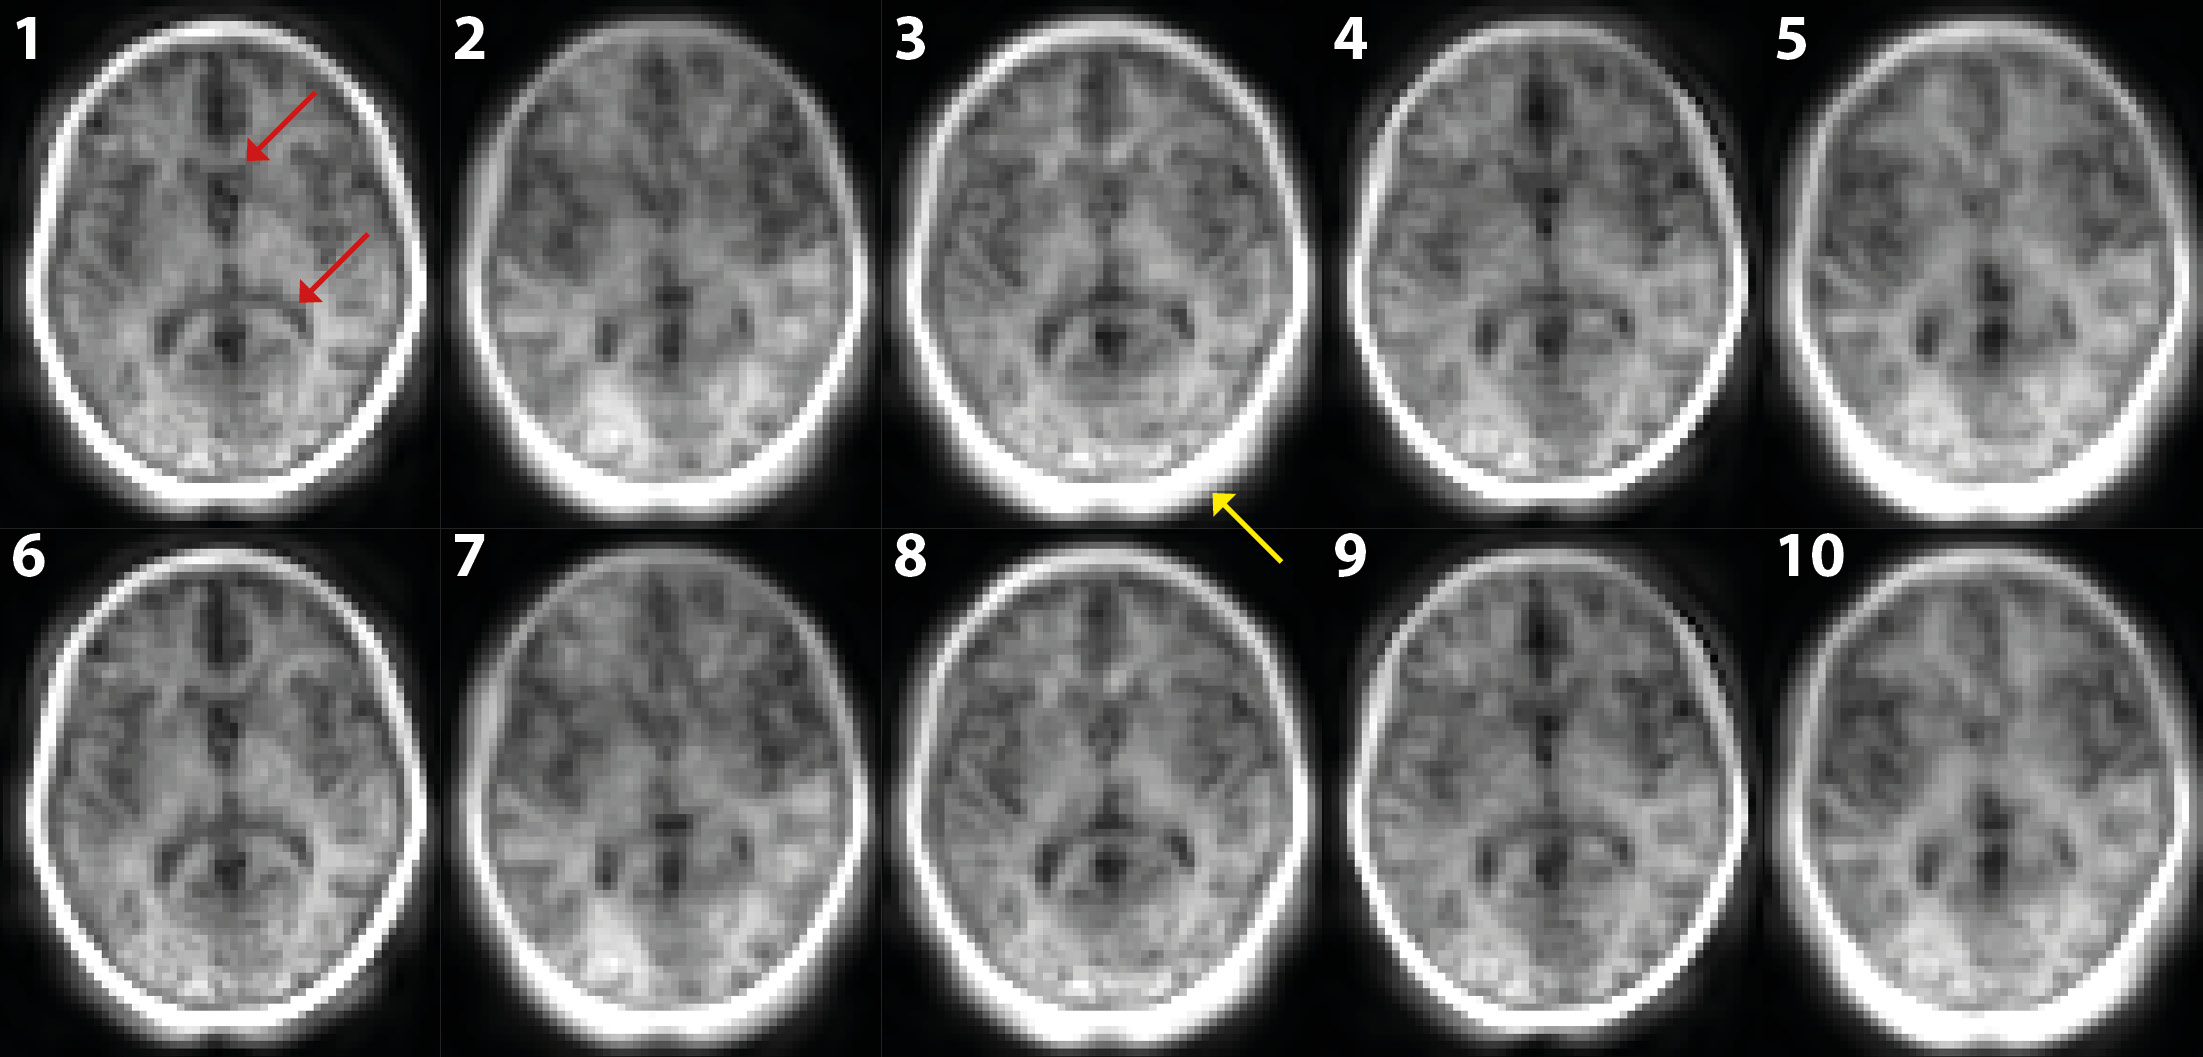
FIGURE 2: The first ten navigator images demonstrating similar image contrast but variation in image features, such as ventricle delineation (red arrows), and signal around the skull (yellow arrows). The variation in image features appears to repeat after 5 navigators.
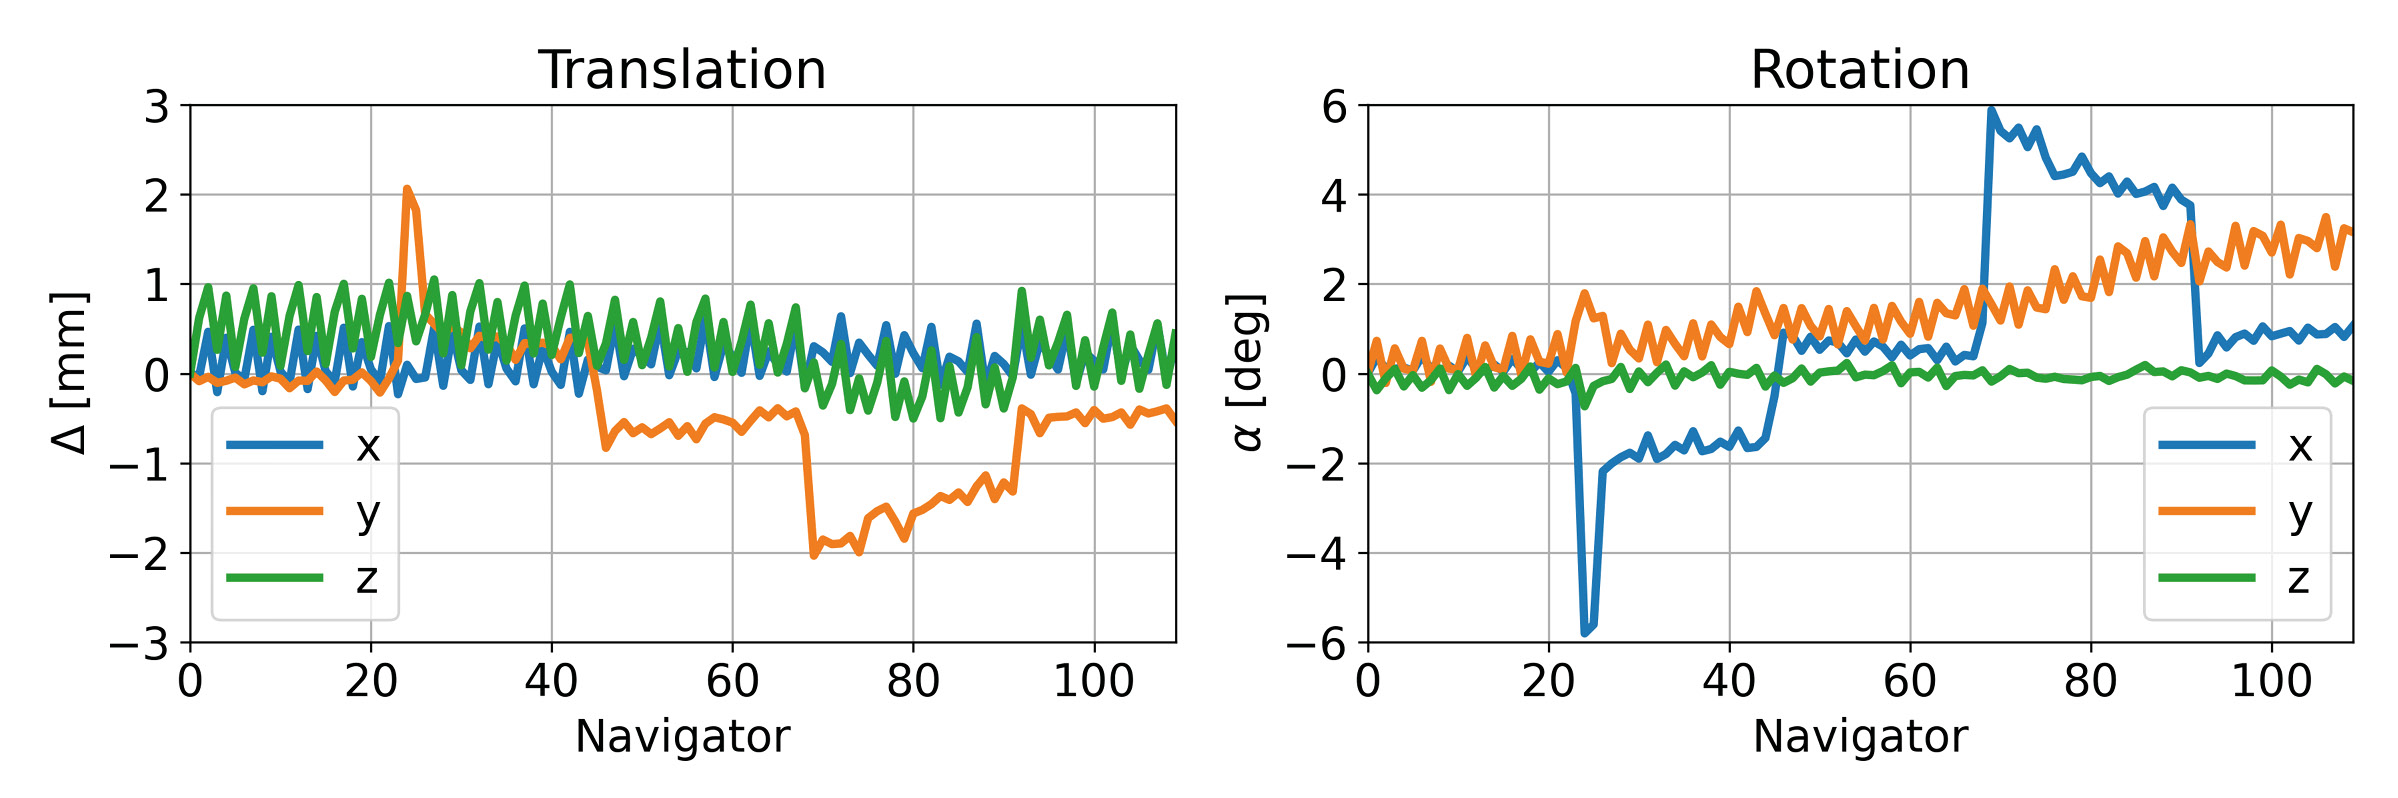
FIGURE 3: Estimated motion parameters during the T1/T2 part of the acquisition (no motion during the PD part). The repositioning of the subject is observed in both the rotation and translation. An oscillation is visible in the z translation and y rotation estimate, which is likely to be an artefact and not true motion.
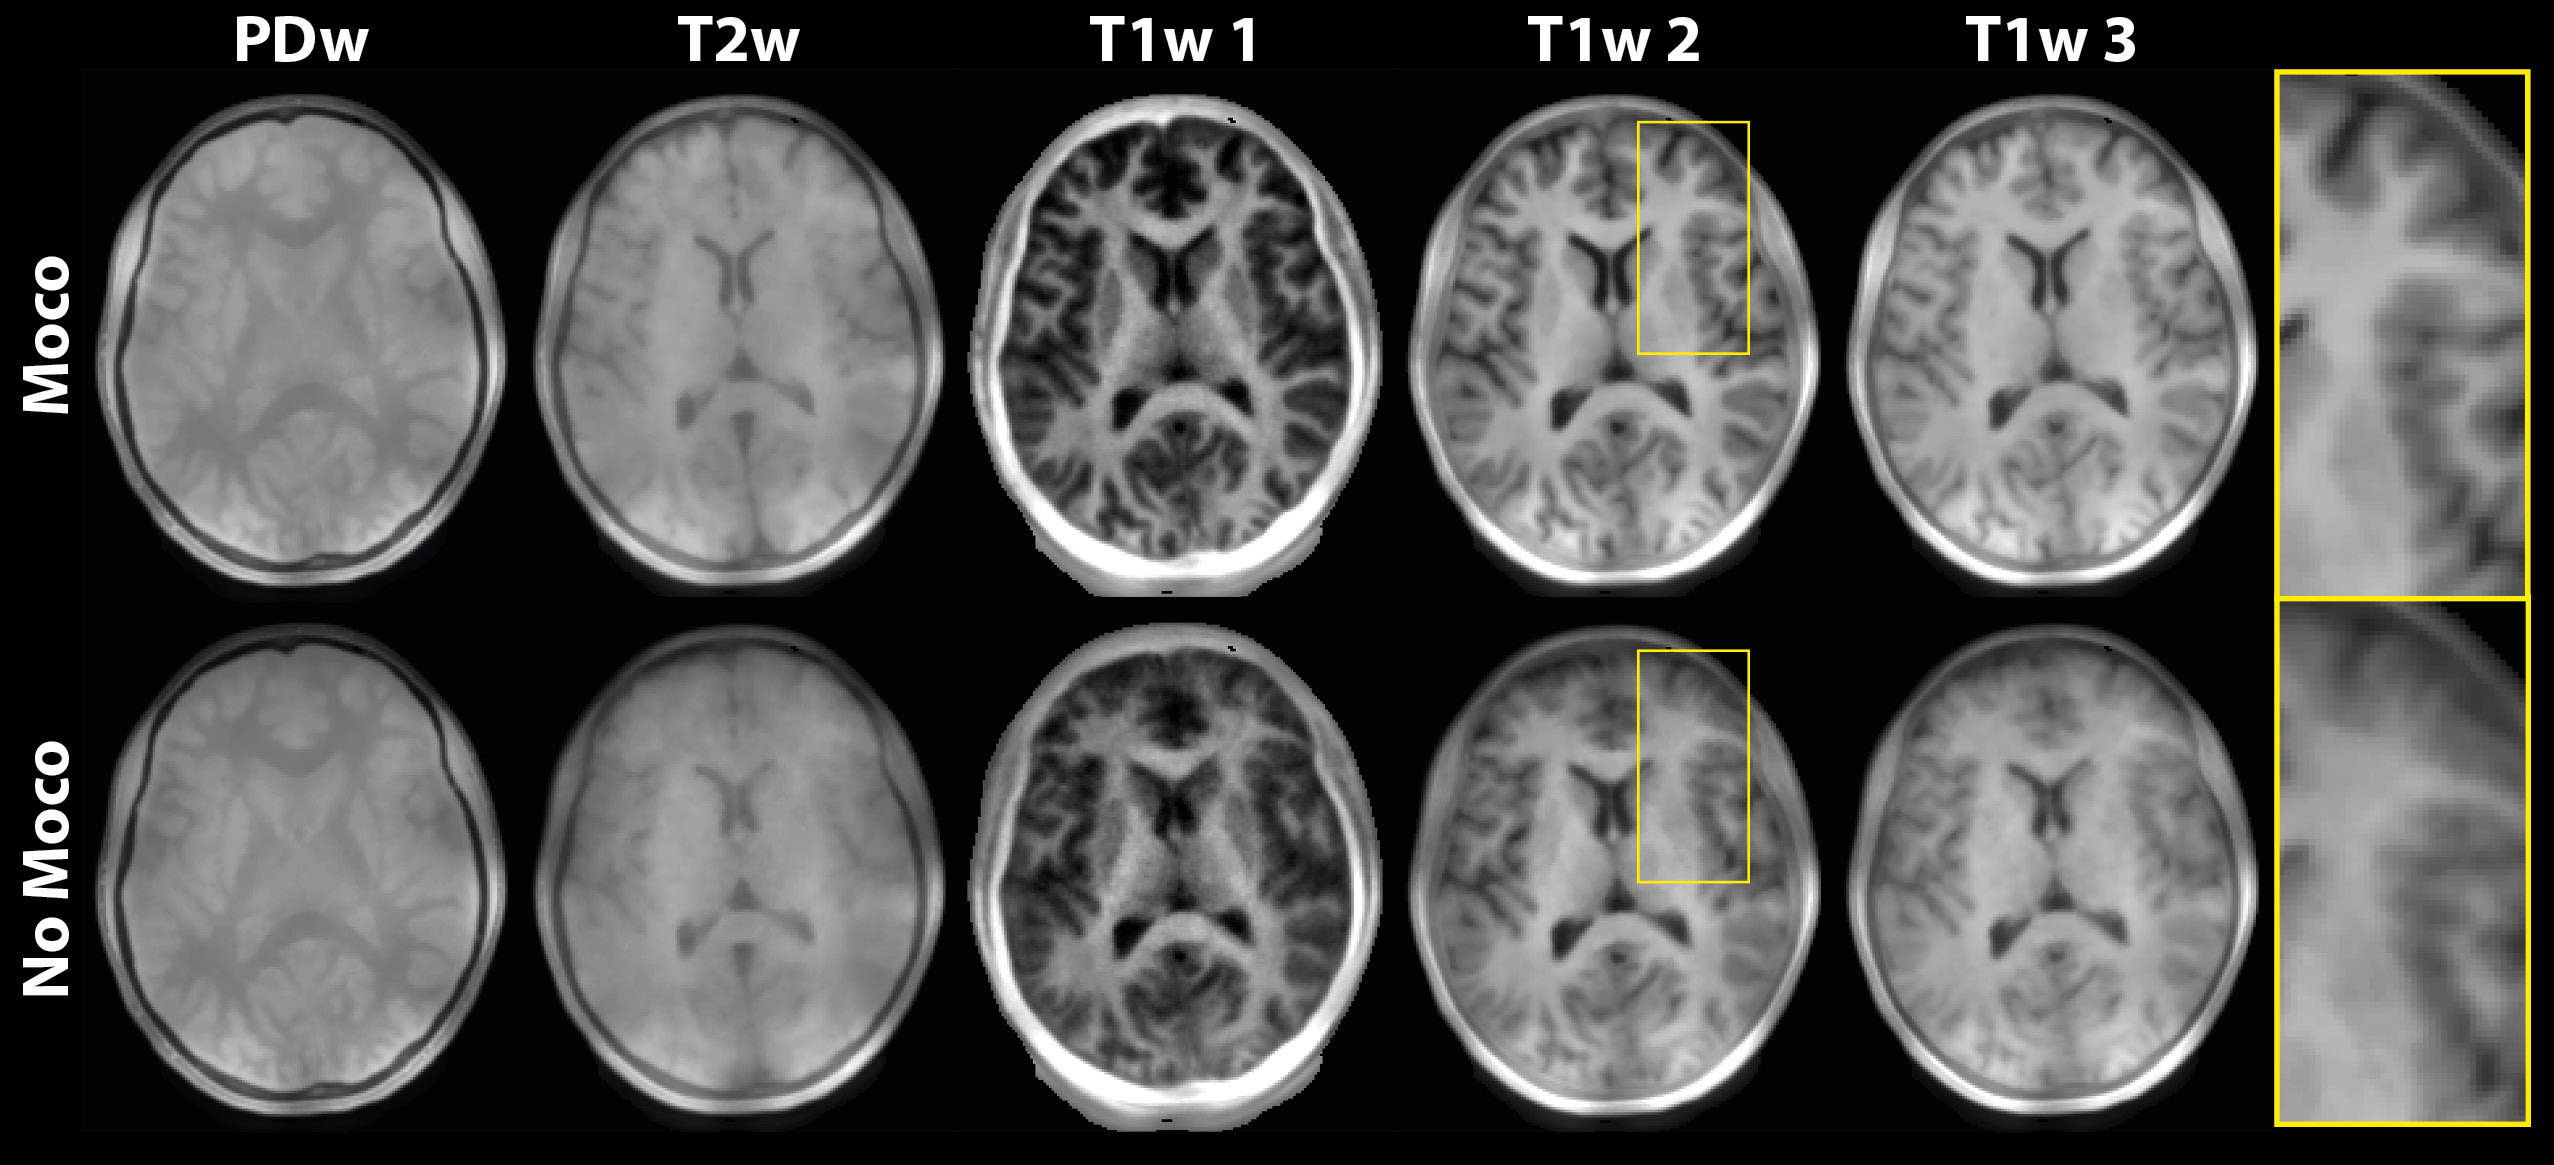
FIGURE 4: Reconstructed
individual contrast images from the PD and multi-contrast acquisition, with and
without motion correction. Blurring is observed in the images without motion
correction, especially visible in cortical regions. (Real part of images are
shown. Note that different window levels are used.)
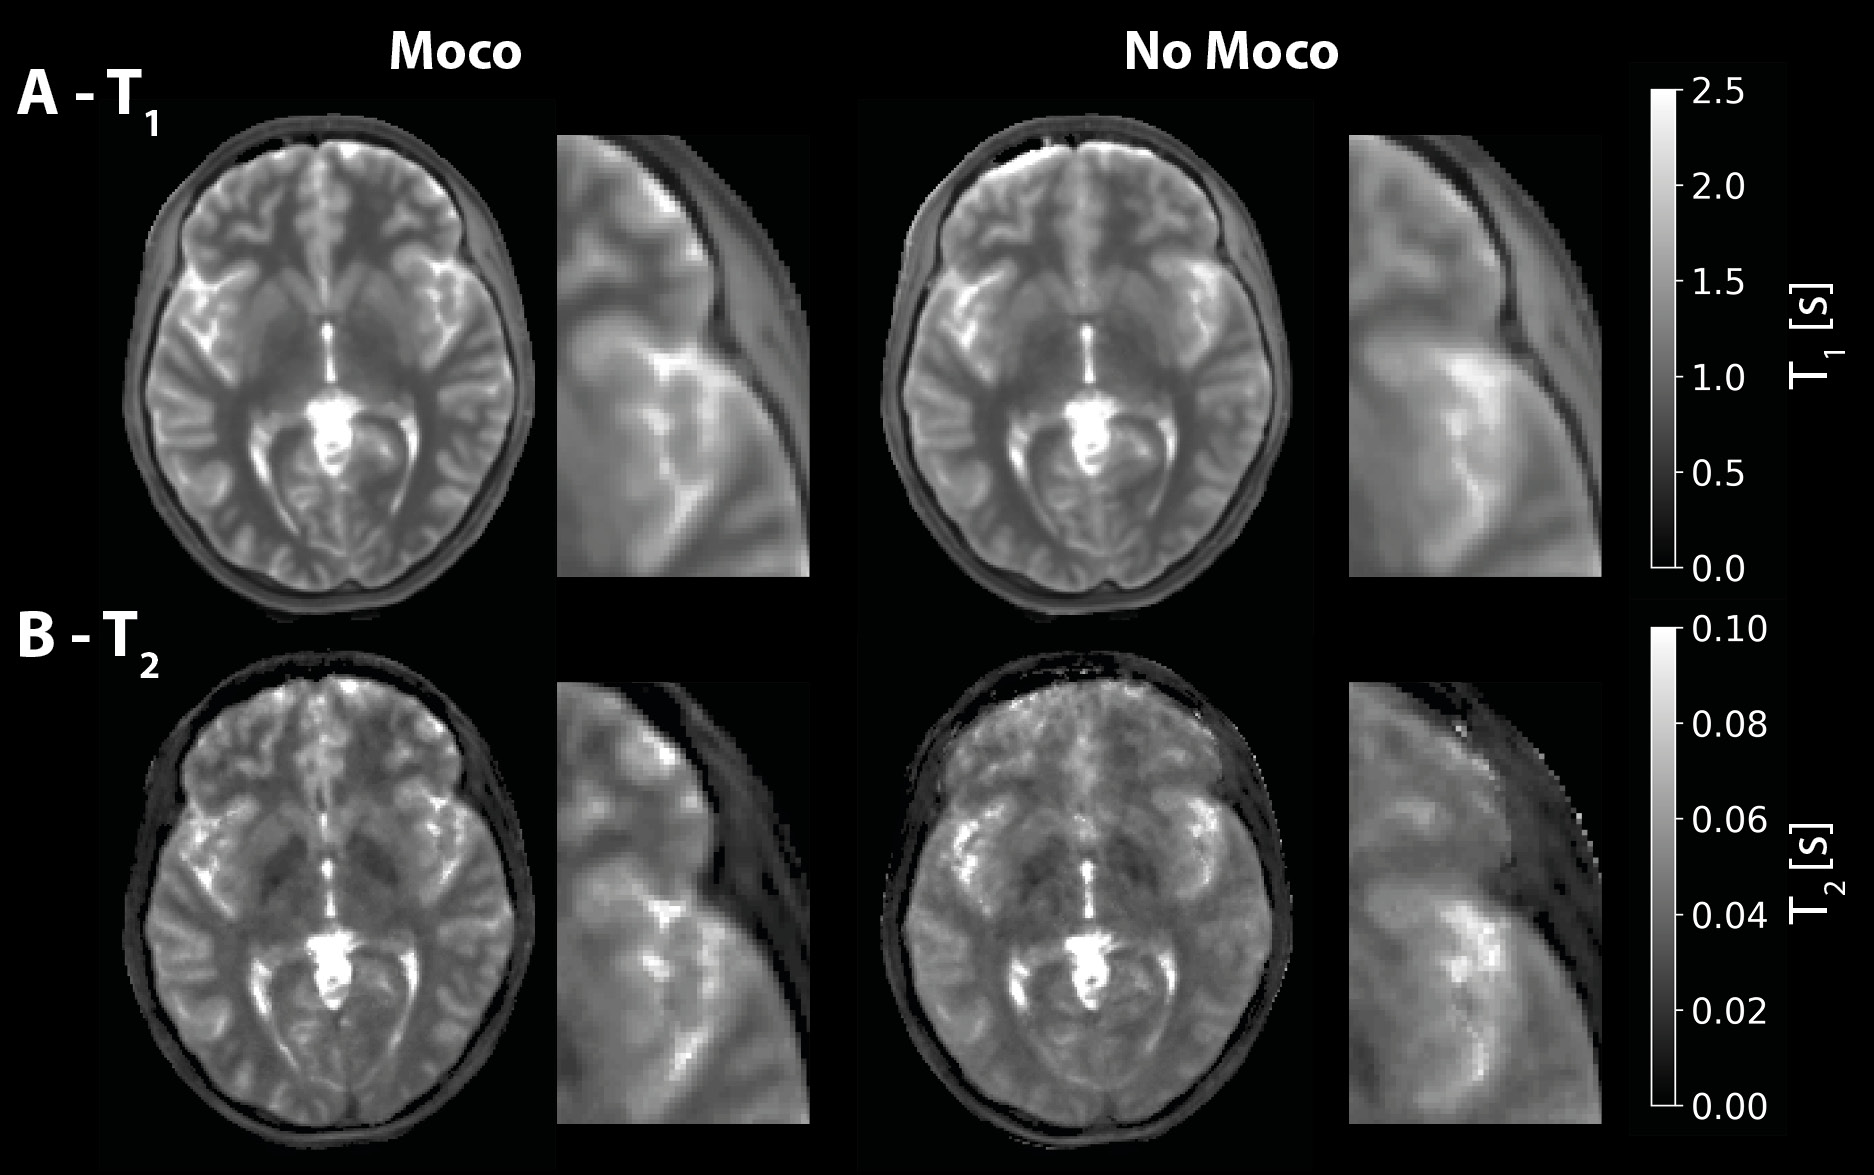
FIGURE 5: Parameter maps of T1 (A) and T2 (B) with and without motion correction, demonstrating improved image quality with motion correction, especially in the T2-map.
DOI: https://doi.org/10.58530/2022/0351