0349
Cartilage T2 Relaxation Times are Related to Walking Asymmetries in Osteoarthritic Knees1Steadman Philippon Research Institute, Vail, CO, United States
Synopsis
In this exploratory study, we examine relationships between joint function and cartilage composition in individuals with knee osteoarthritis (OA). MRI T2 relaxation times were used to assess articular cartilage and joint kinematics were recorded over walking gait cycles using video-motion analysis. There were significant correlations between cartilage T2 relaxation times and knee flexion, extension, and swing-stance ratio in both affected and contralateral legs. MRI measures of cartilage quality and joint function provide complimentary information that may be useful in measuring disease progression and intervention effectiveness using MRI.
Introduction
Osteoarthritis (OA) is a leading cause of disability in the aging population and is associated with progressively worsening cartilage degeneration, pain and loss of joint function1,2. OA is primarily diagnosed through radiographic evaluation and a history of pain during movement3 - irreversible findings that exemplify the need for methods for early detection and monitoring of interventions that may slow disease progression. In this exploratory study, we examine relationships between joint function and cartilage composition in individuals with knee OA as a basis for informing future analysis of treatment efficacy in an ongoing clinical study.Methods
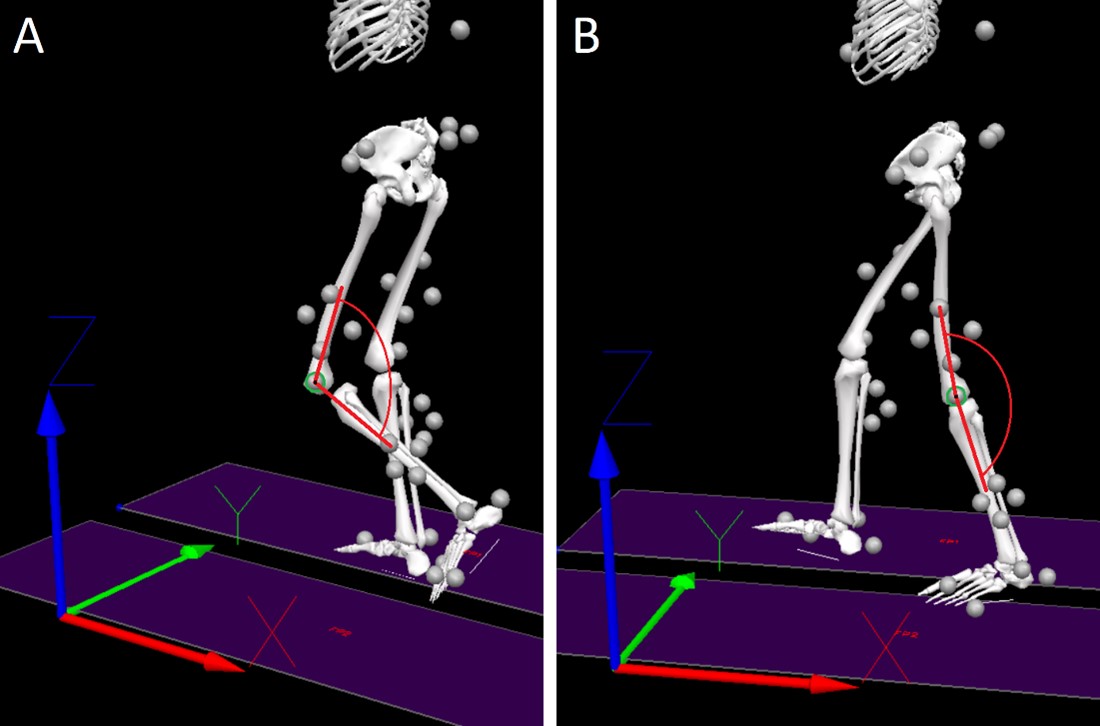
Data was obtained from 14 participants with knee osteoarthritis (7 female, aged 62 ± 10 y, BMI 26.6 ± 4.3 kg/m2, Kellgren-Lawrence grade 2-4) participating in a clinical study investigating senolytics for the treatment of osteoarthritis (IRB # 2019-16, NCT04210986). Only data from the baseline visit (prior to therapy) was used. The affected knees were scanned with a 16 channel knee coil on a 3T MRI system (SkyraFit, Siemens Healthineers) implementing a double-echo in steady state (DESS: matrix = 256 x 208, voxel = 0.55 mm x 0.55 mm x 0.70 mm, TR = 13.48 ms, TE = 4.79 ms) sequence for cartilage segmentation and a multi-echo spin echo (MESE: matrix = 256 x 256, voxel = 0.55 mm x 0.55 mm x 2mm, TR = 2780 ms, TEs = 13.8/27.6/41.4/55.2/69/82.8/96.6 ms) sequence for T2 relaxation time mapping. The femoral, tibial, and patellar cartilage were first manually segmented from DESS images using Materialize Mimics software. T2 maps were created using MapIt software and registered to DESS images in Mimics. Cartilage masks were applied to T2 maps to extract quantitative measures, and visualized by projecting the cartilage surfaces onto a 2D plane as described previously4,5. Additionally, participants walked at 0.8-1 m/s on a treadmill to capture kinematic measurements of both legs using a video-motion analysis system (Oqus and Qualisys AB; 18 infrared, 12-megapixel cameras). The average peak knee flexion and extension angles (Figure 1), adduction moments and swing-stance ratio were recorded for both the affected and contralateral legs over 15 gait cycles (Visual3D software, C-Motion Inc.). The range of motion was compared between legs (RoM, %), as well as the time during the gait cycle spent with both feet on the ground (double support time, %). Correlations between average cartilage T2 relaxation times and gait metrics were compared using a Pearson’s correlation coefficient (alpha = 0.05).Results
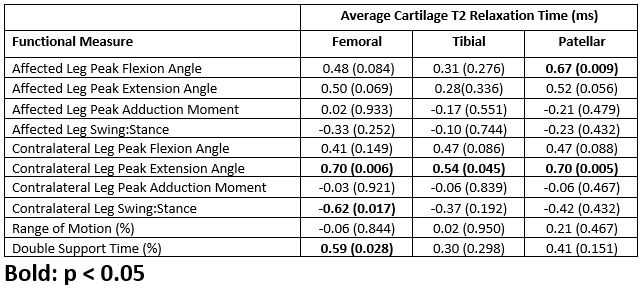
The average T2 relaxation time of patellar cartilage was moderately correlated with the peak knee flexion angle of the affected leg (R = 0.67, p = 0.009) (Table 1). The average femoral cartilage T2 relaxation time was moderately correlated with the double support time (R = 0.59, p = 0.028) and moderately negatively correlated with the contralateral leg swing-stance ratio (R = -0.62, p = 0.017). All cartilage relaxation times were moderately correlated with the contralateral leg peak extension angle (Table 1). Representative 2D projections of affected knee cartilage T2 relaxation time maps and contralateral knee angles during walking are shown for subjects with high and low knee extension angles (Figure 2).Discussion
There were significant correlations between joint function and cartilage composition as measured using T2 relaxation times. Elevated T2 relaxation times, representing a greater degree of cartilage degradation, were associated with a decreased ability to fully extend the contralateral leg during walking (higher knee extension angle). Further, elevated femoral cartilage T2 relaxation times were associated with a greater proportion of the gait cycle spent with two feet on the ground and with the contralateral leg in stance. Though the sample size is small, results suggest that cartilage quality measures in the affected knee are related to gait asymmetries, which may result from discomfort in the affected joint.Acknowledgements
The authors would like to thank the following for their part in data collection: Carly Lockard; Nathan Dulude; Kimi Dahl; Amanda Vinson.
We received research support from the United Stated Department of Defense Contract # N00014-19-C-2052.
References
1. James S. L., Abate D., Abate K. H., et. al. Global, regional, and national incidence, prevalence, and years lived with disability for 354 Diseases and Injuries for 195 countries and territories, 1990-2017: a systematic analysis for the Global Burden of Disease Study. Lancet 2018; 392: 1789-1858.
2. Menon J. and Mishra P. Health care resource use, health care expenditures and absenteeism costs associated with osteoarthritis in US healthcare system. Osteoarthr Cartil. 2018; 26(4): 480-484.
3. Abramoff, B. Osteoarthritis: Pathology, Diagnosis, and Treatment Options. Med. Clin. North Am. 2020; 104(2): 293–311.
4. Monu U., Jordan C.D., Samuelson B.L. et al. Cluster Analysis of Quantitative MRI T2 and T1p Relaxation Times of Cartilage Identifies Differences between Healthy and ACL-injured Individuals at 3T. Osteoarthr Cartil. 2017; 25(4): 513-520.
5. Black M., Yoon D., Young K., et al. Detecting Early Changes in ACL-Reconstructed Knee Cartilage: Cluster Analysis of T2 Relaxation Times in Superficial and Deep Cartilage and ADC Analysis. Proc Intl Soc Mag Reason Med. 2019; abstract #1322.
Figures