0347
Bi-exponential UTE-T2* Evaluation of Longitudinal Changes in Knee Cartilage Over 2 Years Following Anterior Cruciate Ligament Reconstruction
Ashley A Williams1,2, Yongxian Qian3,4, and Constance R Chu1,2
1Orthopaedic Surgery, Stanford University, Stanford, CA, United States, 2Veterans Affairs Palo Alto Health Care System, Palo Alto, CA, United States, 3Department of Radiology, New York University Grossman School of Medicine, New York, NY, United States, 4Center for Biomedical Imaging, NYU Langone Health, New York, NY, United States
1Orthopaedic Surgery, Stanford University, Stanford, CA, United States, 2Veterans Affairs Palo Alto Health Care System, Palo Alto, CA, United States, 3Department of Radiology, New York University Grossman School of Medicine, New York, NY, United States, 4Center for Biomedical Imaging, NYU Langone Health, New York, NY, United States
Synopsis
This work evaluates mono- and bi-exponential UTE-T2* relaxation in 6 tread mark regions of knee cartilage of 18 participants with ACL-injury prior to reconstruction surgery and in 15/18 participants 2 years after surgery. Bi-exponential T2*short had a smaller fractional contribution than T2*long in all regions examined. However, T2*short accounted for a higher fraction of total signal in deep cartilage layers compared to superficial. While both mono- and bi-exponential UTE-T2* analyses showed significant longitudinal changes, bi-exponential analyses did not exceed the sensitivity of mono-exponential UTE-T2* for detection of knee cartilage compositional changes over the first two years following ACL reconstruction.
Introduction
Bi-exponential UTE-T2* relaxation of knee cartilage in ACL tear (ACLT) and ACL-reconstructed (ACLR) cohorts have not been examined. For other short-T2 tissues, such as tendons and menisci, the short-component of bi-exponential T2* analyses showed greater sensitivity to intra-substance degenerative changes1-3 than long-components or mono-exponential assessment. The goal of this work is to evaluate bi-exponential UTE-T2* relaxation mapping of human knee cartilage early after ACL injury and to examine longitudinal changes in bi-exponential UTE-T2* components following ACLR. We hypothesize that the short-component of bi-exponential UTE-T2* relaxation will be more sensitive to cartilage compositional changes over 2 years following ACLR than mono-exponential UTE-T2*.Methods
Mono- and bi-exponential UTE-T2* relaxation was measured in the knee cartilage of 18 participants with ACL-injury prior to reconstruction surgery and in 15/18 of the participants who returned for follow-up imaging 2 years after ACLR. All subjects provided informed consent for these IRB-approved studies. 3-D AWSOS (Acquisition-Weighted Stack of Spirals)4 images were acquired using a 3T Siemens MAGNETOM Trio scanner and an 8-channel knee coil (In vivo Inc.). Eleven images at TE=0.6-40ms were collected with a 140mm FOV and 256x256 matrix for 547µm resolution in-plane and 2mm section thickness. Other acquisition parameters were: 60 slices, 24 in-plane spirals, 11.52ms spiral readout time, 5µs data sampling interval, and FA/TR 30/80ms. Scan time was 1.92 min per TE-image. TE images were interpolated to a 512x512 matrix prior to T2 relaxation fitting. Pixel-by-pixel mono- and bi-exponential T2 fits5; 6 were generated with pM2 software (General Labs Cloud, LLC). UTE-T2* relaxation components were assessed in “tread mark” regions of interest (ROIs) on 6 cartilage surfaces including the medial and lateral femurs and tibial plateaus, patella and trochlea7; 8 using custom MATLAB software (TheMathWorks, Inc.), Figure 1. The tread marks were 10mm wide (medial to lateral) manually segmented from 5 contiguous slices from the center of their respective compartments. Full-thickness, superficial and deep cartilage layers were separately assessed in each tread mark region. Identical cartilage masks were applied to all relaxation parameter maps, Figure 2. UTE-T2* relaxation component values were averaged across all voxels within a tread mark, or tread mark layer, for each participant and time-point. Normality was assessed by Shapiro-Wilk tests. Longitudinal changes in UTE-T2* relaxation components between the pre-surgery and 2-year post-ACLR imaging sessions were assessed with two-tailed paired t-tests (or Wilcoxin signed-rank tests for non-normally distributed data). Statistical analyses were performed with SPSS (v25, IBM).Results
Bi-exponential UTE-T2* Cartilage Relaxation Components After ACLTTwelve of the 18 participants underwent pre-surgical UTE-T2* imaging within 3 months of their ACL injuries. A description of both mono-exponential UTE-T2* (T2*mono) relaxation times and bi-exponential short (T2*short) and long (T2*long) UTE-T2* relaxation times, as well as the fraction of the total signal from each bi-exponential component in these 12 participants is reported in Table 1. The fractional contributions of T2*short and T2*long varied with cartilage region and layer, but T2*short had a smaller fractional contribution than the T2*long in all regions examined. However, T2*short accounted for a higher fraction of total signal in deep cartilage layers compared to superficial. While both the T2*mono and T2*long relaxation times were higher in superficial compared to deep cartilage, T2*short was lower in superficial compared to deep cartilage in all compartments except the patella.
Longitudinal Changes in Bi-exponential UTE-T2* Cartilage Relaxation Components After ACLR
Two-year follow-up MRI for 14/15 longitudinal subjects were adequate for bi-component analyses. Both mono- and bi-exponential UTE-T2* analyses showed significant changes over the first 2 years following ACLR, Table 2. T2*mono decreased 12% and 24% in deep cartilage of the medial femur and tibia (p=0.017, 0.006, respectively). In superficial cartilage, T2*mono decreased 5% on the patella but increased 7% on the trochlea (p=0.032, 0.042, respectively). Bi-exponential T2*long decreased 24% in deep medial tibial cartilage (p=0.016), and the fraction of signal due to T2*short decreased 29% in superficial trochlear cartilage (p=0.003, with complimentary increased fraction from T2*long). Although, bi-exponential analysis suggested trends for additional longitudinal changes of T2*short, T2*long, and their fractional intensities, no other significant bi-exponential UTE-T2* component changes were observed. No changes were detected in full-thickness cartilage regions by either mono- or bi-exponential analyses.
Discussion
In this small cohort, T2*short was not found to be more sensitive than T2*mono to knee cartilage compositional changes in weight-bearing condylar cartilage over 2 years following ACLR. Notably, decreases to T2*mono detected in deep medial femoral tread marks were consistent with decreases previously reported in much smaller, single-slice ROIs of these same participants.9 Of interest, T2*mono in the broader tread mark analyses detected decreases in deep medial tibial cartilage that were not previously observed with the smaller ROIs. Bi-exponential analysis suggests that these decreases are due to greater mobility of the water contributing to T2*long. Changes to the relative contributions of T2*short and T2*long in superficial trochlear cartilage and an attendant lengthening of T2*mono may be indicative of loosening of the superficial matrix in response to altered loading following ACLR in these regions.7Conclusion
While bi-exponential analyses did not exceed the sensitivity of mono-exponential UTE-T2* for detection of cartilage compositional changes following ACLR in this initial study, the data supports further investigation of regional differences to bi-exponential changes in larger cohorts.Acknowledgements
NIH RO1 AR052784 (PI – CR Chu) and DOD W81XWH-18-1-0590 (PI-CR Chu).References
- Juras V, Apprich S, Szomolanyi P, et al. 2013. Bi-exponential T2 analysis of healthy and diseased Achilles tendons: an in vivo preliminary magnetic resonance study and correlation with clinical score. Eur Radiol 23(10):2814-2822.
- Juras V, Apprich S, Zbyn S, et al. 2014. Quantitative MRI analysis of menisci using biexponential T2* fitting with a variable echo time sequence. Magn Reson Med 71(3):1015-1023.
- Kijowski R, Wilson JJ, Liu F. 2017. Bicomponent ultrashort echo time T2* analysis for assessment of patients with patellar tendinopathy. J Magn Reson Imaging 46(5):1441-1447.
- Qian Y, Boada FE. 2008. Acquisition-weighted stack of spirals for fast high-resolution three-dimensional ultra-short echo time MR imaging. Magn Reson Med 60(1):135-145.
- Qian Y, Williams AA, Chu CR, et al. 2010. Multicomponent T2* mapping of knee cartilage: Technical feasibility ex vivo. Magn Reson Med 64(5):1426-1431.
- Qian Y, Williams AA, Chu CR, et al. 2013. Repeatability of ultrashort echo time-based two-component T2* measurements on cartilages in human knee at 3 T. Magn Reson Med 69(6):1564-1572.
- Williams AA, Erhart-Hledik JC, Asay JL, et al. 2021. Patient-Reported Outcomes and Knee Mechanics Correlate With Patellofemoral Deep Cartilage UTE-T2* 2 Years After Anterior Cruciate Ligament Reconstruction. Am J Sports Med 49(3):675-683.
- Williams AA, Titchenal MR, Do BH, et al. 2019. MRI UTE-T2* shows high incidence of cartilage subsurface matrix changes 2 years after ACL reconstruction. J Orthop Res 37(2):370-377.
- Chu CR, Williams AA, West RV, et al. 2014. Quantitative Magnetic Resonance Imaging UTE-T2* Mapping of Cartilage and Meniscus Healing After Anatomic Anterior Cruciate Ligament Reconstruction. Am J Sports Med 42(8):1847-1856.
Figures
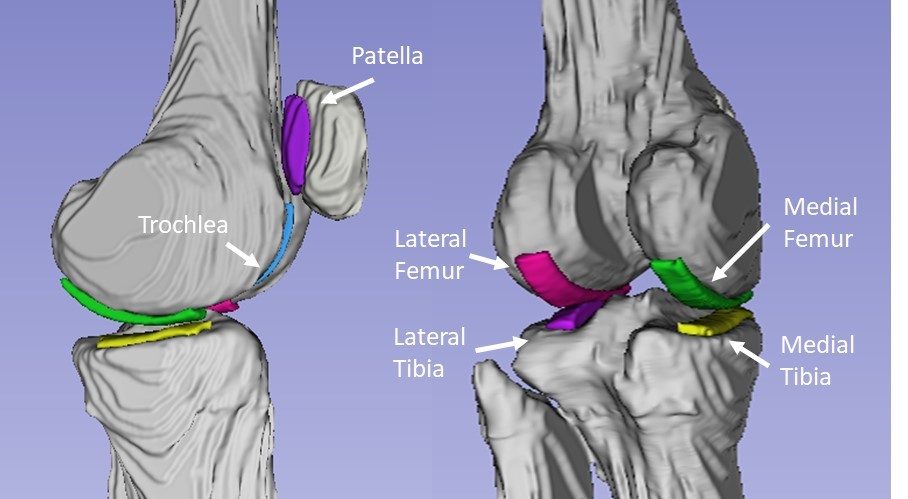
Figure 1. Tread mark regions of
interest. Each tread mark was manually
segmented from 5 contiguous slices.
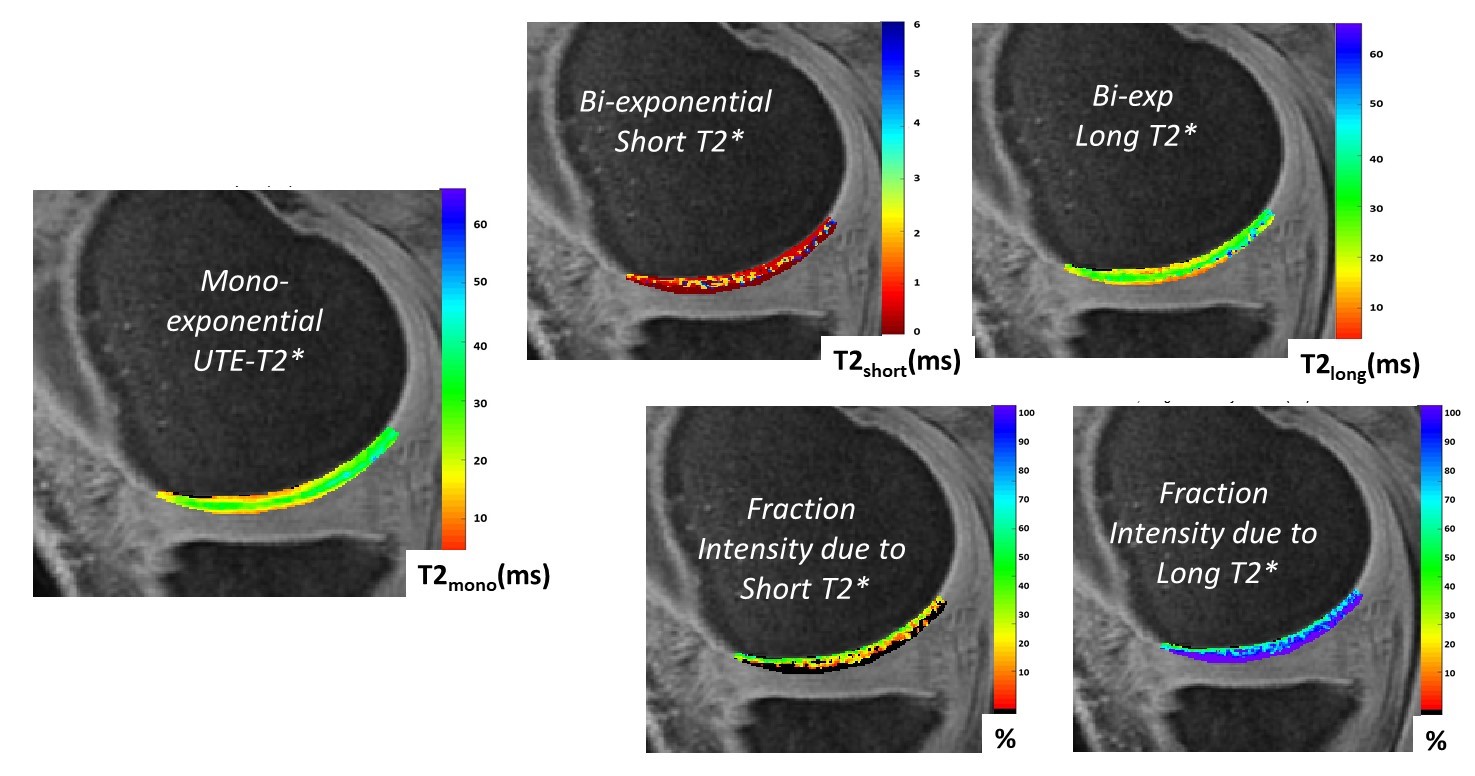
Figure 2.
Sample mono- and bi-exponential UTE-T2* component maps from the center
of a medial femoral tread mark region.
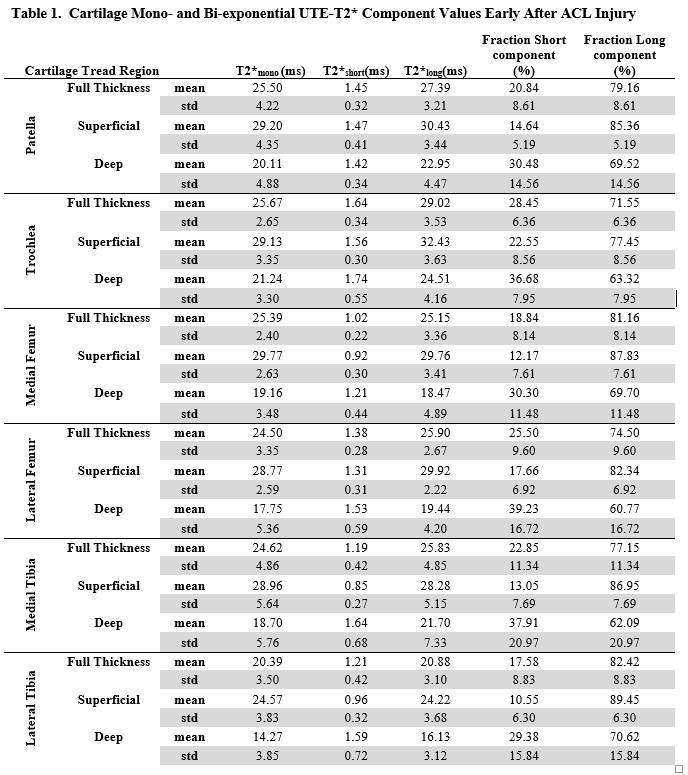
Table 1
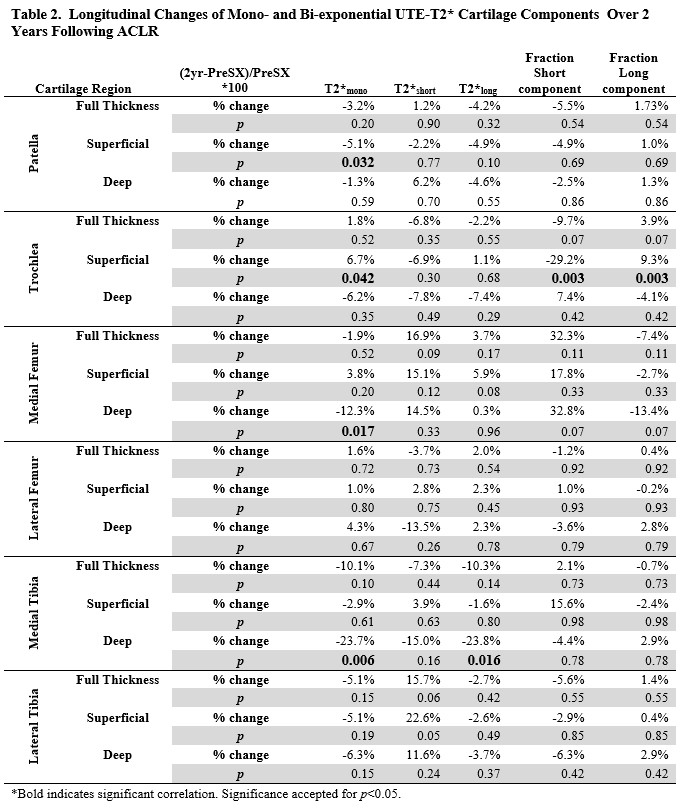
Table 2
DOI: https://doi.org/10.58530/2022/0347