0345
Deep Learning Predicts Synthetic T1rho Maps from T2 Maps for Knee MRI1Department of Bioengineering, University of California Berkeley, Berkeley, CA, United States, 2Department of Radiology and Biomedical Imaging, University of California San Francsico, San Francisco, CA, United States
Synopsis
This study explores the use a deep learning network to generate T1rho maps from T2 maps for knee MRI. T1rho maps have clinical value in the diagnosis of osteoarthritis in addition to T2 maps while T2 maps are more widely adopted and available in clinical datasets. This study found synthetic T1rho maps images maintain excellent fidelity for data collected in a research setting while performance is reduced for data collected in a clinical setting. This work elucidates the promise of deep learning in accelerating imaging protocols through domain adaptation as opposed to more common reconstruction approaches.
Introduction
Osteoarthritis (OA) is an irreversible disease characterized in part by degeneration of the protective cartilage between bones, necessitating early detection. Unlike conventional MRI sequences, compositional sequences like T1rho and T2 mapping afford sensitivity to early biochemical changes in cartilage, such as extracellular matrix degradation1 and decreases in proteoglycan content that can precede morphological changes2. As such, T1rho mapping is one promising avenue for early OA detection, but it suffers from long acquisition times and SAR concerns that prevent widespread adoption in the clinic3-5. On the other hand, T2 mapping has been more widely adopted for clinical and research purposes, and has been acquired in the absence of T1rho mapping in large studies like the Osteoarthritis Initiative. An algorithm that predicts T1rho maps from T2 maps would be useful in adding new information to improve clinical outcomes and open possibilities for further investigations from large cohort studies that have acquired T2 maps.Methods
Image Acquisition and SegmentationMagnetization-prepared angle-modulated partitioned k-space spoiled gradient echo snapshots (MAPSS) T1rho/T2 mapping echo images were acquired in 844 knees across 573 healthy and diseased patients6. Scans were done in the sagittal plane at 3T using GE MR750 scanners and QT8PAR knee coils across three studies: UCSF study (research setting), UCSF/MAYO/HSS multi-center study (research setting), or in addition to a clinical protocol (clinical setting). Echo images were acquired using a spin-lock or fast-spin echo sequence with fat suppression (TSL=0/2/4/8/12/20/40/80 or 0/10/40/80ms; spin-lock= 500Hz; TE=0, 12.9, 25.7, 51.4ms or 2.9/13.6/24.3/45.6ms; TR=1.2s; FOV=14cm; slice thickness=4mm; reconstructed matrix=256x256; bandwidth readout= ±62.5 kHz; 64-view acquisition). To calculate T2 or T1rho maps, all echo images relevant to the given preparation were extracted and registered to the TE/TSL=0ms shared echo using a 3D rigid registration algorithm with a normalized mutual information criterion7. Levenberg-Marquardt fitting of registered echos yielded ground truth T1rho and T2 maps8. Cartilage segmentations were obtained from the TE=0ms echo using a 3D V-Net architecture for the UCSF and multi-center studies, and through manual annotation of images from the clinical protocol. Input slices were split into training, validation, and testing sets such that each subject was only in one set and each study was similarly represented.
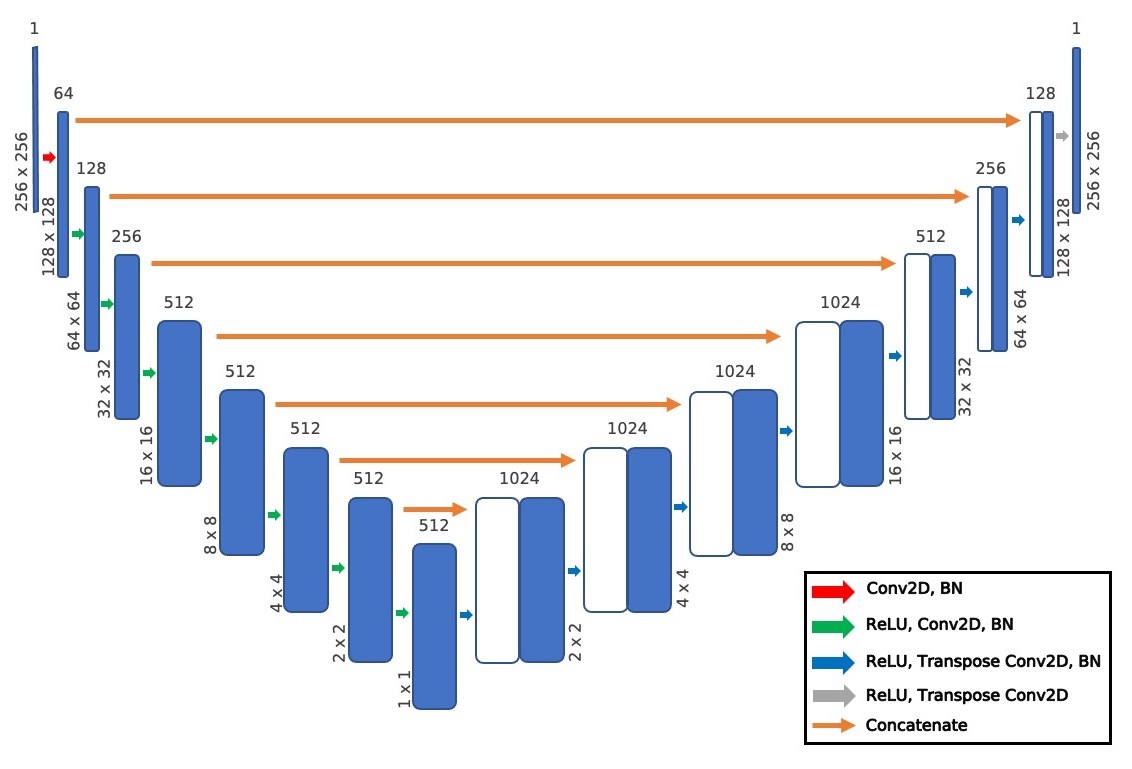
Training
A U-Net encoder-decoder network (Fig. 1) was trained to predict T1rho images from T2 map images. A hyperparameter search identified the optimal loss function, intensity scaling of input images, learning rate, and number of epochs to minimize the normalized root mean squared error (NRMSE) between the predicted and ground truth images. Performance was evaluated using the NRMSE, structural similarity (SSIM), peak signal-to-noise ratio (PSNR), and visual inspection.
Results
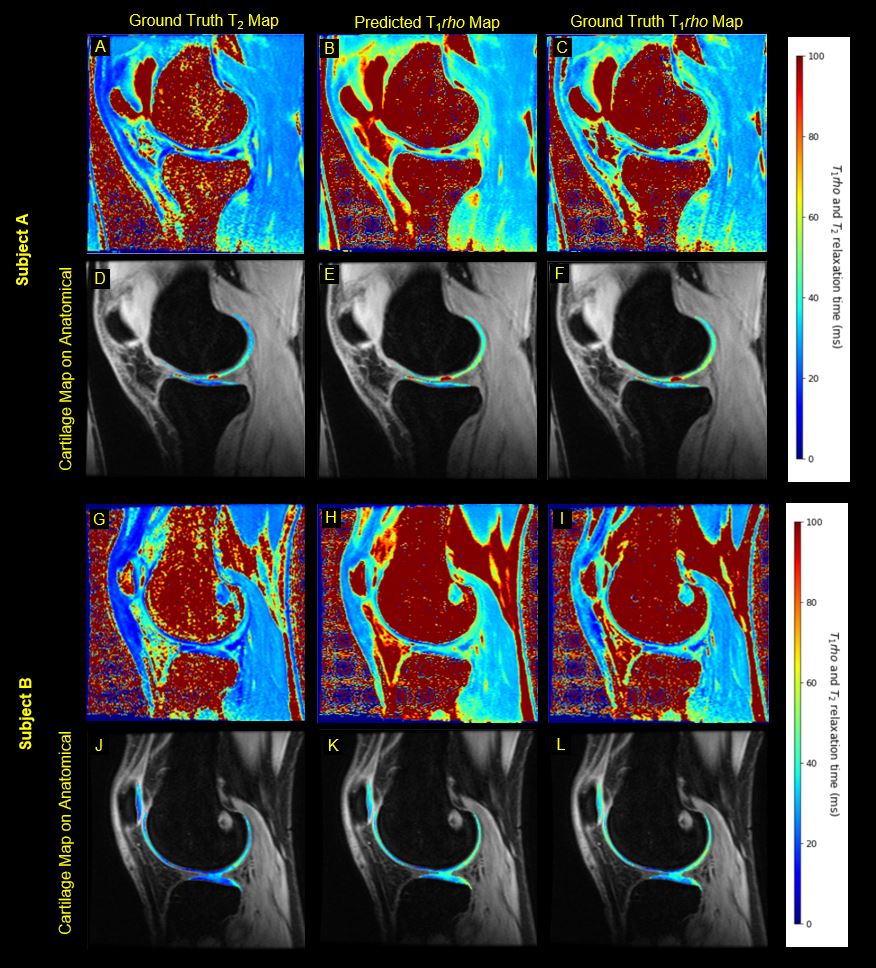
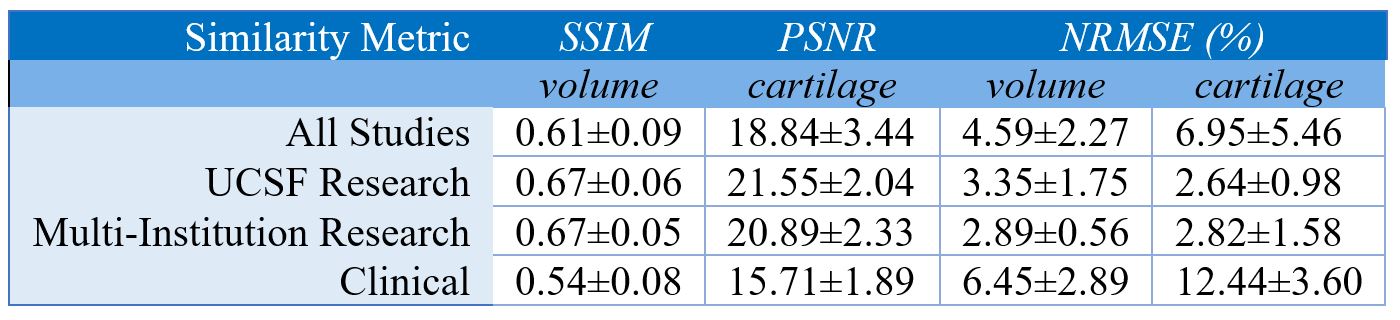
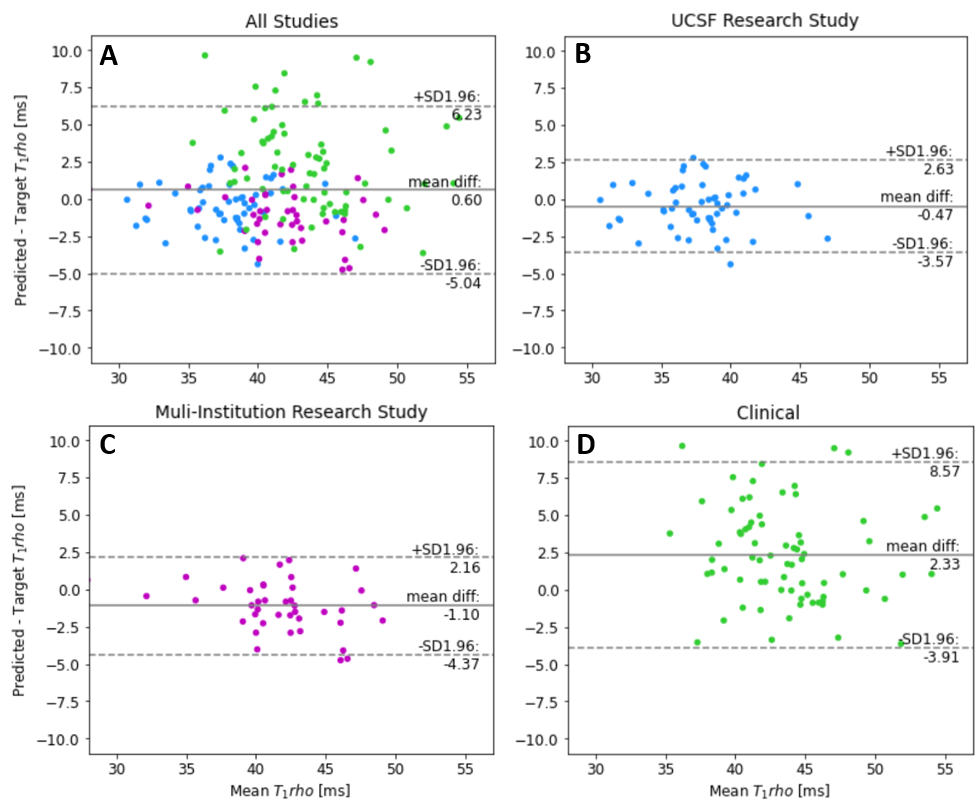
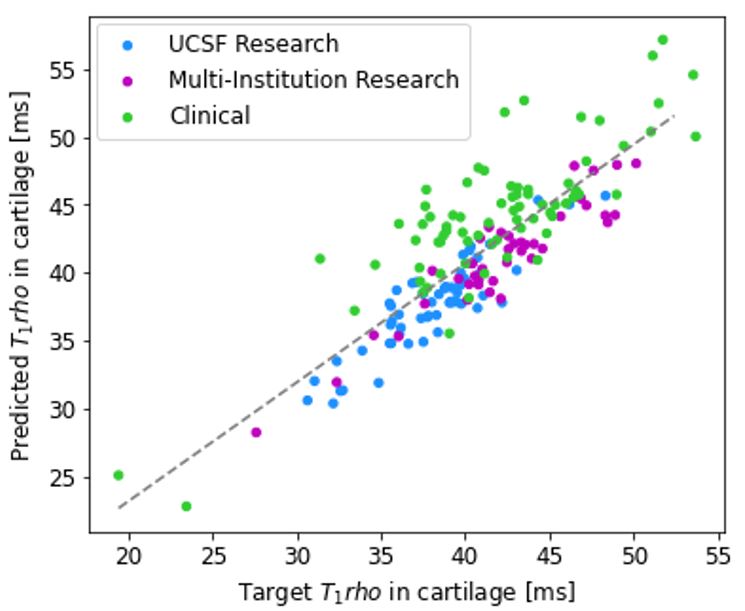
Input, ground truth, and predicted maps for two subjects whose images both were acquired in research settings are shown in Fig. 2. Predicted T1rho maps maintain excellent fidelity to ground truth in both cases visually and have NRMSEs under 2.5% for both patients. Notably, patterns in T1rho cartilage were preserved despite ground truth T2 maps exhibiting much different textures and elevation patterns, particularly in central tibial cartilage.Model evaluation metrics are calculated and reported in Fig. 3. Performance in patients whose images were acquired in research settings was especially strong, maintaining NRMSEs comfortably under 3%; although performance decreased in the less controlled clinical acquisitions. Bland-Altman plots in Fig. 4 emphasize these trends, as plots among patients in both research settings (UCSF and Multi-Institutional) showed very tight limits of agreement and minimal bias in predicted T1rho cartilage maps, while limits were wider despite the line of equality being contained in clinical settings. For all studies, correlation plots and Pearson’s r revealed strong correlations between predicted and ground truth T1rho in cartilage (Fig. 5).
Discussion and Conclusions
The encoder-decoder pipeline generates T1rho maps that maintain strong fidelity to ground truth, especially for maps acquired in research settings. Notably, predicted maps indicate the network generated new information not present in input T2 maps. In Fig. 2, while there is some degree of correlation across ground truth T1rho and T2 values, there are substantial differences between observed T1rho and T2 map patterns in the central tibial cartilage regions of both patients. Despite these correlations, the network provides strong reconstructions of this region in both cases.Past studies have shown that 6.4% changes in T1rho values can be clinically significant9. For patients whose images were acquired under research conditions, T1rho predictions were far beneath this threshold. This indicates the pipeline’s promise in generating high quality maps with acceptable quantification errors. In the more uncontrolled clinical environment, quantification error rates were 12.4% which is well above this threshold. Further development is needed to make the network robust to poorer quality control procedures that are likely seen in clinical acquisitions of this sequence as opposed to research.
This work elucidates the promise of deep learning in accelerating imaging protocols through domain adaptation as opposed to more common reconstruction approaches. With further development, a pipeline like this could extract additional diagnostic information from already acquired T2 maps. Future work may consider image texture analysis and alterations to the network and training procedures to improve the generalizability of the network.
Acknowledgements
We would like to acknowledge AF ACL consortium, and our funding sources NIH UH3AR076724 and NIHR01AR078762.
References
[1] Le J, Peng Q, Sperling K. Biochemical magnetic resonance imaging of knee articular cartilage: T1rho and T2 mapping as cartilage degeneration biomarkers. Ann N Y Acad Sci. 2016 Nov;1383(1):34-42. doi: 10.1111/nyas.13189. Epub 2016 Jul 29. PMID: 27472534.
[2] Soellner ST, Goldmann A, Muelheims D, Welsch GH, Pachowsky ML. Intraoperative validation of quantitative T2 mapping in patients with articular cartilage lesions of the knee. Osteoarthr Cartil. 2017;25:1841-1849.
[3] Han M, Tibrewala R, Bahroos E, Pedoia V, Majumdar S. Magnetization-prepared spoiled gradient-echo snapshot imaging for efficient measurement of R2 -R1ρ in knee cartilage. Magn Reson Med. 2021 Sep 30.
[4] Pedoia V, Haefeli J, Morioka K, Teng HL, Nardo L, Souza RB, Ferguson AR, Majumdar S. MRI and biomechanics multidimensional data analysis reveals R2 -R1ρ as an early predictor of cartilage lesion progression in knee osteoarthritis. J Magn Reson Imaging. 2018 01; 47(1):78-90.
[5] Russell C, Pedoia V, Majumdar S, AF-ACL Consortium Composite metric R2 - R1ρ (1/T2 - 1/T1ρ ) as a potential MR imaging biomarker associated with changes in pain after ACL reconstruction: A six-month follow-up. J Orthop Res. 2017 03; 35(3):718-729.
[6] Li X et al. Simultaneous acquisition of T1r and T2 quantification in knee cartilage – reproducibility and diurnal variation. J Magn Reson Imaging. 2014;39:1287-1293.
[7] Weingärtner S. Manual for RView. https://biomedic.doc.ic.ac.uk/uploads/Internal/rviewManual. Published February 16, 2010. Accessed July 2, 2021
[8] More JJ. The Levenberg-Marquardt algorithm: Implementation and theory. In: Watson G.A. (eds) Numerical Analysis. Lecture Notes in Mathematics, vol 630. Springer, Berlin, Heidelberg. https://doi.org/10.1007/BFb0067700.
[9] Stahl, R., Luke, A., Li, X. et al. T1rho, T2 and focal knee cartilage abnormalities in physically active and sedentary healthy subjects versus early OA patients—a 3.0-Tesla MRI study. Eur Radiol 19, 132–143 (2009). https://doi.org/10.1007/s00330-008-1107-6
Figures