0344
DTI of articular cartilage can predict 3-year radiographic progression in OA patients at early stage of disease1NYU Langone Medical Center, New York, NY, United States, 2Fundacion Santa Fe de Bogota, Bogota, Colombia, 3Penn Medicine, Philadelphia, PA, United States
Synopsis
The goal of this study is to validate DTI of articular cartilage at 3T as a biomarker for OA progression in a population at early stages of the disease and high likelihood of short-term progression. The goal of this study is to validate DTI of articular cartilage at 3T as a biomarker for OA progression in a population at early stages of the disease and high likelihood of short-term progression. We show that DTI has potential for prognosis of 3-year radiographic changes in a population with early stages of disease.
Introduction
Assessment of disease progression in patients with incipient osteoarthritis (OA) remains a major challenge in the field of OA research.1 Quantitative imaging biomarkers have the advantage of being sensitive to changes in cartilage composition, which represent an early feature of the disease.There are several MRI biomarkers for articular cartilage that have potential as subrogate measures of cartilage composition.2 Although many parameters have shown sensitive to proteoglycan content, we lack biomarkers truly specific for collagen.2 DTI was introduced as a biomarker specific for proteoglycan content (MD) and collagen structure (FA) and has demonstrated to be a promising biomarker to diagnose OA.3-6
The goal of this study is to validate DTI of articular cartilage at 3T as a biomarker for OA progression in a population at early stages of the disease and high likelihood of short-term progression.
Methods
Study designSixty subjects (male/female=23/37, age=61±8 y, BMI=30.7±6.4 kg/cm2) with unilateral knee OA (symptomatic with Kellgren-Lawrence [KL] grade of 2 or higher) and incipient knee OA (asymptomatic with KL grade of 1) and no history of injury in the contralateral knee were recruited. We focused on the knee with KL score 1 since they are at an early stage of disease and have high likelihood of progression according to data from the OAI. All patients underwent clinical assessment, provided x-ray of the bilateral knees using the Synaflexer positioning device, and the KL 1 knee underwent one hour MRI. Forty subjects returned for 3-years follow-up evaluation, which included clinical assessment and x-ray of the bilateral knees using the Synaflexer positioning device to capture clinical endpoint for progression. 6 baseline MRIs were of poor quality due to patient motion, spike artifacts or the patient not fitting the knee coil.
Progression
All knee x-rays were graded using the KL score. Medial and lateral joint space width was measured in both knees at each time point. Joint space narrowing (JSN) was calculated on the KL 1 knees in the lateral and medial compartments (joint space width at 3-years minus joint space at baseline). A change larger than -0.7 mm in either compartment in a KL 1 knee was considered as radiographic progression.7
MRI and Imaging processing
MRI protocol included clinical knee protocol, and a RAISED sequence for DTI measurements (TE/TR=35/1500 ms, 105 spokes/image, 6 directions, b-values=0,300 s/mm2).8 Diffusion-weighted images were reconstructed using a non-linear motion correction8 and diffusion parameter maps mean diffusivity (MD) and fractional anisotropy (FA) were calculated. MRI were segmented in diffusion. Segmentation was divided into regions: femoral trochlea, lateral femoral condyle, medial femoral condyle, medial tibia, lateral tibia, and patella.
Statistical methods
Pearson or Spearman correlation coefficient were used to investigate the association between baseline MRI parameters and biological variables (age, sex, and BMI) and 3-year radiographic progression (JSN, change in KL grade). Partial correlations were performed to correct for biological variables. Group differences between progressors and non-progressors were assessed using either a two-sided unpaired t-test or Wilcoxon test depending on normality of the data (Kolmogorov-Smirnov test). Finally, we used a stepwise forward algorithm including both biological variables and DTI measures to identify the optimal logistic regression model predicting 3-year progression in JSN. 10-fold cross-validation was used to validate the logistic regression models. Sensitivity specificity, and accuracy were reported.
Results
Radiographic progression12 subjects showed progression based on JSN (2 lateral/10 medial) (see an example in Fig. 1). The average JSN was -0.31±0.66 mm in the medial compartment and +0.06±0.75 mm in the lateral compartment. JSN did not correlate with biological variables.
Prediction of progression
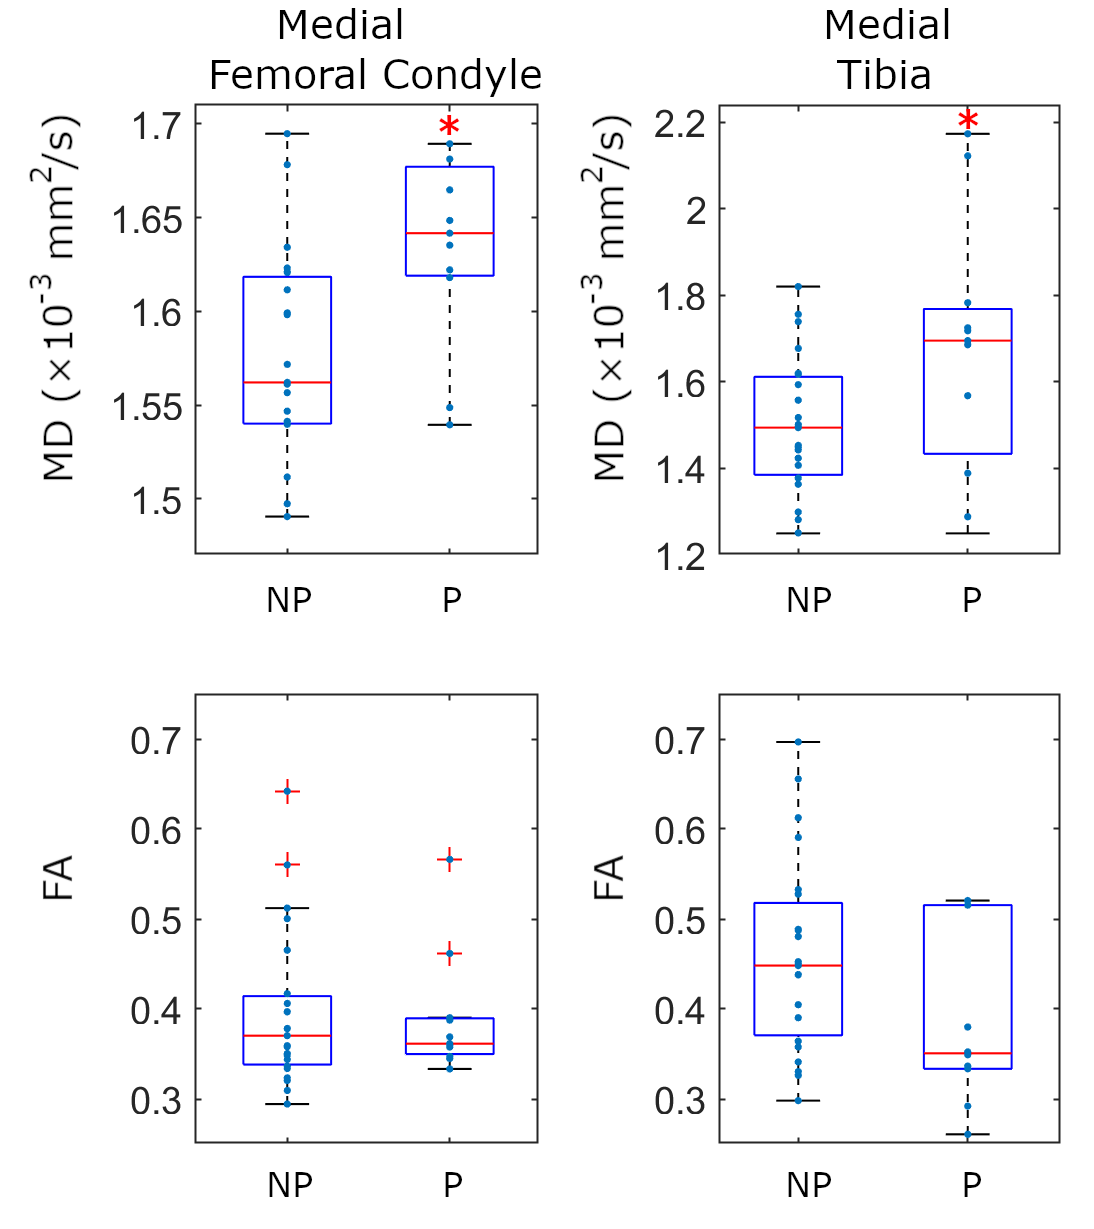
Baseline MD values in the medial femoral condyle and medial tibia were significantly increased in progressors compared to non-progressors (+6.0% and +15.4% respectively, p<0.01, Fig. 2) and had a positive correlation with the 3-year JSN (r=-0.36, p<0.05, Fig. 3). Interestingly, baseline MD and 3-year JSN follwed a similar relationship in the medial and lateral compartments (Fig. 3). Baseline FA was lower in the medial tibia of progressors compared to non-progressors (-10.0%, p=0.07).
Stepwise model algorithm rejected biological variables as predictors of progression (p>0.26). Baseline medial femoral MD was the strongest predictor of progression (p<0.05, Fig 4) and showed an odds-ratio per one-standard deviation (ORSD , SD=0.10×10⁻³ mm2/s) of 6.5 with a 95% confidence interval (95%-CI) [1.3-33.0] (Table 1). An optimal threshold for baseline medial femoral MD of 1.63×10⁻³ mm2/s had accuracy=79.4%, sensitivity=63.6% and specificity=87.0% to predict progression 3 years after. Cross-validation results are summarized in Table 2.
Dscussion
Here we present the first study to validate DTI as a biomarker for OA progression measured in x-rays. X-rays remain the only FDA-approved method to demonstrate structural changes in OA. Since OA progression is more frequent on the medial compartment is natural that MD in the medial compartment is better associated with JSN. DTI seem to be able to predict with a single MRI measure, which is an advantage compared to quantitative morphology that require at least two measures. Finally, the ORSD for MD found in our analysis are relative large compared to biological biomarkers from serum and urine (ORSD between 1.2 and 1.7 for 4-year progression).9Conclusions
DTI has shown potential for prognosis of 3-year radiographic changes in a population with early stages of disease.Acknowledgements
This study has received funding by the (US) National Institute of Arthritis and Musculoskeletal and Skin Diseases (NIAMS) of the National Institute of Health (NIH), Grant/Award Number R01AR067789. The content is solely the responsibility of the authors and does not necessarily represent the official views of the NIH.References
1. Hunter DJ, Schofield D, Callander E. The individual and socioeconomic impact of osteoarthritis. Nature Reviews Rheumatology. 2014;10:437.
2. Hayashi D, Roemer FW, Guermazi A. Magnetic resonance imaging assessment of knee osteoarthritis: current and developing new concepts and techniques. Clin Exp Rheumatol. 2019;37 Suppl 120(5):88-95.
3. Filidoro L, Dietrich O, Weber J, et al. High-resolution diffusion tensor imaging of human patellar cartilage: feasibility and preliminary findings. Magn Reson Med. 2005;53(5):993-998.
4. de Visser SK, Bowden JC, Wentrup-Byrne E, et al. Anisotropy of collagen fibre alignment in bovine cartilage: comparison of polarised light microscopy and spatially resolved diffusion-tensor measurements. Osteoarthritis Cartilage. 2008;16(6):689-697.
5. Raya JG, Arnoldi AP, Weber DL, et al. Ultra-high field diffusion tensor imaging of articular cartilage correlated with histology and scanning electron microscopy. MAGMA. 2011;24(4):247-258.
6. Raya JG, Melkus G, Adam-Neumair S, et al. Change of diffusion tensor imaging parameters in articular cartilage with progressive proteoglycan extraction. Invest Radiol. 2011;46(6):401-409.
7. Bruyere O, Richy F, Reginster JY. Three year joint space narrowing predicts long term incidence of knee surgery in patients with osteoarthritis: an eight year prospective follow up study. Ann Rheum Dis. 2005;64(12):1727-1730.
8. Duarte A, Ruiz A, Ferizi U, et al. Diffusion tensor imaging of articular cartilage using a navigated radial imaging spin-echo diffusion (RAISED) sequence. Eur Radiol. 2019;29(5):2598-2607.
9. Kraus VB, Collins JE, Hargrove D, et al. Predictive validity of biochemical biomarkers in knee osteoarthritis: data from the FNIH OA Biomarkers Consortium. Ann Rheum Dis. 2017;76(1):186-195.
Figures