0343
T1ρ can detect microstructural changes in cartilage induced by conservative interventions: a one-year randomized controlled trial1Radiology, Stanford University, Stanford, CA, United States, 2Musculoskeletal Research Laboratory, VA Palo Alto Healthcare System, Palo Alto, CA, United States, 3Mechanical Engineering, Stanford University, Stanford, CA, United States, 4Bioengineering, Stanford University, Stanford, CA, United States, 5Center for Innovation and Implementation, VA Palo Alto Healtcare System, Palo Alto, CA, United States, 6Musculoskeletal Research Laboratory, VA Palo Alto Healtcare System, Palo Alto, CA, United States
Synopsis
We performed a single-blind randomized clinical trial in subjects with medial knee OA to evaluate the effect of a gait modification. Primary outcomes were pain and KAM (surrogate measure of medial knee loading). We also utilized cartilage T2 and T1ρ to assess (micro)structural changes induced by the treatment. In the Intervention group, we observed a greater reduction in pain and KAM (reduced loading), and less increase in T1ρ in the medial femoral compartment, potentially indicating slowed cartilage degeneration. Our study shows that quantitative cartilage MRI is a promising outcome measure in clinical trial assessing non-surgical treatment for knee OA.
introduction
The knee is the most common site for osteoarthritis (OA) and excessive compressive loading is thought to accelerate OA progression (1). The knee adduction moment (KAM) is a surrogate measure for the medio-lateral distribution of compressive loading and is related to disease progression. Loading can be shifted from the medial to the lateral compartment by reducing the KAM, for instance by modifying the foot progression angle (FPA). Personalizing the FPA is important to maximally reduce the KAM (2) and may improve clinical outcomes compared to uniformly prescribed modifications (3, 4), but it is unclear whether these conservative changes only have an effect on mechanical loading parameters, or if they also affect cartilage (micro)structure. Plain radiographs are typically used in clinical trials for OA, but have limited sensitivity to cartilage and to early stage disease changes. We propose to utilize quantitative MRI as a secondary outcome measure to evaluate disease-modifying interventions for OA. We hypothesized that, compared to sham gait retraining, adopting a personalized FPA modification would reduce pain, decrease medial compartment loading (reduction in KAM), and slow quantitative MRI metrics of OA progression over one year (less increase in T1ρ and T2).Methods
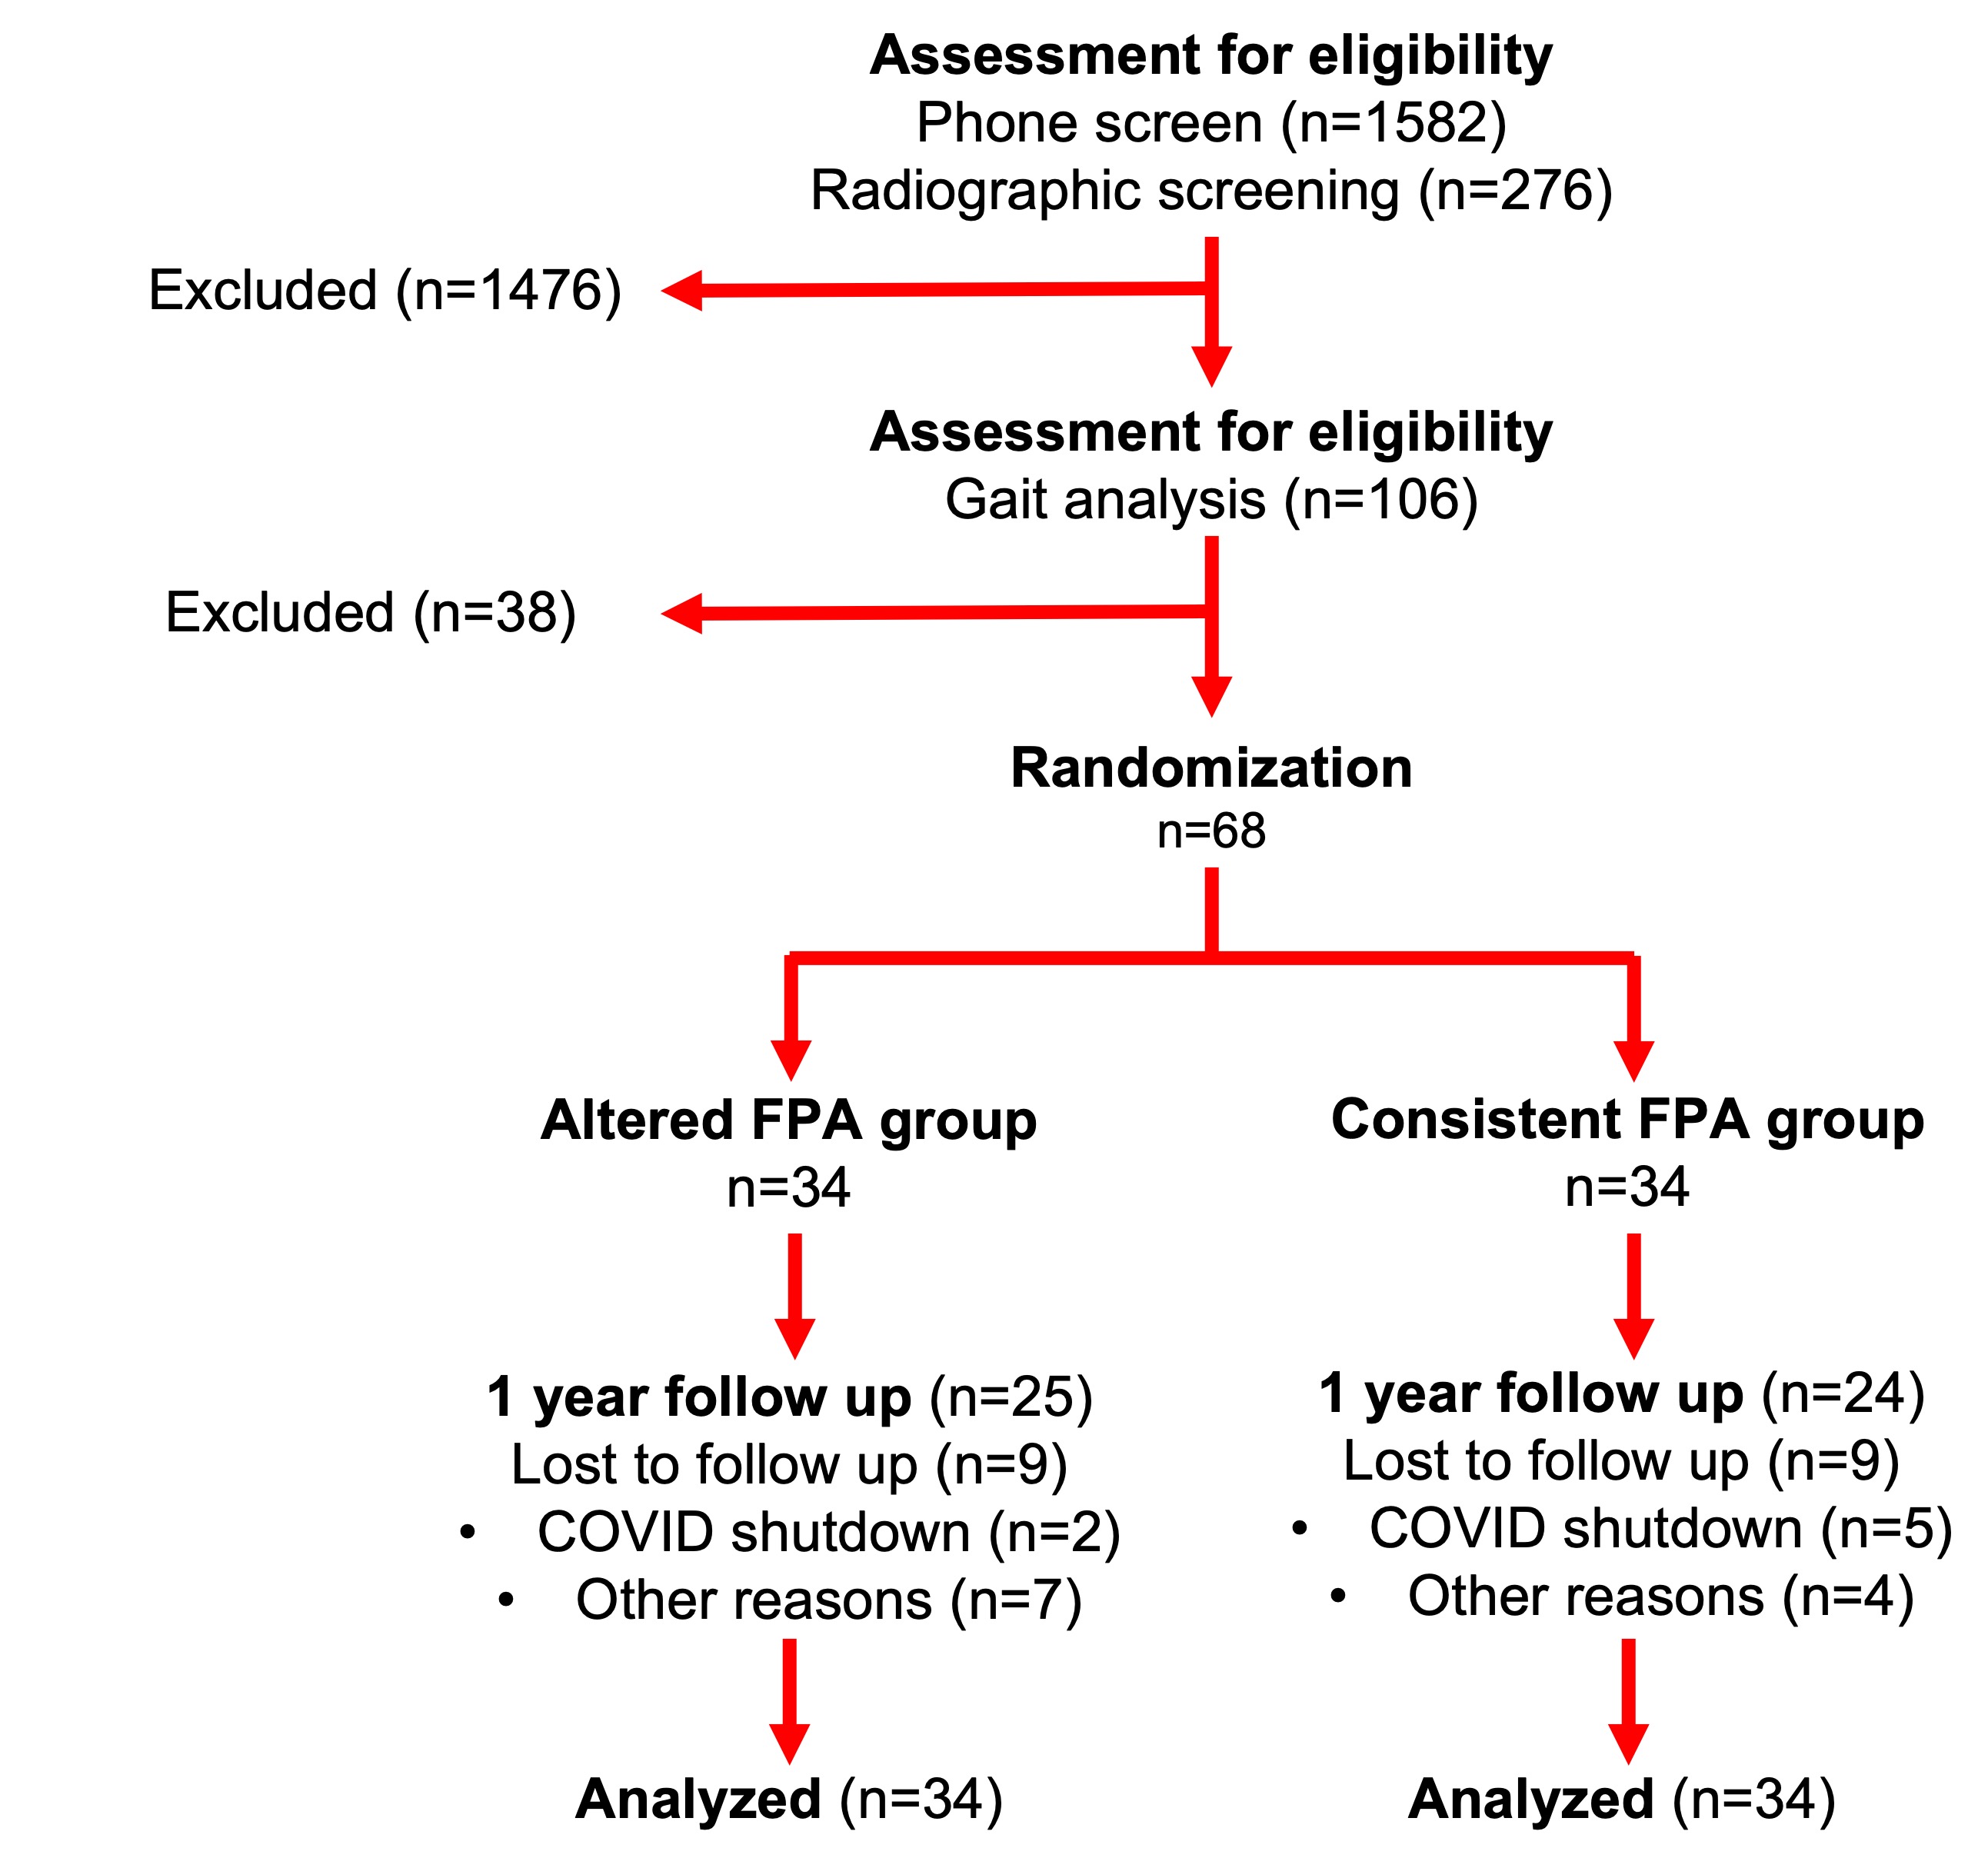
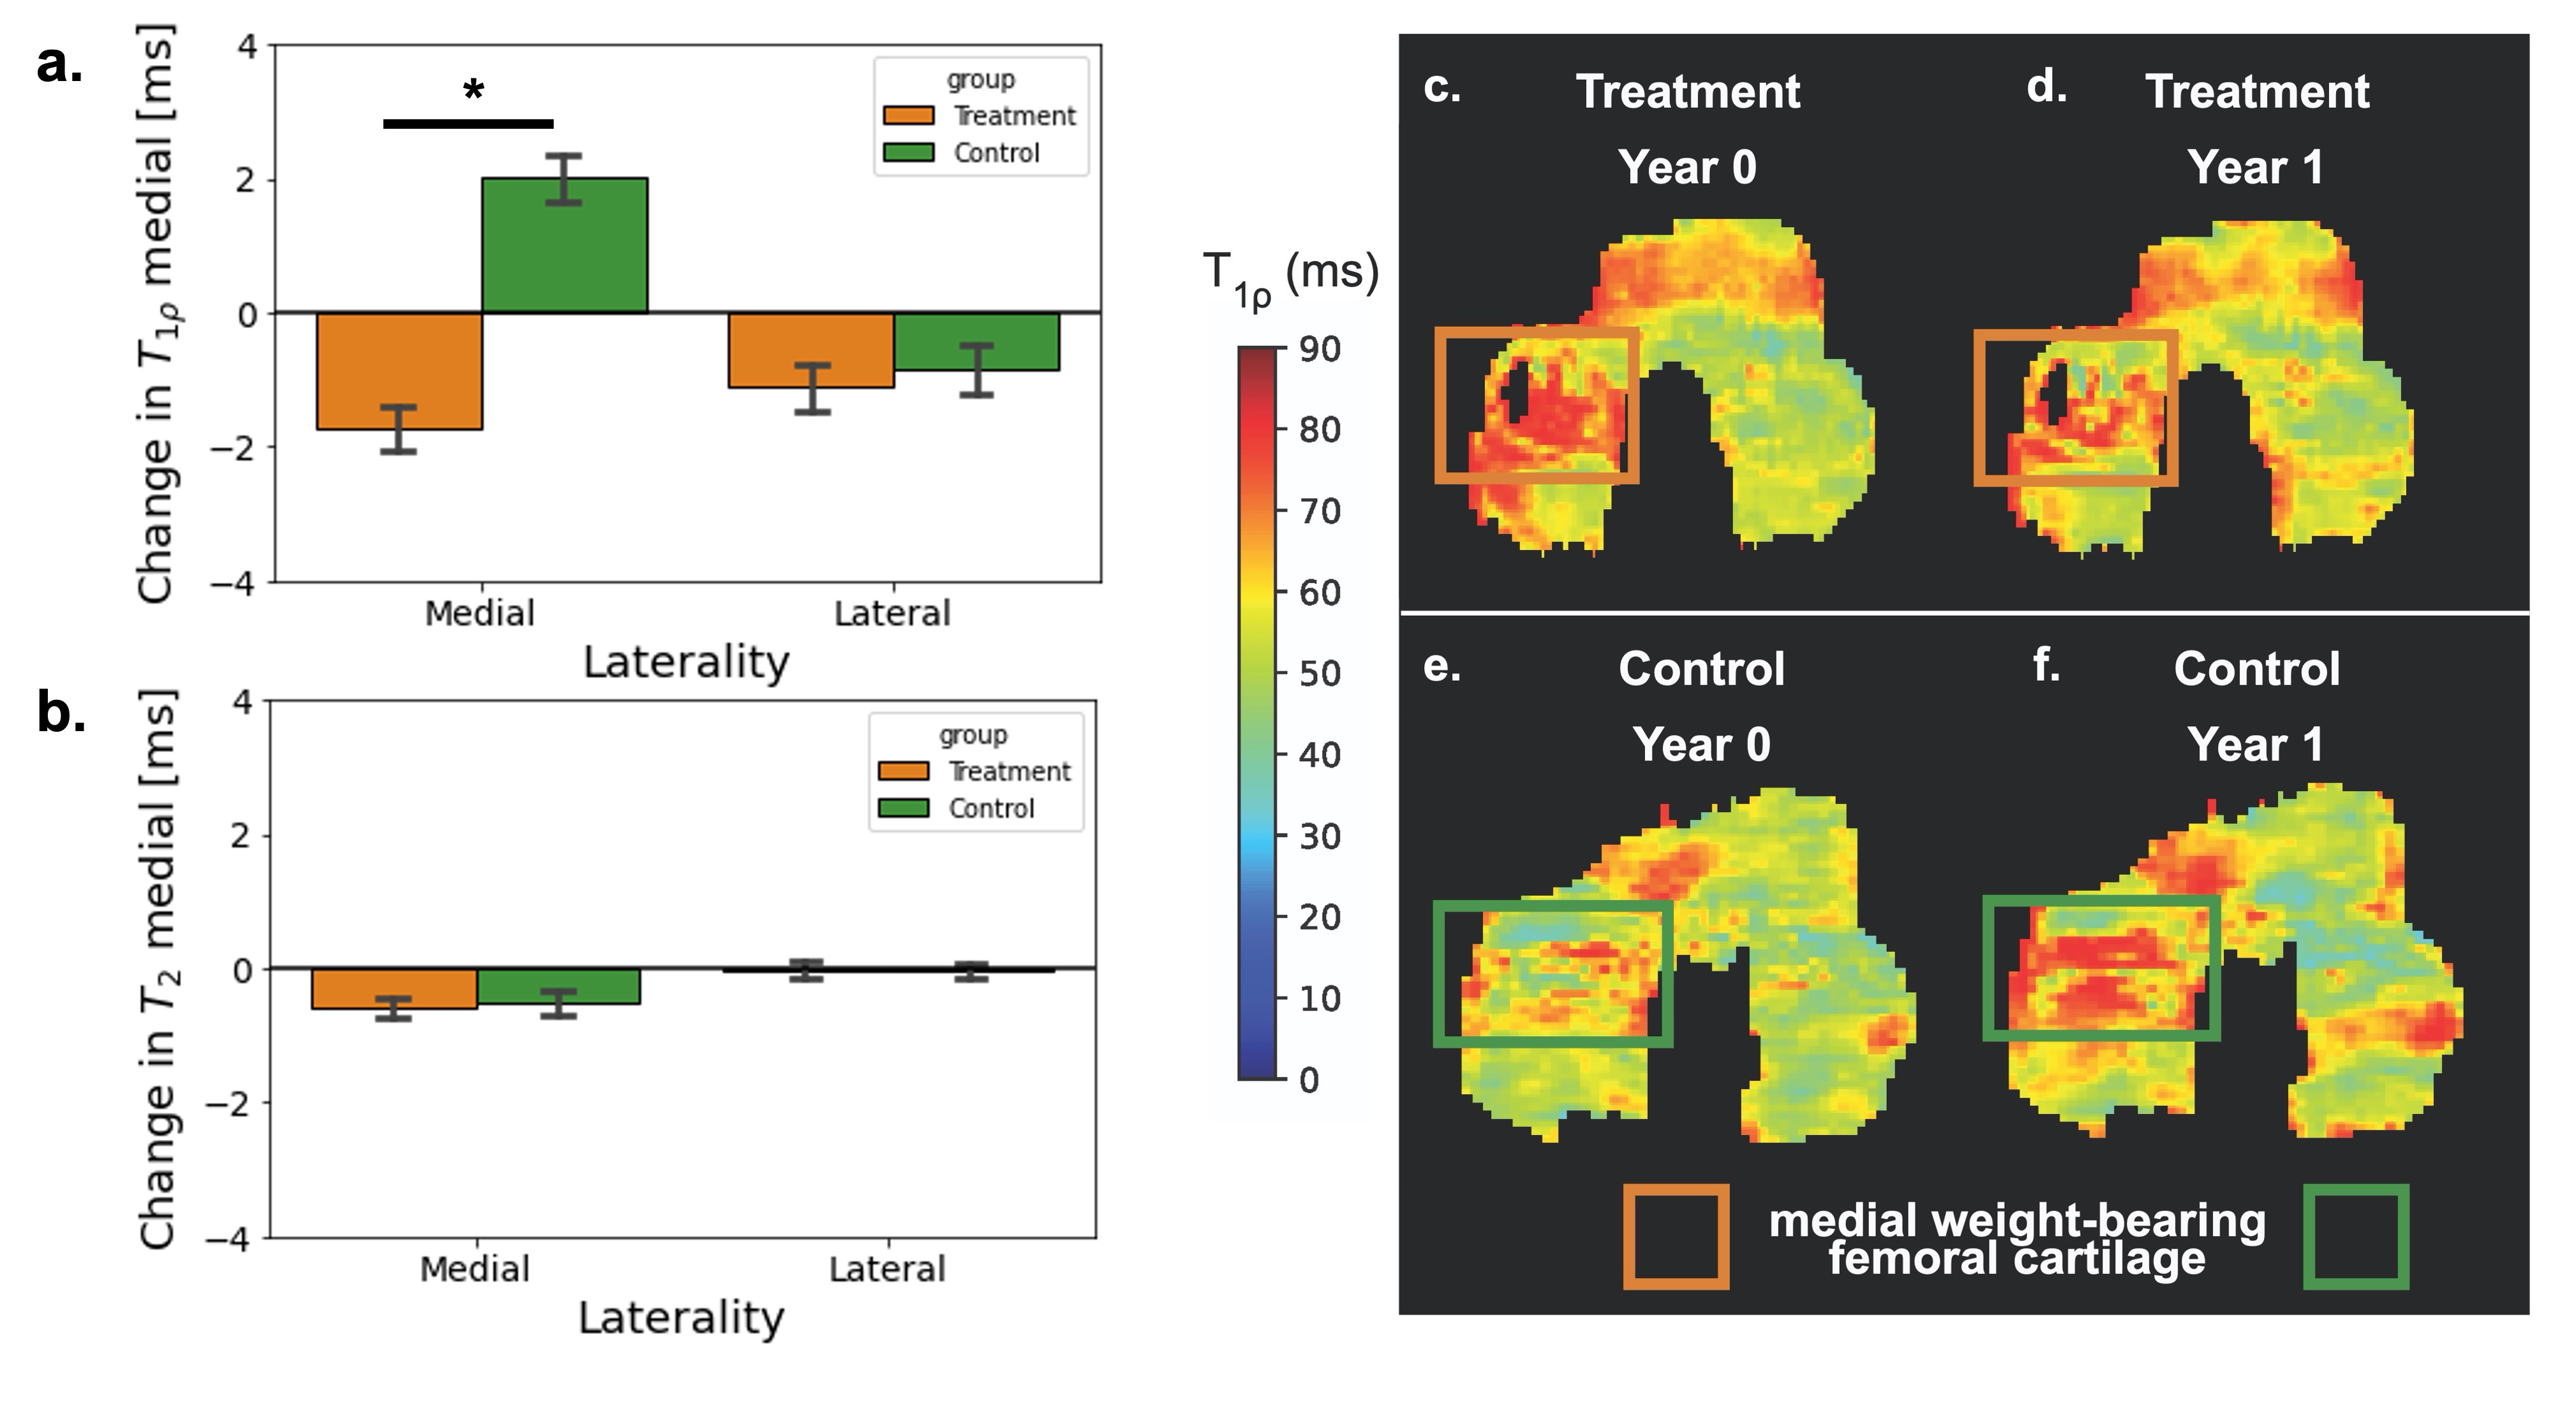
Sixty-eight individuals with medial knee OA enrolled in this clinical trial, and 49 completed it (Figure 2). Participants were randomized into an altered FPA group that was trained to walk with the FPA modification that maximally reduced their peak KAM (“Treatment”, 21 female, 13 male; BMI=25.5±3.3; KL I:7, II:4, III:13), and a consistent FPA group that was trained to walk more consistently with their natural FPA (“Control”, 20 female, 14 male, BMI=27.4±4.0; KL I:7, II:17, III:10 ). During six once-per-week gait retraining visits, participants received biofeedback to learn their target FPA. They were also instructed to walk with this FPA outside of the lab (Figure 1).MRI scans were performed at 3T (GE DISCOVERY MR750) using a 16ch phased-array flexible coil during the Year 0 and Year 1 visits. T2 relaxation times were estimated using a 3D qDESS sequence (5, 6) (TR=24.96 ms, TE1/ TE2=7.54/42.38 ms, FA=30°, FOV=160x160x120 mm3, voxel size=0.3125x0.3125x1.5 mm3, scan time=5min32s).T1ρ relaxation times were estimated using a magnetization-prepared pseudo-steady-state 3D FSE sequence (CubeQuant, FSL=500 Hz, TR/TE=1292/16 ms, FA=90°, FOV=160x160x120 mm3, voxel size = 0.5x0.625x3 mm3, TSL=1, 10, 30, 60 ms, total scan time=5min12s).The scans at Year 1 were non-rigidly registered to the corresponding Year 0 scans. The femoral cartilage was manually segmented, and the average pixelwise differences in T1ρ and T2 in the medial and lateral weight-bearing region were computed. Changes in Numerical Rate Scale (NRS) pain (0-no pain, 10-exctruciating pain, primary outcome), KAM (primary outcome), T1ρ and T2 (secondary outcome) were compared between Year 0 and Year 1 with using an Intent-To-Treat analysis. The missing data were imputed using the Markov chain Monte Carlo method for continuous variables. Correlation between the variables was calculated using Pearson analysis. A p-value p<0.05 was considered statistically significant.Results
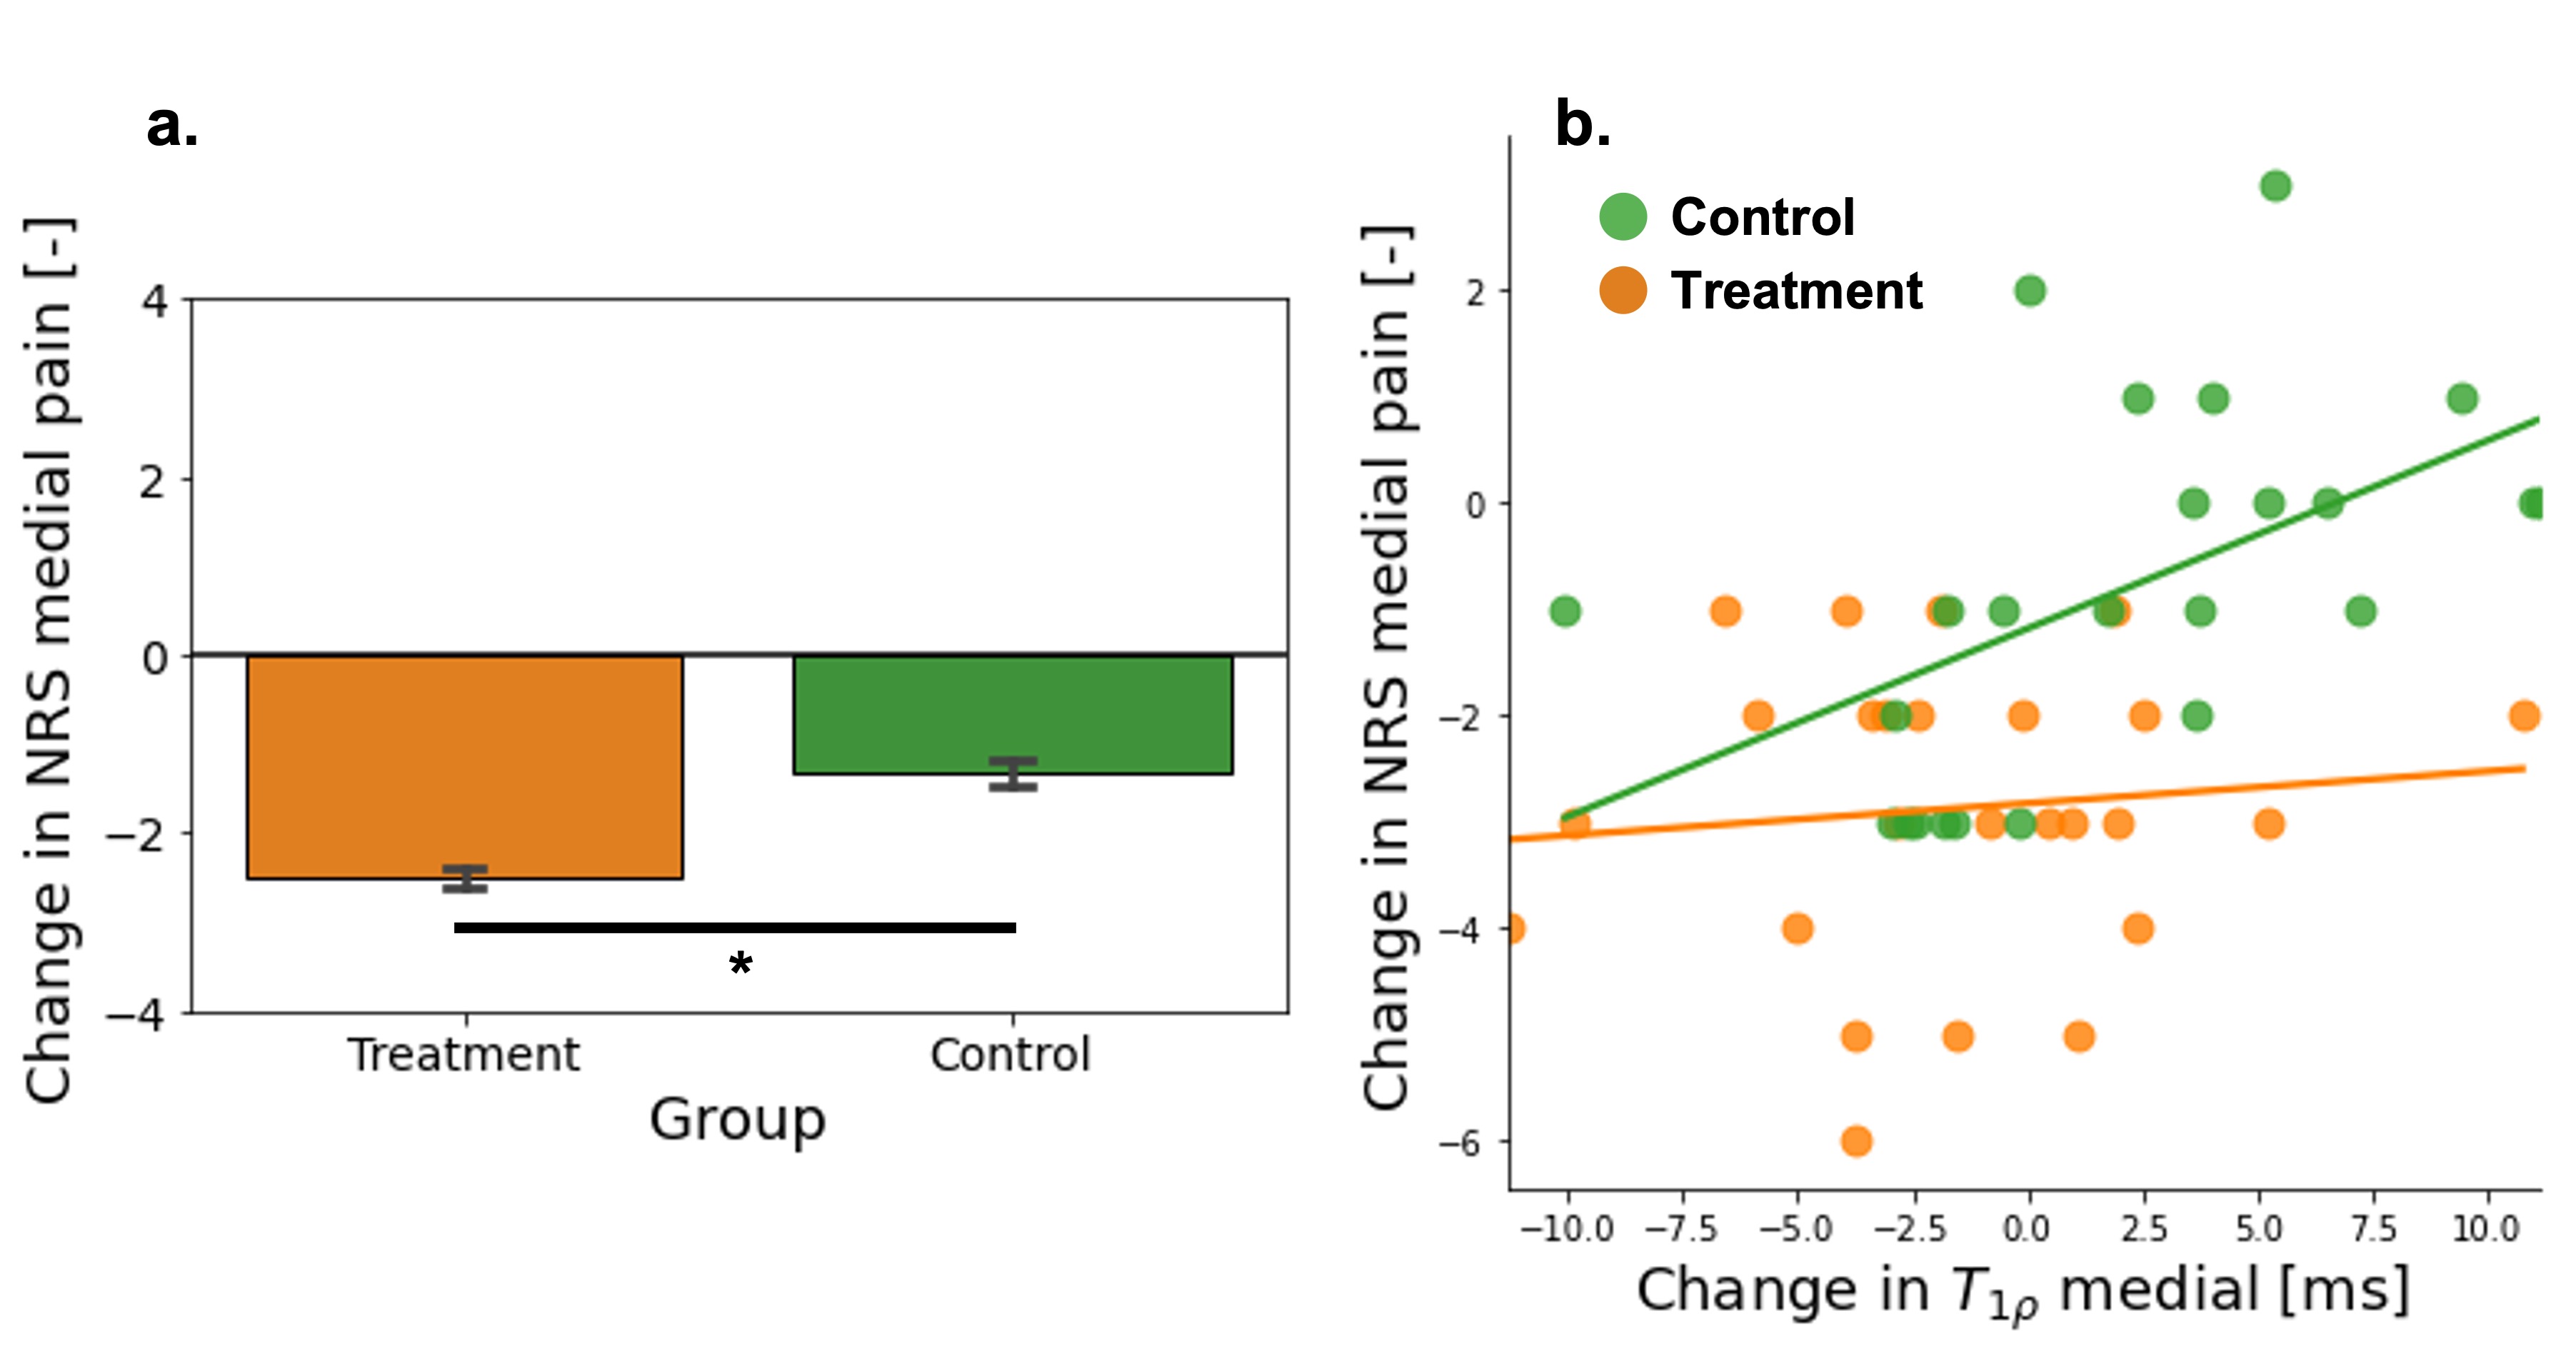
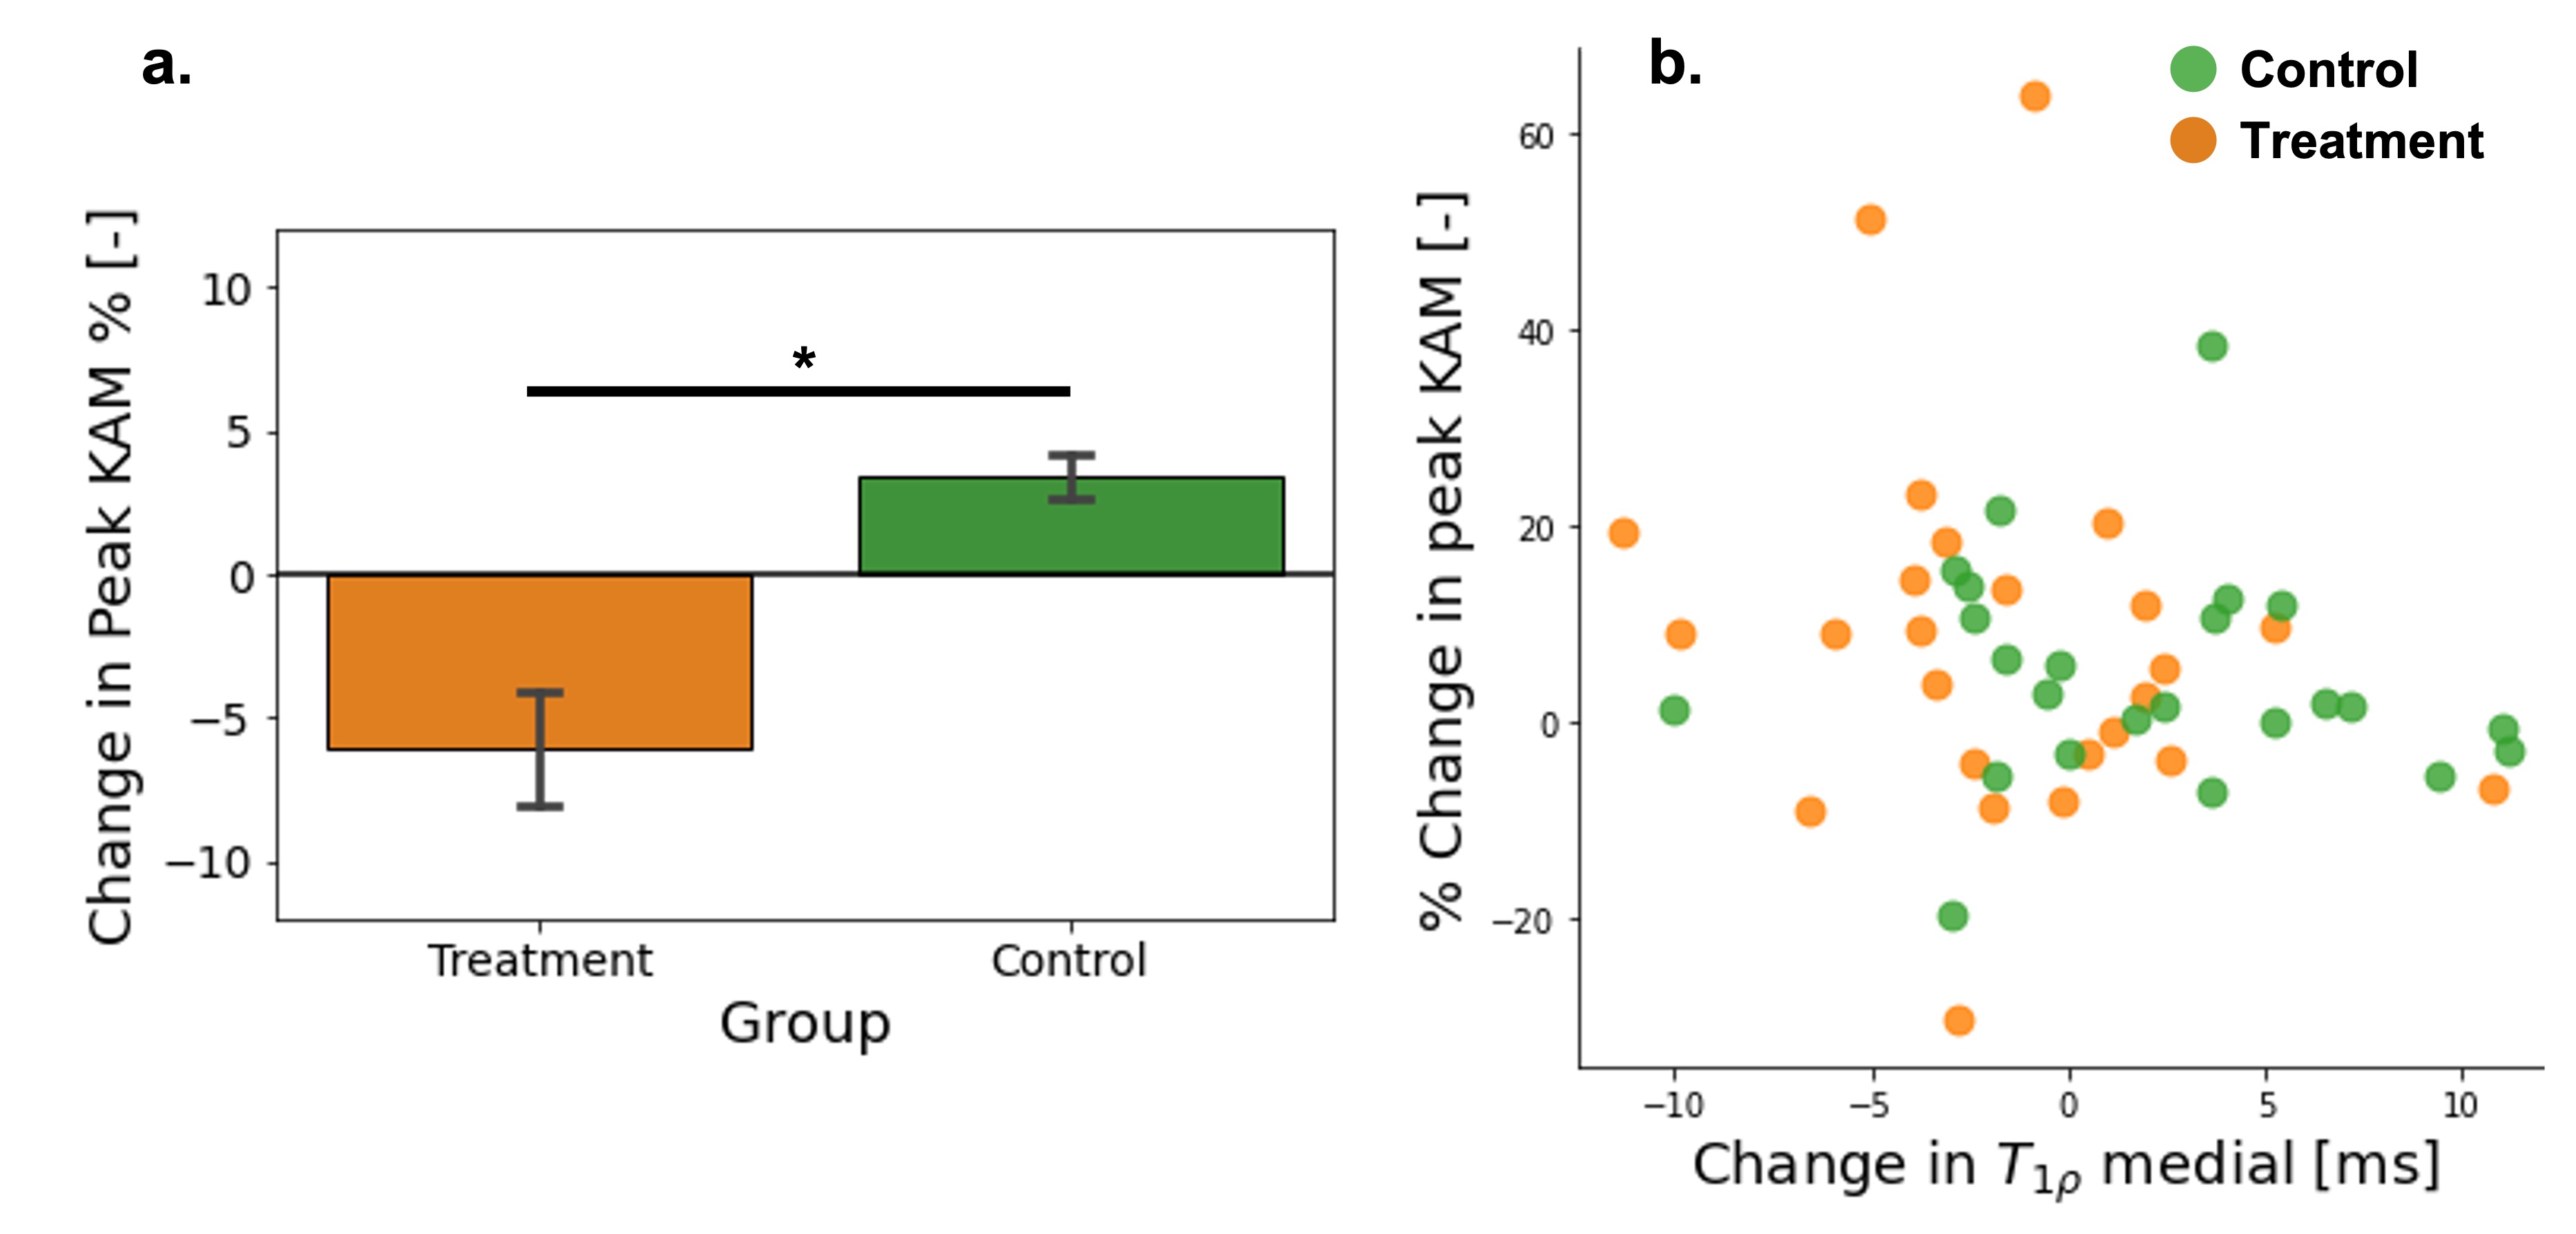
Patients in the Treatment group showed a reduction in T1ρ compared to the Control group in the medial compartment (p=0.006, Figure 3). No significant differences in T1ρ were observed for the lateral compartment between groups (p=0.854). There were no significant between-group differences in T2 (p=0.933 medial and p=0.995 lateral compartment). Pain decreased in both groups, with a bigger reduction in the Treatment group compared to the Control group (p=0.001, Figure 4). Pain was moderately but significantly correlating with T1ρ in the medial compartment (r=0.46, p=0.001).The Treatment group’s 5.2±14.5% reduction in peak KAM at Year 1 was greater than the 2.3±11.4% increase in the Control group (p=0.005, Figure 5). There was no significant correlation between target KAM peak and T1ρ (p=0.262).Discussion and Conclusions
For individuals with early-stage medial knee OA, personalized FPA modifications reduced medial joint loading (reduced KAM) and improved pain (reduced NRS). We observed higher sensitivity of T1ρ compared to T2 to detect short-term longitudinal changes caused by disease progression and intervention. This could be a natural consequence of the increased dynamic range of T1ρ, or could indicate that offloading the medial compartment had a larger effect on proteoglycans content. The Control group had an increase in T1ρ over 1 year, in agreement with typical disease progression (7), potentially indicating a depletion in proteoglycan content (8, 9). The reduction in T1ρ in the Treatment group could therefore indicate slowed cartilage degeneration, or increase in proteoglycan content promoted by load reduction (10, 11). The reduction in pain was associated with a reduction in T1ρ suggesting a connection between pain and microstructural characteristics. Interestingly, we observed no correlation between MRI parameters and KAM, suggesting that the measured changes in MRI are not caused by short-term differences in load patterns, but are longer-term.While more studies are needed to exactly determine the origin of the changes in the measured MRI signal, our results clearly indicate that quantitative MRI can monitor (potentially reversible) cartilage degeneration over one year and can be used as an outcome measure in clinical trials aimed at testing the efficacy of conservative interventions for OA. MRI has therefore great potential to accelerate testing and adoption of new disease-modifying drugs and non-surgical procedures for early-stage OA.
Acknowledgements
No acknowledgement found.References
1. Andriacchi TP, Mundermann A, Smith R, Alexander E, Dyrby C, Koo S: A Framework for the in Vivo Pathomechanics of Osteoarthritis at the Knee. Ann Biomed Eng 2004; 32:447–457.
2. Uhlrich SD, Silder A, Beaupre GS, Shull PB, Delp SL: Subject-specific toe-in or toe-out gait modifications reduce the larger knee adduction moment peak more than a non-personalized approach. J Biomech 2017; 66:103–110.
3. Hunt MA, Charlton JM, Krowchuk NM, Tse CTF, Hatfield GL: Clinical and biomechanical changes following a 4-month toe-out gait modification program for people with medial knee osteoarthritis: a randomized controlled trial. Osteoarthr Cartil 2018; 26:903–911.
4. Cheung RTH, Ho KKW, Au IPH, et al.: Immediate and short-term effects of gait retraining on the knee joint moments and symptoms in patients with early tibiofemoral joint osteoarthritis: a randomized controlled trial. Osteoarthr Cartil 2018; 26:1479–1486.
5. Chaudhari AS, Black MS, Eijgenraam S, et al.: Five-minute knee MRI for simultaneous morphometry and T 2 relaxometry of cartilage and meniscus and for semiquantitative radiological assessment using double-echo in steady-state at 3T. J Magn Reson Imaging 2017.
6. Chaudhari AS, Stevens KJ, Sveinsson B, et al.: Combined 5-minute double-echo in steady-state with separated echoes and 2-minute proton-density-weighted 2D FSE sequence for comprehensive whole-joint knee MRI assessment. J Magn Reson Imaging 2018:1–12.
7. Schooler J, Kumar D, Nardo L, et al.: Longitudinal evaluation of T1ρ and T2 spatial distribution in osteoarthritic and healthy medial knee cartilage. Osteoarthr Cartil 2014; 22:51–62.
8. Akella S V, Regatte RR, Gougoutas a J, et al.: Proteoglycan-induced changes in T1rho-relaxation of articular cartilage at 4T. Magn Reson Med 2001; 46:419–423.
9. Li X, Cheng J, Lin K, et al.: Quantitative MRI using T1ρ and T2 in human osteoarthritic cartilage specimens: Correlation with biochemical measurements and histology. Magn Reson Imaging 2011; 29:324–334.
10. Wei L, Hjerpe A, Brismar BH, Svensson O: Effect of load on articular cartilage matrix and the development of guinea-pig osteoarthritis. Osteoarthr Cartil 2001; 9:447–453.
11. Gawri R, Moir J, Ouellet J, et al.: Physiological loading can restore the proteoglycan content in a model of early IVD degeneration. PLoS One 2014; 9:1–8.
Figures