0342
The Knee Connectome: Studying Localized Synchrony in 8-year Cartilage Changes in Thickness and T21University of California, San Francisco, San Francsico, CA, United States, 2University of California, San Francisco, San Francisco, CA, United States
Synopsis
The trajectories of femur cartilage thickness and T2 relaxation time over an 8 year period were analyzed for 787 subjects from the Osteoarthritis Initiative dataset. Biomarkers were automatically extracted and used to generate time series for 27 regions of interest within the cartilage map to create a connectivity matrix (connectome). Statistically significant differences in thickness and T2 trajectories were found to correlate with demographic and clinical factors such as sex, BMI, Radiographic OA and presence of knee pain.
Summary of Main Findings
Correlations between longitudinal trajectories of femur cartilage thickness and T2 relaxation time vary significantly with sex, BMI, radiographic OA and presence of knee pain.Introduction
Osteoarthritis pathogenesis is marked by progressive degradation of the cartilage extracellular matrix that can be observed using quantitative Magnetic Resonance Imaging (qMRI) through imaging biomarkers such as T2 relaxation time and cartilage thickness loss on high resolution 3D MRI1-2. Recent advances in deep learning have brought new end-to-end models enabling quantification of such markers on large datasets3-5. Leveraging this achievement, in this study we analyze longitudinal changes in qMRI biomarkers on 787 subjects from the Osteoarthritis Initiative (OAI)6 with the aim of quantifying local and diffuse synchrony of trajectory in relationship with demographic and clinical factors. With this study we take the first steps in establishing the knee connectome as a tool to exploit functional and compositional connectivity driven by distribution of loading, skeletal biomechanics and joint morphology.Methods
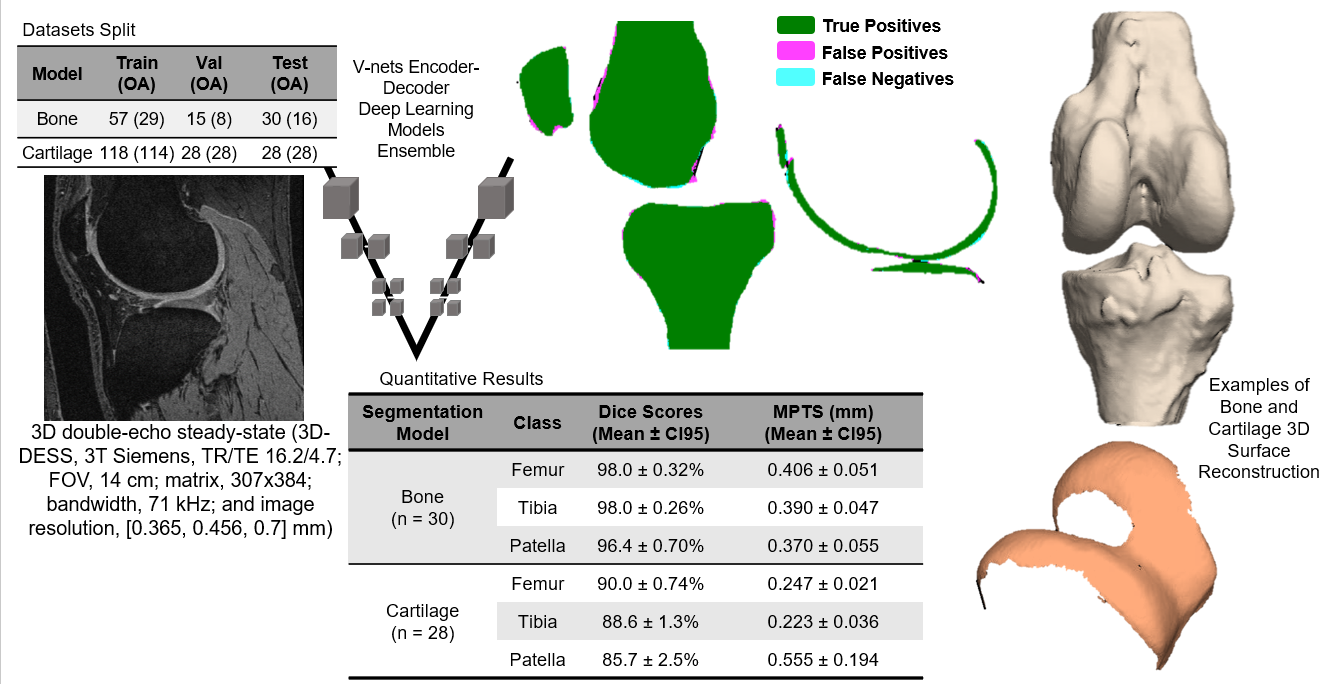
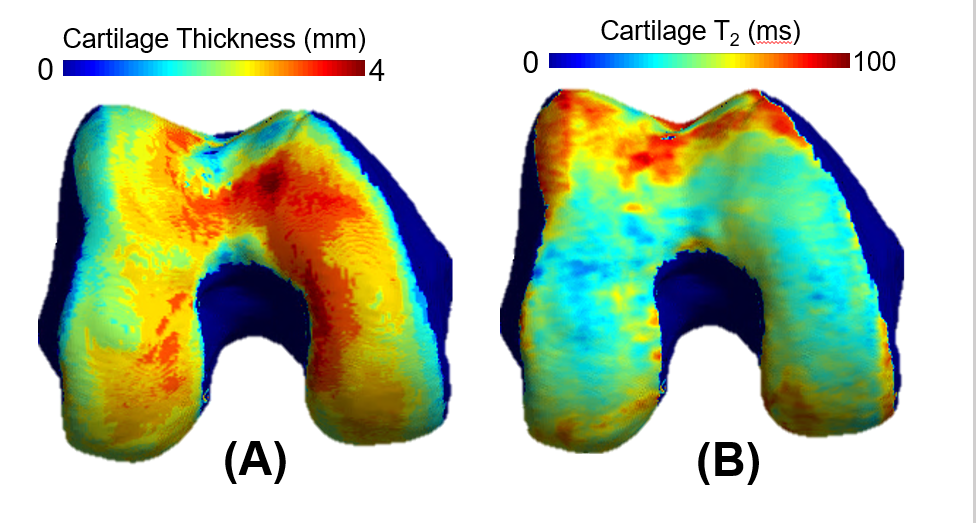
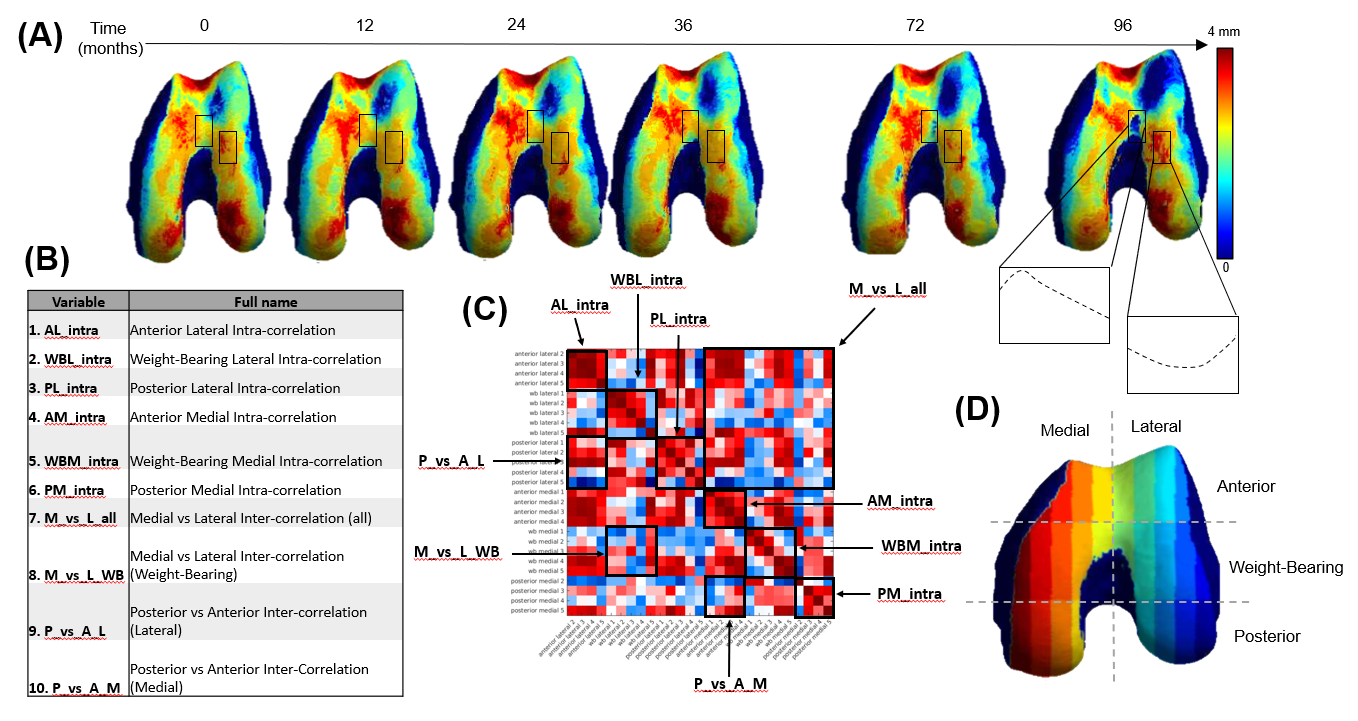
Dataset: The Osteoarthritis Initiative (OAI)6 dataset used for this study contains 3D double-echo steady-state (3D-DESS, 3T Siemens, TR/TE 16.2/4.7; FOV, 14 cm; matrix, 307x384; bandwidth, 71 kHz; and image resolution, [0.365, 0.456, 0.7] mm) and 2D multi-slice multi-echo (2D-MSME, 3T Siemens, TR/TE 2700/10,20,30,40,50,60,70; FOV, 12 cm; matrix, 269x384; bandwidth, 96 kHz; and image resolution, [0.313, 0.446, 3] mm). MRI scans were performed on 4,796 subjects at seven time points [0,12,24,36,48,72,96] months, resulting in an imaging span of eight years. Demographic data such as age, body mass index (BMI), and sex were also recorded during each visit. Image Processing: A bone and a cartilage segmentation model ensemble based on multiple 2D and 3D V-nets was trained on 72 and 148 manually annotated 3D-DESS volumes to automatically segment the femur, tibia, and patella bones and corresponding cartilage. Model descriptions were previously reported and performances are summarized in Figure 1. The trained models were used to segment all the 3D-DESS volumes available in OAI (45,789); cartilage thickness maps were obtained from the segmented masks using a distance transform method previously proposed3. T2 values were calculated by registering 3D-DESS cartilage masks to the matching MSME MRI volumes and performing parametric T2 fitting on the cartilage. The calculated thickness and average T2 values of the overlying cartilage were projected to each perpendicular point in the articular bone surface4 (Figure 2). Data selection: We selected subjects with both 3D-DESS and MSME available that completed all imaging follow up visits for a total of 787 subjects (age=58.9 ± 0.6, BMI = 27.5 ± 0.3, KOOS pain = 89.5 ± 0.9, 346/441 Male/Female, KLG range 0:3 with the following distribution: 0 : 517, 1: 222, 2: 29, 3: 19). Connectome: We created a parcellation of the femur cartilage by dividing the mask into 2 equally spaced sections along the x axis corresponding to medial and lateral sides and 3 sections along the y axis, labeled anterior, weight-bearing, and posterior. Each of the 6 sections was further divided into 5 subsections, 3 of which fell outside cartilage mask, resulting in 27 compartments (Figure 3D). Cartilage thickness and T2 longitudinal trajectories were calculated for each of the compartments. We obtained 10 summary indices (Figure 3B) per subject by averaging the Pearson Correlation Coefficient R between the resulting time series of interest. Statistical Analysis: Stepwise logistic regression was used to assess relationships between the thickness and T2 connectome indices and baseline demographics and clinical factors such as gender, BMI, radiographic OA and presence of knee pain.Results and Discussion
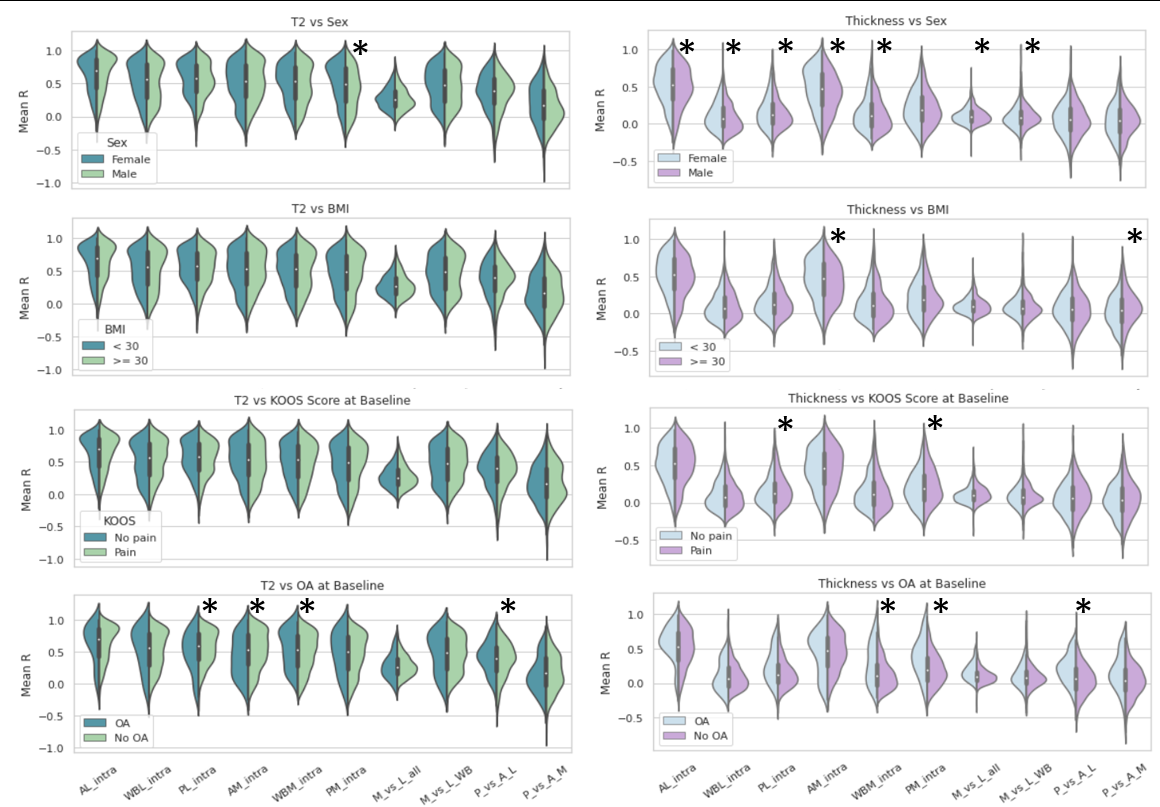
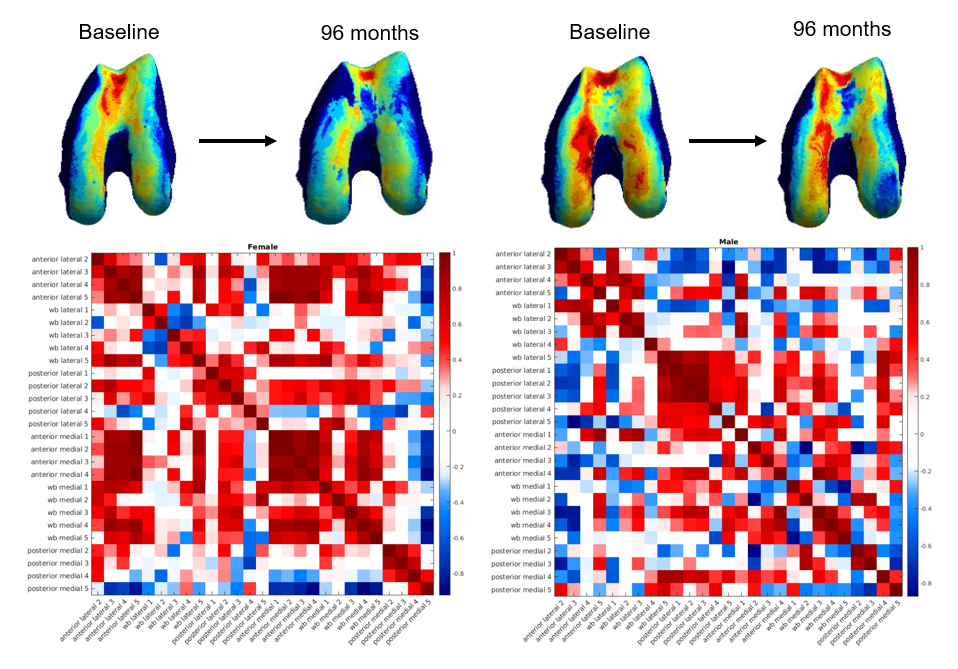
The distributions of indices split by test variables are shown in Figure 4. We show significant relationships between several variables, the most notable being the sex difference in cartilage thickness trajectories. Both inter- and intra-region correlations were significantly higher for female participants, with the largest difference in anterior medial intra-correlation (Male mean R=0.40, Female mean R=0.49, p=1.53e-06). This can be interpreted as an indication that females show more diffuse changes in cartilage thickness over time. In Figure 5 we present an example male and female participant where the female correlation matrix depicts higher correlation, particularly in the blocks along the diagonal corresponding with intra-region correlation. Another noteworthy difference is in thickness trajectories in participants reporting pain, where the largest difference is in posterior medial intra-correlation (Pain mean R=0.24, No pain mean R=0.20, p=0.006).Conclusions
In this study we show the first results obtained from a knee connectome applied to longitudinal data from OAI. Different patterns of functional and compositional connectivity were observed to be associated with demographics and clinical profile of subjects. Female participants showed more diffuse synchronous change in cartilage thickness that could be more consistent with systemic inflammatory phenotype, compared to males showing more localized difference more consistent with biomechanical or post traumatic phenotype7-8.Acknowledgements
No acknowledgement found.References
1. Bhosale AM, Richardson JB. Articular cartilage: structure, injuries and review of management. Br Med Bull. 2008;87(1):77-95. doi:10.1093/bmb/ldn025
2. Goodwin DW, Dunn JF. High-resolution magnetic resonance imaging of articular cartilage: correlation with histology and pathology. Topics in magnetic resonance imaging: TMRI. 1998 Dec 1;9(6):337-47.
3. Iriondo C, Liu F, Calivà F, Kamat S, Majumdar S, Pedoia V. Towards understanding mechanistic subgroups of osteoarthritis: 8‐year cartilage thickness trajectory analysis. Journal of Orthopaedic Research. 2021 Jun;39(6):1305-17.
4. Morales, A.G., Lee, J.J., Caliva, F. et al. Uncovering associations between data-driven learned qMRI biomarkers and chronic pain. Sci Rep 11, 21989 (2021).
5. Morales Martinez A, Caliva F, Flament I, Liu F, Lee J, Cao P, Shah R, Majumdar S, Pedoia V. Learning osteoarthritis imaging biomarkers from bone surface spherical encoding. Magnetic resonance in medicine. 2020 Oct;84(4):2190-203.
6. Peterfy CG, Schneider E, Nevitt M. The osteoarthritis initiative: report on the design rationale for the magnetic resonance imaging protocol for the knee. Osteoarthritis and cartilage. 2008 Dec 1;16(12):1433-41.
7. O'Connor MI. Sex differences in osteoarthritis of the hip and knee. J Am Acad Orthop Surg. 2007;15 Suppl 1:S22-5. PMID: 17766785.
8. Srikanth VK, Fryer JL, Zhai G, Winzenberg TM, Hosmer D, Jones G. A meta-analysis of sex differences prevalence, incidence and severity of osteoarthritis. Osteoarthritis and cartilage. 2005 Sep 1;13(9):769-81.
Figures